

Summary
Aim
Type 2 diabetes (T2D) is a major complication of obesity and a leading cause of morbidity and mortality. Antagonizing bradykinin type 1 receptor (B1R) improved body and tissue fat mass and reversed vascular and adipose tissue inflammation in a rat model of insulin resistance. This study aimed at evaluating further the role of B1R in a mouse model of T2D by comparing the antidiabetic and anti‐inflammatory effects of the B1R antagonist SSR240612 (SSR) in adipose tissue with those of pioglitazone (TZD), an activator of peroxisome proliferator‐activated receptor gamma.
Methods
C57BL/6J mice were fed with high‐fat diet (HFD) or standard diet (control) for 20 weeks. Yet, during the last 4 weeks, HFD‐fed mice were administered SSR and TZD (10 mg kg−1 d−1 each) as monotherapy or combined therapy subcutaneously. The impact of treatments was measured on metabolic hormones levels (ELISA), adipose tissue inflammatory status and the expression of candidate genes involved in T2D (quantitative real‐time polymerase chain reaction and western blot).
Results
SSR240612 and TZD treatments improved hyperglycaemia, hyperinsulinaemia, insulin resistance, adipose tissue inflammation (expression of B1R, chemokine ligand 2, F4/80 and tumour necrosis factor) and modulated adipogenesis (peroxisome proliferator‐activated receptor gamma, adipocytes' protein 2 and CD40 expressions) in HFD‐fed mice. Yet, SSR was more effective than TZD to reduce visceral fat mass and resistin. TZD/SSR combined treatment had an additive effect to improve insulin sensitivity and glucose intolerance.
Conclusion
Bradykinin type 1 receptor antagonism could represent a promising therapeutic tool in combination with TZD for the treatment of T2D, obesity and insulin resistance.
Keywords: Adipose tissue inflammation, bradykinin B1 receptor, obesity, PPARγ
When increasing caloric nutrient intake, the insulin resistance moves to oppose excessive energy storage and unlimited weight gain. Systemic hyperglycaemia further stimulates insulin secretion in pancreatic cells 1; it is obesity‐linked type 2 diabetes (T2D) characterized by hyperglycaemia and insulin resistance. Decreased adipose tissue glucose and lipid uptake due to obesity and increased leptin secretion are the major changes in T2D consequently to the low adipogenesis activity and an increased adipocyte size in a diabetic state.
Peroxisome proliferator‐activated receptor gamma (PPARγ) is a transcription factor that exerts a pivotal role in controlling adipogenesis and adipokine secretion, hormones involved in the metabolism of carbohydrates and fats. Obesity is associated with dysfunctional hormonal regulation leading to not only physiological and metabolic dysfunction but also the secretion of several cytokines (tumour necrosis factor [TNF], IL‐1β, etc.) reflecting inflammation of the adipose tissue 2. The adipose tissue reacts to inhibit insulin signalling and energy intake responsible for adipocyte differentiation to counteract the disproportionate development of its volume 3. Thus, leptin, an adipokine whose concentration correlates with fat mass, inhibits insulin secretion and its systemic action 3, 4. Oppositely, adiponectin, an insulin‐sensitizing adipokine, sees its secretion decrease with weight gain to lower insulin sensitivity 3, 4, 5. Finally, TNF secreted by adipose tissue inhibits insulin signalling 6.
A decrease of PPARγ gene expression level has been associated with an increased weight gain and an imbalance of the adipokine secretion levels in diabetic mice 7. PPARγ exerts an inhibitory effect on NF‐κB 8, a nuclear factor involved in transcription of many genes encoding inflammatory proteins 9 such as the bradykinin type 1 receptor (B1R) 10, 11. The B1R belongs to the family of kinin receptors that is absent at the physiological state and induced by proinflammatory cytokines and the oxidative stress 10. Its phenotype is associated with organ damage ascribed to immune cell infiltration and platelet aggregation 12, 13. Some studies showed that treatment with B1R antagonists improves insulin sensitivity and reverses related complications (hypertension and neuropathic pain) in a high glucose‐related insulin resistance model 14. Importantly, blockade of bradykinin B1R decreases the weight load, blunts immune cells infiltration and inhibits proinflammatory cytokine expression in diabetic rat models 11, 12, 15, 16.
Thiazolidinediones (TZDs), a family of PPARγ ligands, are powerful oral insulin sensitizers used in the treatment of T2D. The hypoglycaemic effect of TZD treatment is mediated by changes in the adipose tissue physiology 17, 18, 19. Creation of new lipid storage units decreases its circulating level, generates healthy adipocytes, improves adipose tissue endocrine activity and, thereby, decreases glucose intolerance. However, the TZD use in clinics has been prohibited in many countries because they were associated with serious side effects (congestive heart failure, oedema, bone fractures and cancer) 20, 21.
Thus, this study addresses the hypothesis that an anti‐inflammatory drug, used as a combinatory treatment to TZD, will reduce its secondary effects and inflammation in diabetic patients. This will lead, hopefully, to the development of a promising therapeutic approach in T2D management. Therefore, the present study was undertaken to compare the antidiabetic effect of pioglitazone (TZD) combined or not with the anti‐inflammatory effect of the bradykinin B1R antagonist SSR240612 (SSR) in a high‐fat diet (HFD)‐induced T2D mouse model.
Material and methods
Drugs and reagents
The selective non‐peptide B1R antagonist SSR240612 [(2R)‐2‐[((3R)‐3‐(1,3‐benzodioxol‐5‐yl)‐3‐[[(6‐methoxy‐2‐naphthyl)sulfonyl]amino]propanoyl)amino]‐3‐(4‐[[2R,6S)‐2,6‐dimethyl‐piperidinyl]methyl]phenyl)‐N‐isopropyl‐N‐methylpropanamide‐hydrochloride] was graciously obtained from Sanofi‐Aventis (France). SSR240612 and TZD (Tocris) were dissolved in dimethyl sulfoxide (0.5% v/v), ethanol (5% v/v) and saline (94.5%). All other chemicals used were purchased from standard commercial suppliers.
Experimental protocol
Animal procedures were approved by the Animal Care Committee of the Université de Montréal. Experiments were performed on 5‐week‐old male C57BL/6J mice (Jackson Laboratory) housed under controlled conditions with free access to food and water. Six mice were fed a standard diet (3.8 kcal g−1; 6% fat and 57% sucrose), and 24 were fed a low‐cholesterol HFD (5.2 kcal g−1; 34.9% fat and 26.3% sucrose) for 20 weeks. During the last 4 weeks of the diet intervention, mice receiving the HFD were split into four groups of treatment: vehicle, TZD (10 mg kg−1 d−1) and/or SSR (10 mg kg−1 d−1) 14, 16 given subcutaneously.
Intraperitoneal glucose tolerance test and intraperitoneal insulin sensitivity test
For the intraperitoneal glucose tolerance test (IPGTT), the mice were administered 2 g kg−1 of d‐glucose solution after overnight fasting. For the intraperitoneal insulin sensitivity test (IPIST), the nonstarved mice were intraperitoneally injected with insulin (1 U kg−1). Blood samples were obtained from tail veins at 0, 15, 30, 45, 60, 90, 120 and 180 min after injection, and glucose concentrations were measured by using an Accu‐Chek Aviva® glucometer (RocheDiagnostics).
Biochemical analyses and homeostatic model assessment insulin resistance calculation
Overnight‐fasted mice were sacrificed by cardiac exsanguination under anaesthesia, and plasma was stored at −20°°C until analysis. Plasma insulin, adiponectin and leptin concentrations were measured by using mouse ELISA (Millipore‐Corporation). Plasma resistin level was analysed by using a mouse resistin ELISA (Abcam).
Insulin resistance was assessed by calculation of homeostatic model assessment insulin resistance (HOMA‐IR), correlated with the insulin sensitivity 22, 23, according to the following formula:
[HOMA‐IR (mM × μU ml−1) = fasting glucose (mM) × fasting insulin (μU ml−1)]/22.5
Quantification of mRNA level
cDNA was made from 1 μg of extracted RNA by using iScript cDNA Synthesis Kit (BioRad) as per the manufacturer's instructions. Quantitative real‐time polymerase chain reaction (PCR) analysis was performed by using Brilliant‐II SYBR® Green (Stratagene) and specific primers for targeted genes (Table S1) by using the default protocol described previously 7. All results were normalized to cyclophilin A mRNA expression, and the relative differences in gene expression between treatment groups and control were determined by using the ΔΔCt method.
Protein extraction and western blot
Adipose tissue proteins were extracted by using delipidation protocol 24, 25. Briefly, 100–200 mg of retroperitoneal adipose tissue was homogenized in 500 μl of isolation medium (50 mM of Tris‐HCl, 150 mM of NaCl, 0.2 mM of ethylenediaminetetraacetic acid and protease inhibitors) in a cold glass–glass conical tissue grinder. Homogenate was then vigorously mixed in 1,875 μl of chloroform/methanol mixture (1 : 2). After 15 min, 1.25 ml of H2O/chloroform mixture (1 : 1) was mixed to the homogenate and centrifuged (800g, 5 min), allowing separation of proteins (top aqueous phase) from the lower lipidic phase. Antibodies anti‐PPAR‐γ, anti‐CD40 and anti‐CD154 were purchased from SantaCruz Biotechnology. The anti‐aP2 (adipocytes' protein 2) was purchased from Cayman Chemical.
Adipocyte sizing
After overnight fixation in 4% paraformaldehyde, retroperitoneal fat wedges were embedded in paraffin and cut into 20‐μm sections. Slides were stained with haematoxylin and eosin after deparaffinization. Mayer's haematoxylin was added to the slides before eosin‐Y staining. Sections snapshots, taken by using DAGE‐MTI_CCD72 digital camera, were analysed with mcid‐m1 software (ImagingResearch). Adipocyte size, expressed in mm2, represents the average of 20 cells per section in 5 sections per mouse (5–6 mice/group). Colour photomicrographs were taken with a camera (QImaging Retiga‐2000R).
Statistical analyses
All statistical analyses, presented as mean ± SEM, were performed by using sas version 9.0 (SAS‐Institute) and conducted at the 0.05 significance level. Differences between mean values for the weight gain across time adjusted for the baseline weight value and adipokines and mRNA expression levels were compared by repeated measures analysis of covariance (ANCOVA). ANOVA models were used to study the glycaemic parameters.
Results
Results are presented as a mean of all mice in each group (n = 6) unless differently specified.
Weight gain and adipocyte morphometry
Repeated measures ANCOVA model was used to study the weight gain across time and between mouse groups, adjusted for the baseline weight value. The group × time interaction was also included in the ANCOVA model, and comparisons between groups at a given time point were undertaken only in the presence of a significant group × time interaction. Otherwise, global conclusions were drawn based on the main time and group effects of the model.
High‐fat diet increased body weight by more than three‐fold compared with control. The TZD treatment did not affect HFD‐induced weight gain, while the SSR induced a significant reduction in weight gain compared with HFD‐fed mice (Figure 1a). The retroperitoneal fat content was markedly greater in HFD group (Figure 1c) with an overt hypertrophy of the adipocytes (Figure 1b–d). Only SSR treatment reduced significantly retroperitoneal fat mass. Although TZD treatment reduced adipocyte size in the HFD group, hypertrophy was decreased further by SSR treatment, while TZD + SSR treatment was similarly effective as SSR alone (Figure 1d).
Figure 1.

Effect of pioglitazone (TZD) and SSR240612 (SSR) on weight gain (a), visceral fat accumulation (c) and adipocytes' size (d) in high‐fat diet (HFD)‐fed mice. Values presented as means ± SEM. ***p ≤ 0.001 versus SD group; † p ≤ 0.05; †† p ≤ 0.01 versus HFD group. Histology of the adipose tissue is also shown (b).
Glucose tolerance
High‐fat diet‐fed mice have developed a significant increase (p ≤ 0.01) in fasting glycaemia (11.8 ± 1.6 mM) compared with control (4.8 ± 0.36 mM). Fasting glycaemia was improved with TZD treatment (5.6 ± 0.4 mM) as well as with SSR treatment (7.2 ± 1.22 mM) and with the combination of the two drugs (6.2 ± 0.47 mM) in diabetic mice.
In parallel, overt glucose intolerance was observed in HFD‐fed mice compared with control as reflected by the IPGTT (Figure 2a; area under the curve, AUC = 4,238 for HFD group vs. 2,220 for control; p ≤ 0.001). TZD normalized glucose intolerance (AUC = 2,508; p ≤ 0.01), an effect maintained in combination with SSR (AUC = 2,898; p ≤ 0.01). No significant effect on the glucose intolerance was observed with the SSR treatment (AUC = 3,737).
Figure 2.

Glycaemic parameters in mice‐treated groups compared with diabetic mice reported by the intraperitoneal glucose tolerance test (IPGTT) (a) and the intraperitoneal insulin sensitivity test (IPIST) (b) performed at the 20th week of the protocol and after 4 weeks of corresponding treatment. Insulin level (c) was evaluated at the end of the protocol to calculate homeostatic model assessment insulin resistance (HOMA‐IR; d). Values expressed as mean ± SEM. *p ≤ 0.05, ***p ≤ 0.001 versus SD group; † p ≤ 0.05; ††† p ≤ 0.001 versus high‐fat diet (HFD) group.
Intraperitoneal insulin sensitivity test (Figure 2b) demonstrated a quick decline in plasma glucose 15 min after the insulin injection in SD group (AUC = 417.6), while plasma glucose remained unchanged in HFD‐fed mice at all time point test (AUC = 1,159; p ≤ 0.001 vs. SD). Although SSR treatment failed to affect this pattern (AUC = 1,253; p ≤ 0.001 vs. SD), TZD treatment significantly improved insulin resistance (AUC = 738.8; p ≤ 0.001 vs. HFD and HFD + SSR), an amplified effect with TZD + SSR treatment (AUC = 552; p ≤ 0.001 vs. HFD, HFD + SSR; p ≤ 0.05 vs. HFD + TZD).
Further, HFD‐fed mice showed increased fasting insulinaemia (Figure 2c) and insulin resistance (Figure 2d) compared with control (p ≤ 0.001). These results emphasize the T2D state of HFD‐fed mice shown to have developed glucose intolerance and insulin resistance. TZD treatment significantly (p ≤ 0.001) reduced circulating insulin level and insulin resistance in diabetic mice (p < 0.01 vs. HFD), an effect that is less striking with SSR treatment (p < 0.05 vs. HFD) even in combination with TZD (p < 0.05 vs. HFD).
Blood biochemistry
As expected, leptin levels were significantly increased (p < 0.001 vs. SD) in HFD‐fed mice (Figure 3a) and treatments had no significant impact on this factor. Oppositely, adiponectin was decreased in HFD fed mice (p < 0.01 vs. SD; Figure 3b). Whereas TZD treatment prevented the fall in adiponectin levels, SSR combined or not with TZD failed to improve adiponectin levels in HFD‐fed mice.
Figure 3.

Fasting plasma levels of leptin (a), adiponectin (b) and resistin (c) assessed by ELISA. Values expressed as mean ± SEM. *p ≤ 0.05, **p ≤ 0.01, ***p ≤ 0.001 versus SD group; † p ≤ 0.05 versus high‐fat diet (HFD) group.
Plasma resistin levels (Figure 3c) were increased in HFD‐fed mice. Blockage of B1R in diabetic mice reduced resistin level in combination or not with TZD (p < 0.05 vs. HFD). However, the single treatment with TZD failed to affect high resistin level in HFD‐fed mice.
Gene and protein expression in the adipose tissue
To determine if the metabolic alterations in HFD‐fed mice were related to the adipose tissue activity, the mRNA level of the key regulator of the adipose tissue physiology, PPARγ2, was evaluated by quantitative PCR in the adipose tissue (Figure 4a). A significant decrease (p < 0.001 vs. SD) in PPARγ2 mRNA was detected in HFD‐fed mice (Figure 4a), and TZD treatment restored it to values higher than normal levels. This beneficial effect of TZD persisted in combination with SSR treatment. In contrast, PPARγ2 expression remained unchanged in SSR treated group. Likewise, the mRNA level of aP2 that was significantly depressed in HFD‐fed mice was significantly enhanced with TZD treatments combined or not with SSR (Figure 4b) with no change in the SSR‐treated group.
Figure 4.
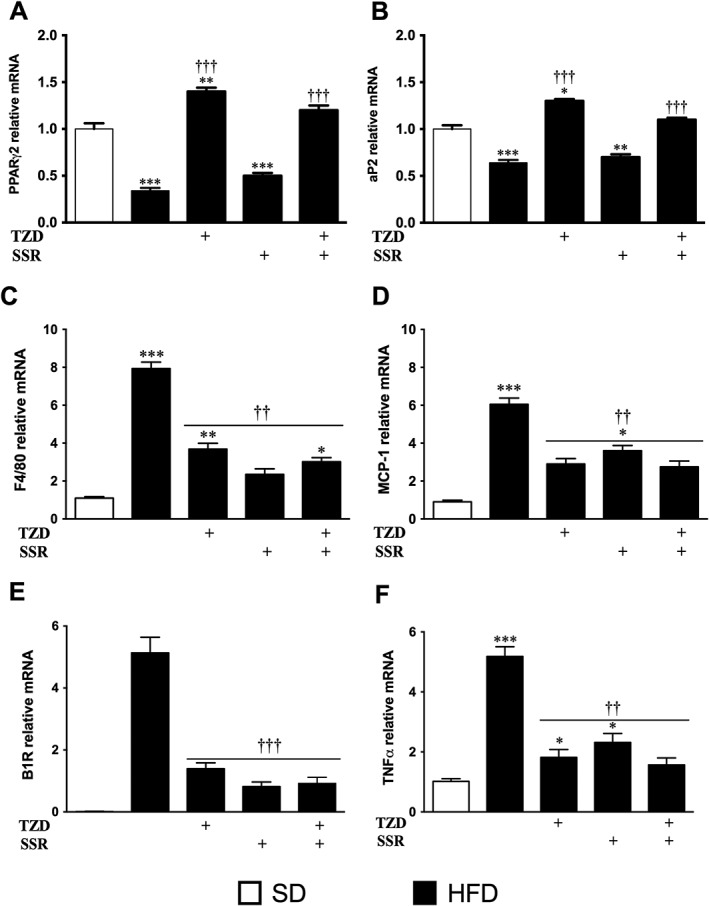
Effect of treatments on gene expression in epididymal adipose tissue assessed by quantitative polymerase chain reaction (PCR) for the indicated genes. Data were normalized to Cyclo‐A mRNA level and presented as a value relative to that for SD‐fed mice. Results expressed as means ± SEM. *p ≤ 0.05, **p ≤ 0.01, ***p ≤ 0.001 versus SD group; †† p ≤ 0.01; ††† p ≤ 0.001 versus HFD group.
At the protein level, PPARγ expression was increased in the adipose tissue of the diabetic mice (Figure 5a). Although the increased PPARγ protein expression was no longer significant under TZD treatment, the treatments with SSR alone or with TZD had no significant impact on this protein. In contrast, aP2 protein level was not altered in HFD‐fed mice but decreased (p ≤ 0.01) by the single treatment with TZD or SSR (Figure 5b).
Figure 5.

Effect of pioglitazone (TZD) and SSR240612 (SSR) in high‐fat diet (HFD)‐fed mice on proliferator‐activated receptor gamma (PPARγ) (a), adipocytes' protein 2 (aP2) (b), CD40 (c) and CD154 (d) protein levels in retroperitoneal adipose tissue. Histograms represent western blot and quantitative analysis shown as means ± SEM of four mice per group. *p ≤ 0.05, **p ≤ 0.01 versus SD group; † p ≤ 0.05 versus HFD group.
Finally, the inflammatory status of the adipose tissue in HFD‐fed mice was detected by increased mRNA expression level of F4/80, a macrophage marker, chemokine ligand 2 (CCL2), involved in the monocyte recruitment in the adipose tissue, B1R and TNF (Figure 4c–f). Overall, inflammatory markers were increased in adipose tissue of HFD‐fed mice reflecting an amplified infiltration rate of monocytes and macrophages in the adipose tissue. The four inflammatory markers were significantly decreased by TZD and/or SSR treatments.
CD40 is a TNF family member highly involved in preadipocyte differentiation. Its protein expression was significantly increased in the adipose tissue of the SSR‐treated mice, in combination or not with TZD, compared with control and diabetic mice (Figure 5c). The upregulation of CD40 is correlated to aP2 and PPARγ modulation and most probably related to overt adipose tissue remodeling seen in histology. In the adipose tissue of the TZD‐treated mice, CD40 was also increased but did not reach significance compared with control or diabetic mice (Figure 5c). Interestingly, CD154, a T lymphocyte marker, was increased in TZD and/or SSR treated mice (Figure 5d). CD154 upregulation in the adipose tissue is likely related to the increase of T cell infiltration but could not be perfectly associated with decreased inflammatory status of the corresponding adipose tissue.
Discussion
This study used a well‐established protocol by using a low cholesterol HFD‐fed C57BL/6J mouse model known to develop metabolic abnormalities including overweight, hyperglycaemia, hyperinsulinaemia, insulin resistance and adipokine secretion disturbances. The originality of this model was the low‐cholesterol content of the diet, to prevent its harmful effect, to basically focus on the metabolic disorders caused by the carbohydrate/fat intake. TZDs showed high level of secondary effects leading to its retraction from the market in many countries. Thus, this study aims at using SSR, as a combinatory treatment, in order to reverse or limit TZD mischief in T2D behaviour.
As a result, SSR and TZD combinatory treatment had an additive effect on several metabolic disorders in HFD‐fed mice towards an overall normal status. Yet, SSR was more effective alone than TZD to reduce visceral fat mass. An effect is absent in the combinatory treatment because TZD is actively involved in adipogenesis and increased adipose mass 26, 27.
High‐fat diet induced, over a period of 20 weeks, a drastic weight gain in mice accompanied by physiologic adaptations that errand adipose tissue morphologic modulation characterized by an increased adipocyte size in the abdominal adipose tissue. Treatment with SSR significantly reduced weight gain and the retroperitoneal adipose tissue mass. TZD treatment did not affect body weight compared with diabetic mice but decreased the size of adipocytes. Indeed, TZD is an antidiabetic molecule known to not only increase body weight gain 27 but also stimulate PPARγ involved in adipogenesis and adipocyte differentiation 26. Thus, stimulation of adipogenesis, reflected by the increase of aP2 mRNA level, allows the recruitment of new cells in the adipose tissue and the clearance of the lipid stored in old cells into the newly differentiated cells leading to the reduction of adipocyte hypertrophy 17. Furthermore, increasing PPARγ activity inhibits NF‐κB activity, a nuclear factor involved in the inhibition of adipogenesis and the upregulation of B1R 8, 11. SSR treatment was more efficient to decrease adipocyte size in the adipose tissue of HFD‐fed mice. Similarly to SSR‐treated diabetic rat models 16, 28 and B1R knockout HFD‐fed mouse model 29, the reduction of fat mass seems to be driven by a mechanism independent of circulating leptin as the treatments failed to affect hyperleptinaemia in HFD‐fed mice.
High‐fat diet‐fed mice showed overt T2D characterized by increased fasting plasma glucose, glucose intolerance and insulin resistance. TZD/SSR combined treatment significantly reduced glucose intolerance and improved insulin sensitivity. This latter is attributed to mechanisms that involve insulin action rather than insulin secretion that was decreased in corresponding treated groups. In fact, insulin resistance in diabetic mice impairs glucose uptake in peripheral tissues. Thus, maintained hyperglycaemia causes hyperinsulinaemia by persistent stimulation of pancreatic beta cells. By improving glucose tolerance, TZD reduced systemic glycaemia. Therefore, the body needs less insulin to clear glucose from the blood. For its part, SSR treatment lowered insulin secretion and HOMA‐IR but failed to improve the IPIST. Kinin B1R antagonism exerts antidiabetic action by preventing oxidative stress and inflammation 11, 14, two factors actively involved in insulin resistance developement 30, and by increasing Langerhans islet survival 12. However, SSR failed to improve glucose tolerance leading to an absence of effect in T2D as previously documented in ZDF rats 28. Nevertheless, TZD/SSR administered conjointly appears to be the best treatment used to improve insulin sensitivity, glucose tolerance and HOMA‐IR. All these events led to an overall systemic improvement of the glucose homeostasis and diabetes.
Further to the decrease adipocyte size, TZD improved adipose tissue PPARγ2 and aP2 mRNA expression level showing a stimulation of the adipogenesis process and the solicitation of new adipose tissue stem cells in order to generate new adipocytes and increase fat storage capacity. This process is a main physiological remodelling of the adipose tissue responsible of the glycaemic and lipidic homeostasis improvement 31. At the protein level, PPARγ was not changed in treated and untreated diabetic mice. Because specific PPARγ2 antibody is not available commercially, the PPARγ1 subtype expression, present also in other cell types composing the adipose tissue, quenches this result. However, PPARγ2 has been expected to be modulated in treated diabetic mice, especially that aP2 levels, the main marker of adipocytes' differentiation, are modified matching with the improvement of adipose tissue activity. Although this modulation was not correlated with its mRNA variation as seen in several paradigms 32, 33, 34, 35, 36, 37, it can be speculated that because adipocyte differentiation is boosted by treatments, mRNA transcription does not follow the rhythm of protein utilization needed in the differentiation process, an overall mechanism that will lead to decreased protein accumulation. And the additive action of the double treatment improves it. This hypothesis will need to be confirmed by the evaluation of the protein turnover and mRNA transcriptional rate.
Adipose tissue inflammation also has a major effect on glucose homeostasis 38. An increased immune cell infiltration in the adipose tissue inhibits adipogenesis process and lowers glucose tolerance and insulin sensitivity 38. In this study, diabetic mice showed an increased level of macrophage molecular marker mRNA, the F4/80. This increased infiltration was correlated to the overexpression by adipose tissue of CCL2, a factor triggering monocyte capture and leading to macrophage formation in the adipose tissue 39, 40. Further, inflammatory marker increase in the adipose tissue of the diabetic mice was concomitant with B1R overexpression known to be correlated with tissue inflammation 12, 15, 41. To evaluate the impact of the three treatments directly on the adipose tissue, additional analyses were performed at the mRNA level. TNF is a key regulator of adipogenesis and metabolic homeostasis 42, 43. In diabetic mice, TNF mRNA level in visceral abdominal adipose tissue was increased potentially in association with macrophage infiltration 43, 44 and increased leptin and resistin circulating levels known to augment TNF production 7, 45, 46. TZD and SSR have contributed to limit TNF upregulation in the adipose tissue. The novelty of this work lies in the fact that the double treatment decreases more significantly the TNF mRNA level in the adipose tissue to comparable level in nondiabetic mice. This decline in TNF mRNA level is correlated to the reduction in the macrophage infiltration in the targeted tissue as shown by the decrease of their marker mRNA level and correlated to the decrease of the circulating levels of resistin.
Altogether, these data showed that TZD, SSR and TZD/SSR treatments suppressed the upregulation of the four inflammatory markers (F4/80, CCL2, B1R and TNF) in the adipose tissue of diabetic mice, suggesting an action of PPARγ against B1R to prevent inflammatory pathways and macrophage accumulation in the adipose tissue. Importantly, SSR treatment reversed the upregulation of the proinflammatory B1R in HFD‐fed mice in the adipose tissue.
Data also showed a significant increase of CD40 protein level in the adipose tissue of SSR treated, in combination or not with TZD, mouse groups. CD40 is a well‐established TNF family member involved in the adipocyte differentiation, and knocking down its gene leads to weight loss and adipose tissue morphologic disturbance 47, 48. CD40 rise is correlated with increased preadipocyte differentiation rate and hyperplasia in corresponding mouse groups. For its part, CD154, a key marker of T cell lymphocyte, was increased in TZD and/or SSR‐treated groups compared with control. This augmentation of the CD154 level is correlated with the rise of CD40 expression level in the adipose tissue known to regulate T cell infiltration 49. A recent study showed that increased level of CD40 in the adipose tissue would lead to increased level of T cell infiltration in the adipose tissue 48, 49. Furthermore, SSR treatment had a stronger effect because it has been shown that antagonizing B1R, expressed in T cells, will increase its migratory potential into tissues 41, 50.
The results of this study further support our hypothesis that inflammation of the adipose tissue constitutes the main factor of the diabetes development, suggesting that the increased B1R expression contributes to adipose tissue inflammation and immune cell infiltration. Higher B1R in diabetic mice supports that obesity is an inflammatory condition leading to diabetes. The strong correlation between improved glycaemic homeostasis with TZD/SSR treatment indicates the potential role of B1R overexpression in the pathogenesis of adipose tissue inflammation‐linked T2D. Thus, insulin sensitizer molecules, like TZD, are not enough alone to treat T2D and must be combined with anti‐inflammatory molecules. Although it is still limited to some inflammatory factors at the mRNA level, this study should be complemented with proteomic profiling aiming at clarifying the complete modulated inflammatory process. Also, further techniques should be developed in order to evaluate the PPARγ2 modulation profile in the adipose tissue of treated diabetic mice in the perspective of determining a lower dose of TZD in diabetes treatment in order to reduce its side effects.
Conclusion
Pharmacological blockade of B1R and activation of PPARγ combined treatment had an additive effect to improve hyperglycaemia, hyperinsulinaemia, insulin resistance and adipose tissue inflammation in HFD‐fed mice. Because TZD therapy showed severe side effects in T2D treatment, B1R antagonists may offer a promising class of drugs in a combinatory treatment of T2D. B1R antagonism is believed to meet the safety criteria, as this inducible receptor is not associated with important physiological functions. Its combination with TZD could offer new potential in the treatment of diabetes by testing PPARγ agonists with lower doses allowing a reduction of their side effects while improving their antidiabetic activity.
Conflicts of interest
The authors have no conflicts of interest to declare.
Supporting information
Data S1. Supporting info item
Acknowledgements
Diabetes Québec and the Canadian Institutes of Health Research (MOP‐119329) to RC supported this work. SEA designed and supervised this work as a continuation of his previous publications. YH received a PhD Studentship Award from the Université de Montréal. The authors are most grateful to Jacques Sénécal for his valuable assistance.
El Akoum, S. , Haddad, Y. , and Couture, R. (2017) Impact of pioglitazone and bradykinin type 1 receptor antagonist on type 2 diabetes in high‐fat diet‐fed C57BL/6J mice. Obesity Science & Practice, 3: 352–362. doi: 10.1002/osp4.117.
References
- 1. Hardy OT, Czech MP, Corvera S. What causes the insulin resistance underlying obesity? Curr Opin Endocrinol Diabetes Obes 2012; 19: 81–87. [DOI] [PMC free article] [PubMed] [Google Scholar]
- 2. Smith MM, Minson CT. Obesity and adipokines: effects on sympathetic overactivity. J Physiol 2012; 590: 1787–1801. [DOI] [PMC free article] [PubMed] [Google Scholar]
- 3. Unger RH, Clark GO, Scherer PE, Orci L. Lipid homeostasis, lipotoxicity and the metabolic syndrome. Biochim Biophys Acta 2010; 1801: 209–214. [DOI] [PubMed] [Google Scholar]
- 4. Yadav A, Kataria MA, Saini V, Yadav A. Role of leptin and adiponectin in insulin resistance. Clin Chim Acta 2013; 417: 80–84. [DOI] [PubMed] [Google Scholar]
- 5. Caselli C. Role of adiponectin system in insulin resistance. Mol Genet Metab 2014; 113: 155–160. [DOI] [PubMed] [Google Scholar]
- 6. Daniele G, Guardado Mendoza R, Winnier D, et al. The inflammatory status score including IL‐6, TNF‐alpha, osteopontin, fractalkine, MCP‐1 and adiponectin underlies whole‐body insulin resistance and hyperglycemia in type 2 diabetes mellitus. Acta Diabetol 2014; 51: 123–131. [DOI] [PubMed] [Google Scholar]
- 7. El Akoum S, Lamontagne V, Cloutier I, Tanguay JF. Nature of fatty acids in high fat diets differentially delineates obesity‐linked metabolic syndrome components in male and female C57BL/6J mice. Diabetol Metab Syndr 2011; 3: 34. [DOI] [PMC free article] [PubMed] [Google Scholar]
- 8. Berg AH, Lin Y, Lisanti MP, Scherer PE. Adipocyte differentiation induces dynamic changes in NF‐kappaB expression and activity. Am J Physiol Endocrinol Metab 2004; 287: E1178–E1188. [DOI] [PubMed] [Google Scholar]
- 9. Desreumaux P, Philippe D. Dual function of NF‐kappa B system during inflammation. Gastroenterologie clinique et biologique 2003; 27: 1052–1053. [PubMed] [Google Scholar]
- 10. Maurer M, Bader M, Bas M, et al. New topics in bradykinin research. Allergy 2011; 66: 1397–1406. [DOI] [PubMed] [Google Scholar]
- 11. Couture R, Blaes N, Girolami JP. Kinin receptors in vascular biology and pathology. Curr Vasc Pharmacol 2014; 12: 223–248. [DOI] [PubMed] [Google Scholar]
- 12. Tidjane N, Gaboury L, Couture R. Cellular localisation of the kinin B1R in the pancreas of streptozotocin‐treated rat and the anti‐diabetic effect of the antagonist SSR240612. Biol Chem 2016; 397: 323–336. [DOI] [PubMed] [Google Scholar]
- 13. Tidjane N, Hachem A, Zaid Y, et al. A primary role for kinin B1 receptor in inflammation, organ damage, and lethal thrombosis in a rat model of septic shock in diabetes. Eur J Inflamm 2015; 13: 40–52. [DOI] [PMC free article] [PubMed] [Google Scholar]
- 14. Dias JP, Talbot S, Senecal J, Carayon P, Couture R. Kinin B1 receptor enhances the oxidative stress in a rat model of insulin resistance: outcome in hypertension, allodynia and metabolic complications. PloS one 2010; 5: e12622. [DOI] [PMC free article] [PubMed] [Google Scholar]
- 15. Couture R, Harrisson M, Vianna RM, Cloutier F. Kinin receptors in pain and inflammation. Eur J Pharmacol 2001; 429: 161–176. [DOI] [PubMed] [Google Scholar]
- 16. Dias JP, Couture R. Blockade of kinin B(1) receptor reverses plasma fatty acids composition changes and body and tissue fat gain in a rat model of insulin resistance. Diabetes Obes Metab 2012; 14: 244–253. [DOI] [PubMed] [Google Scholar]
- 17. de Souza CJ, Eckhardt M, Gagen K, et al. Effects of pioglitazone on adipose tissue remodeling within the setting of obesity and insulin resistance. Diabetes 2001; 50: 1863–1871. [DOI] [PubMed] [Google Scholar]
- 18. Cotillard A, Poitou C, Torcivia A, et al. Adipocyte size threshold matters: link with risk of type 2 diabetes and improved insulin resistance after gastric bypass. J Clin Endocrinol Metab 2014; 99: E1466–E1470. [DOI] [PubMed] [Google Scholar]
- 19. Weyer C, Foley JE, Bogardus C, Tataranni PA, Pratley RE. Enlarged subcutaneous abdominal adipocyte size, but not obesity itself, predicts type II diabetes independent of insulin resistance. Diabetologia 2000; 43: 1498–1506. [DOI] [PubMed] [Google Scholar]
- 20. Kelly AS, Bank AJ. The cardiovascular effects of the thiazolidinediones: a review of the clinical data. J Diabetes Complicat 2007; 21: 326–334. [DOI] [PubMed] [Google Scholar]
- 21. Ye J. Challenges in drug discovery for thiazolidinedione substitute. Yao Xue Xue Bao 2011; 1: 137–142. [DOI] [PMC free article] [PubMed] [Google Scholar]
- 22. Matthews DR, Hosker JP, Rudenski AS, Naylor BA, Treacher DF, Turner RC. Homeostasis model assessment: insulin resistance and beta‐cell function from fasting plasma glucose and insulin concentrations in man. Diabetologia 1985; 28: 412–419. [DOI] [PubMed] [Google Scholar]
- 23. Shinohara K, Shoji T, Emoto M, et al. Insulin resistance as an independent predictor of cardiovascular mortality in patients with end‐stage renal disease. J Am Soc Nephrol 2002; 13: 1894–1900. [DOI] [PubMed] [Google Scholar]
- 24. Sajic T, Hopfgartner G, Szanto I, Varesio E. Comparison of three detergent‐free protein extraction protocols for white adipose tissue. Anal Biochem 2011; 415: 215–217. [DOI] [PubMed] [Google Scholar]
- 25. Bligh EG, Dyer WJ. A rapid method of total lipid extraction and purification. Can J Biochem Physiol 1959; 37: 911–917. [DOI] [PubMed] [Google Scholar]
- 26. Lowell BB. PPARgamma: an essential regulator of adipogenesis and modulator of fat cell function. Cell 1999; 99: 239–242. [DOI] [PubMed] [Google Scholar]
- 27. Hung SH, Yeh CH, Huang HT, et al. Pioglitazone and dexamethasone induce adipogenesis in D1 bone marrow stromal cell line, but not through the peroxisome proliferator‐activated receptor‐gamma pathway. Life Sci 2008; 82: 561–569. [DOI] [PubMed] [Google Scholar]
- 28. Talbot S, Dias JP, El Midaoui A, Couture R. Beneficial effects of kinin B1 receptor antagonism on plasma fatty acid alterations and obesity in Zucker diabetic fatty rats. Can J Physiol Pharmacol 2016; 94: 752–757. [DOI] [PubMed] [Google Scholar]
- 29. Mori MA, Araujo RC, Reis FC, et al. Kinin B1 receptor deficiency leads to leptin hypersensitivity and resistance to obesity. Diabetes 2008; 57: 1491–1500. [DOI] [PubMed] [Google Scholar]
- 30. Ferreira MR, Alvarez SM, Illesca P, Gimenez MS, Lombardo YB. Dietary Salba (Salvia hispanica L.) ameliorates the adipose tissue dysfunction of dyslipemic insulin‐resistant rats through mechanisms involving oxidative stress, inflammatory cytokines and peroxisome proliferator‐activated receptor gamma. Eur J Nutr 2016; 1–12. [DOI] [PubMed] [Google Scholar]
- 31. Houde VP, Brule S, Festuccia WT, et al. Chronic rapamycin treatment causes glucose intolerance and hyperlipidemia by upregulating hepatic gluconeogenesis and impairing lipid deposition in adipose tissue. Diabetes 2010; 59: 1338–1348. [DOI] [PMC free article] [PubMed] [Google Scholar]
- 32. Koussounadis A, Langdon SP, Um IH, Harrison DJ, Smith VA. Relationship between differentially expressed mRNA and mRNA‐protein correlations in a xenograft model system. Sci Rep 2015; 5: 10775. [DOI] [PMC free article] [PubMed] [Google Scholar]
- 33. Pascal LE, True LD, Campbell DS, et al. Correlation of mRNA and protein levels: cell type‐specific gene expression of cluster designation antigens in the prostate. BMC Genomics 2008; 9: 246. [DOI] [PMC free article] [PubMed] [Google Scholar]
- 34. Maier T, Guell M, Serrano L. Correlation of mRNA and protein in complex biological samples. FEBS Lett 2009; 583: 3966–3973. [DOI] [PubMed] [Google Scholar]
- 35. Tian Q, Stepaniants SB, Mao M, et al. Integrated genomic and proteomic analyses of gene expression in Mammalian cells. Mol Cell Proteomics 2004; 3: 960–969. [DOI] [PubMed] [Google Scholar]
- 36. Lundberg E, Fagerberg L, Klevebring D, et al. Defining the transcriptome and proteome in three functionally different human cell lines. Mol Syst Biol 2010; 6: 450. [DOI] [PMC free article] [PubMed] [Google Scholar]
- 37. Vogel C, Abreu Rde S, Ko D, et al. Sequence signatures and mRNA concentration can explain two‐thirds of protein abundance variation in a human cell line. Mol Syst Biol 2010; 6: 400. [DOI] [PMC free article] [PubMed] [Google Scholar]
- 38. Richardson VR, Smith KA, Carter AM. Adipose tissue inflammation: feeding the development of type 2 diabetes mellitus. Immunobiology 2013; 218: 1497–1504. [DOI] [PubMed] [Google Scholar]
- 39. Ahn N, Kim K. Combined influence of dietary restriction and treadmill running on MCP‐1 and the expression of oxidative stress‐related mRNA in the adipose tissue in obese mice. J Exerc Nutrition Biochem 2014; 18: 311–318. [DOI] [PMC free article] [PubMed] [Google Scholar]
- 40. Gogebakan O, Osterhoff MA, Schuler R, et al. GIP increases adipose tissue expression and blood levels of MCP‐1 in humans and links high energy diets to inflammation: a randomised trial. Diabetologia 2015; 58: 1759–1768. [DOI] [PubMed] [Google Scholar]
- 41. Prat A, Weinrib L, Becher B, et al. Bradykinin B1 receptor expression and function on T lymphocytes in active multiple sclerosis. Neurology 1999; 53: 2087–2092. [DOI] [PubMed] [Google Scholar]
- 42. Lang CH, Dobrescu C, Bagby GJ. Tumor necrosis factor impairs insulin action on peripheral glucose disposal and hepatic glucose output. Endocrinology 1992; 130: 43–52. [DOI] [PubMed] [Google Scholar]
- 43. Oliver E, McGillicuddy F, Phillips C, Toomey S, Roche HM. The role of inflammation and macrophage accumulation in the development of obesity‐induced type 2 diabetes mellitus and the possible therapeutic effects of long‐chain n‐3 PUFA. Proc Nutr Soc ; 69: 232–243. [DOI] [PubMed] [Google Scholar]
- 44. Vassiliou EK, Gonzalez A, Garcia C, Tadros JH, Chakraborty G, Toney JH. Oleic acid and peanut oil high in oleic acid reverse the inhibitory effect of insulin production of the inflammatory cytokine TNF‐alpha both in vitro and in vivo systems. Lipids Health Dis 2009; 8: 25. [DOI] [PMC free article] [PubMed] [Google Scholar]
- 45. Rabe K, Lehrke M, Parhofer KG, Broedl UC. Adipokines and insulin resistance. Mol Med 2008; 14: 741–751. [DOI] [PMC free article] [PubMed] [Google Scholar]
- 46. Warne JP. Tumour necrosis factor alpha: a key regulator of adipose tissue mass. J Endocrinol 2003; 177: 351–355. [DOI] [PubMed] [Google Scholar]
- 47. Yi Z, Stunz LL, Bishop GA. CD40‐mediated maintenance of immune homeostasis in the adipose tissue microenvironment. Diabetes 2014; 63: 2751–2760. [DOI] [PMC free article] [PubMed] [Google Scholar]
- 48. Wolf D, Jehle F, Michel NA, et al. Coinhibitory suppression of T cell activation by CD40 protects against obesity and adipose tissue inflammation in mice. Circulation 2014; 129: 2414–2425. [DOI] [PubMed] [Google Scholar]
- 49. Morris DL, Oatmen KE, Mergian TA, et al. CD40 promotes MHC class II expression on adipose tissue macrophages and regulates adipose tissue CD4+ T cells with obesity. J Leukoc Biol 2016; 99: 1107–1119. [DOI] [PMC free article] [PubMed] [Google Scholar]
- 50. Bockmann S, Paegelow I. Kinins and kinin receptors: importance for the activation of leukocytes. J Leukoc Biol 2000; 68: 587–592. [PubMed] [Google Scholar]
Associated Data
This section collects any data citations, data availability statements, or supplementary materials included in this article.
Supplementary Materials
Data S1. Supporting info item