Abstract
Background
For proper treatment of bacterial infections in mink, knowledge of the causative agents and their antimicrobial susceptibility patterns is crucial. The used antimicrobials are in general not registered for mink, i.e. most usage is “off-label”. In this study, we report the patterns of antimicrobial resistance among pathogenic bacteria isolated from Danish mink during the period 2014–2016. The aim of this investigation was to provide data on antimicrobial resistance and consumption, to serve as background knowledge for new veterinary guidelines for prudent and optimal antimicrobial usage in mink.
Results
A total number of 308 Escherichia coli isolates, 41 Pseudomonas aeruginosa, 36 Streptococcus canis, 30 Streptococcus dysgalactiae, 55 Staphylococcus delphini, 9 Staphylococcus aureus, and 20 Staphylococcus schleiferi were included in this study. Among E. coli, resistance was observed more frequently among the hemolytic isolates than among the non-hemolytic ones. The highest frequency of resistance was found to ampicillin, 82.3% and 48.0% of the hemolytic of the non-hemolytic isolates, respectively. The majority of the P. aeruginosa isolates were only sensitive to ciprofloxacin and gentamicin. Among the Staphylococcus spp., the highest occurrence of resistance was found for tetracycline. Regarding the nine S. aureus, one isolate was resistant to cefoxitin indicating it was a methicillin-resistant Staphylococcus aureus. Both β-hemolytic Streptococcus species showed high levels of resistance to tetracycline and erythromycin. The antimicrobial consumption increased significantly during 2007–2012, and fluctuated at a high level during 2012–2016, except for a temporary drop in 2013–2014. The majority of the prescribed antimicrobials were aminopenicillins followed by tetracyclines and macrolides.
Conclusions
The study showed that antimicrobial resistance was common in most pathogenic bacteria from mink, in particular hemolytic E. coli. There is a need of guidelines for prudent use of antimicrobials for mink.
Electronic supplementary material
The online version of this article (doi:10.1186/s13028-017-0328-6) contains supplementary material, which is available to authorized users.
Keywords: Antimicrobial consumption, Antimicrobial resistance, Escherichia coli, Mink, Neovison vison, Pseudomonas aeruginosa, Staphylococcus delphini, Streptococcus canis
Background
The Danish production of mink (Neovison vison) skins was over 17 million annually (2013–2016). In 2016, this corresponded to 30% of the world production of 55.7 million skins [1]. In the Danish mink production, a range of bacterial species are causing a wide variety of infectious diseases. Among the most important ones are Escherichia coli (causing e.g. enteritis, pneumonia, and septicemia), Streptococcus canis and Streptococcus dysgalactiae (e.g. pneumonia, wound infections, and mastitis), various staphylococci such as Staphylococcus delphini, Staphylococcus aureus, and Staphylococcus schleiferi (e.g. wound infections, dermatitis, pleuritis, pneumonia, and mastitis) and Pseudomonas aeruginosa (e.g. hemorrhagic pneumonia) [2]. Antimicrobials are prescribed for treatment of these infections, but the usage of antimicrobial drugs may lead to the selection for resistance [3, 4]. Therefore, it is important to follow the development of resistance over time for the major bacterial pathogens. The consumption of antimicrobials for mink in Denmark increased over several years up to 2012 [5, 6]. Rising public focus on animal welfare may have contributed to the increase in 2011–2012 [6]. On the other hand, rising focus on antimicrobial consumption in the mink production may have contributed to the significant decrease in 2013 and 2014 [5, 6].
At present, only one antimicrobial product containing oxytetracycline is registered specifically for use in mink on the Danish market. Therefore, most antimicrobial use is “off-label” and dosages are extrapolated from other animal species, for which the products are registered, while knowledge on absorption and plasma concentrations in mink are sparse.
Here we present the results of the surveillance of antimicrobial resistance among pathogenic bacteria isolated from mink submitted for diagnostic at the National Veterinary Laboratory in a 3-year period, 2014–2016, and compare the results with previous data. The reported findings of antimicrobial resistance levels are discussed in relation to patterns in antimicrobial prescription for mink.
Methods
Bacterial isolates and culture conditions
Bacterial isolates were obtained from clinical samples from carcasses submitted to the National Veterinary Institute, DTU, during the period 2014–2016. The isolates were considered causative agents in infections that had led to the submission of the animals for laboratory examination. They had been recovered from pathological material by conventional culture methods and identified by matrix-associated laser desorption/ionization—time of flight mass spectrometry (MALDI-TOF MS). Mass spectra were obtained using an Autoflex Speed instrument (Bruker Daltonics, Bremen, Germany) calibrated with the Bruker Escherichia coli Bacterial Test Standard for Mass Spectrometry. Isolates were analysed with the MALDI Biotyper RTC 3.1 software using a BDAL database of library spectra (Bruker Daltonics). Only one isolate was included from each submission. They originated from many farms (n = 284 out of approx. 1400 Danish mink farms) and were assumed to be representative for Danish mink farms.
The E. coli isolates (n = 308) consisted of 158 hemolytic and 150 non-hemolytic isolates. They were derived from samples of liver, lung, mammary gland, feces, intestine, spleen, or uterus. The S. canis (n = 36) and S. dysgalactiae (n = 30) isolates were derived from mammary gland, liver, lung, paw, skin, or thoracic cavity. The staphylococci included in this investigation were primarily of the species S. delphini (n = 55) and a few of S. aureus (n = 9) or S. schleiferi (n = 20). They were derived from lung, liver, urine, skin, uterus, nose, or kidney. Isolates of P. aeruginosa (n = 41) were mainly isolated from the lung, except a few deriving from the spleen, liver, or thoracic cavity; all P. aeruginosa isolates were found in association with outbreaks of hemorrhagic pneumonia.
Antimicrobial susceptibility testing
The minimal inhibitory concentration (MIC) of different antimicrobial agents was determined by the broth dilution susceptibility testing method using a semiautomatic system (SensiTitre, Trek Diagnostic Systems Ltd., UK) according to recommendations by the Clinical Laboratory Standards Institute [7]. The susceptibility test-panels and their test ranges are presented in Tables 1, 2, 3, 4, 5, 6 and 7. In the test result for P. aeruginosa, only apramycin, ciprofloxacin, colistin, gentamicin, spectinomycin, and streptomycin were reported due to intrinsic resistance towards the remaining antimicrobials [8, 9] (Table 3).
Table 1.
MIC distributions and occurrence of resistance of hemolytic Escherichia coli (n = 158) isolates from Danish mink (2014–2016)
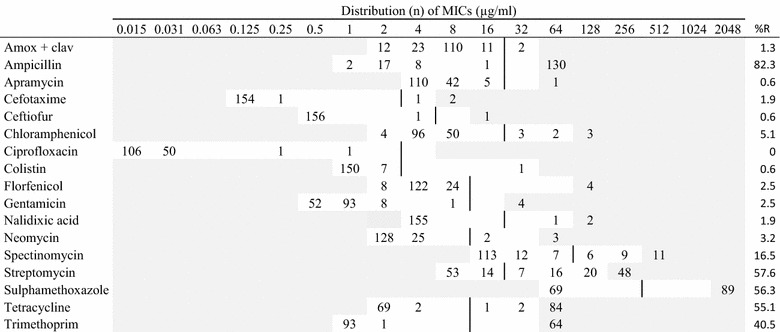
Vertical lines indicate breakpoints for resistance (see breakpoint table in Additional file 1 A). White fields indicate test range for each antimicrobial. Values greater than the test range represent MIC values greater than the highest concentration in the range. MICs equal to or lower than the lowest concentration, are given as the lowest concentration in the test range
R resistance, n number of isolates, amox + clav amoxicillin with clavulanic acid (1:2)
Table 2.
MIC distributions and occurrence of resistance of non-hemolytic Escherichia coli (n = 150) isolates from Danish mink (2014–2016)
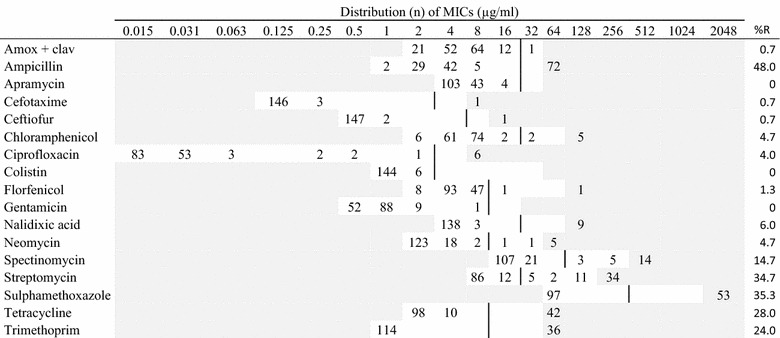
Vertical lines indicate breakpoints for resistance (see breakpoint table in Additional file 1 A). White fields indicate test range for each antimicrobial. Values greater than the test range represent MIC values greater than the highest concentration in the range. MICs equal to or lower than the lowest concentration, are given as the lowest concentration in the test range
R resistance, n number of isolates, amox + clav amoxicillin with clavulanic acid (1:2)
Table 3.
MIC distributions and occurrence of resistance of Pseudomonas aeruginosa (n = 41) isolates from Danish mink (2014–2016)

Vertical lines indicate breakpoints for resistance when available (see breakpoint table in Additional file 1 A). White fields indicate test range for each antimicrobial. Values greater than the test range represent MIC values greater than the highest concentration in the range. MICs equal to or lower than the lowest concentration, are given as the lowest concentration in the test range
R resistance, n number of isolates
Table 4.
MIC distributions and occurrence of resistance of Streptococcus canis (n = 36) isolates from Danish mink (2014–2016)
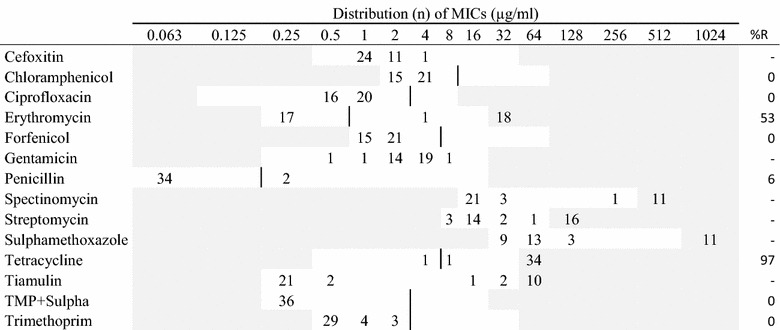
Vertical lines indicate breakpoints for resistance when available (see breakpoint table in Additional file 1 B). White fields indicate test range for each antimicrobial. Values greater than the test range represent MIC values greater than the highest concentration in the range. MICs equal to or lower than the lowest concentration, are given as the lowest concentration in the test range
R resistance, n number of isolates, TMP + Sulpha trimethoprim with sulphamethoxazole (1:19)
Table 5.
MIC distributions and occurrence of resistance of Streptococcus dysgalactiae (n = 30) isolates from Danish mink (2014–2016)
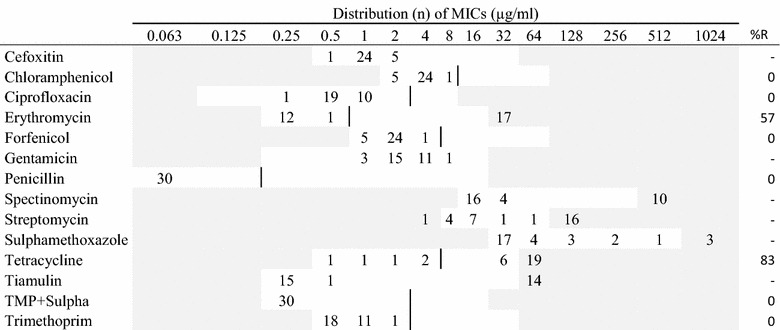
Vertical lines indicate breakpoints for resistance when available (see breakpoint table in Additional file 1 B). White fields indicate test range for each antimicrobial. Values greater than the test range represent MIC values greater than the highest concentration in the range. MICs equal to or lower than the lowest concentration, are given as the lowest concentration in the test range
Table 6.
MIC distributions and occurrence of resistance of Staphylococcus delphini (n = 55) isolates from Danish mink (2014–2016)
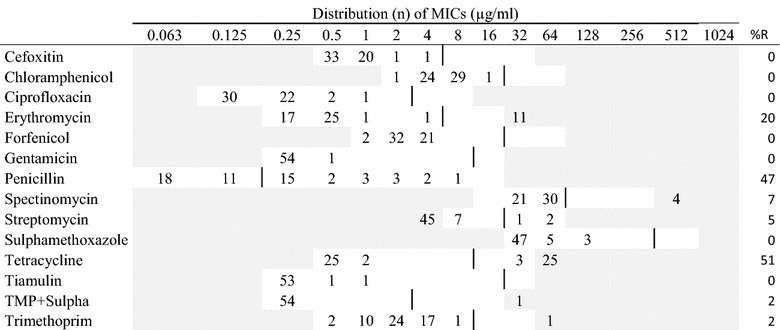
Vertical lines indicate breakpoints for resistance (see breakpoint table in Additional file 1 B). White fields indicate test range for each antimicrobial. Values greater than the test range represent MIC values greater than the highest concentration in the range. MICs equal to or lower than the lowest concentration, are given as the lowest concentration in the test range
R resistance, n number of isolates, TMP + Sulpha trimethoprim with sulphamethoxazole (1:19)
Table 7.
MIC distributions and occurrence of resistance of Staphylococcus schleiferi (n = 20) isolates from Danish mink (2014–2016)
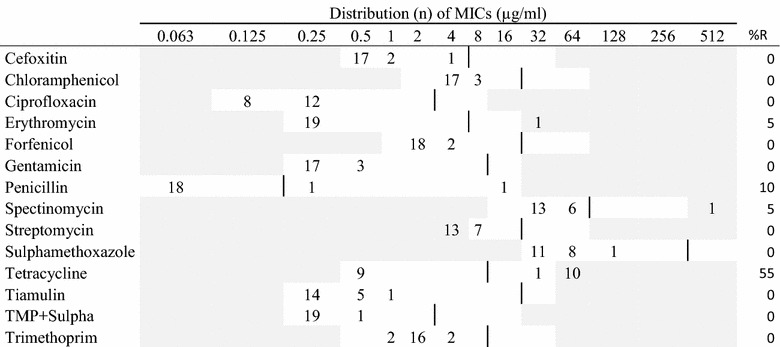
Vertical lines indicate breakpoints for resistance (see breakpoint table in Additional file 1 B). White fields indicate test range for each antimicrobial. Values greater than the test range represent MIC values greater than the highest concentration in the range. MICs equal to or lower than the lowest concentration, are given as the lowest concentration in the test range
MIC values were interpreted using clinical breakpoints when available [see Additional file 1]. Since there are no approved breakpoints for mink pathogens, these interpretations must be regarded cautiously. Test ranges were as stated by Pedersen et al. [10]. Resistance percentages were calculated from isolates with MIC values above the breakpoint for resistance. In this study, the resistance level for each antimicrobial was considered low when <10% of the isolates were above the resistance breakpoint and considered high when resistance levels were >40%. Comparison between resistance levels in hemolytic and non-hemolytic E. coli was performed by using a Fisher’s exact test [11]. Results were considered significant when P < 0.05.
Consumption of antimicrobial agents
Data on antimicrobial consumption in mink from 2007 to 2016 were extracted from the national veterinary prescription database, VetStat [12, 13]. VetStat data are considered to cover more than 99% of the total prescribed amounts of antimicrobials for veterinary use [14]. This study included all records on sales of antimicrobial drug for systemic use when (1) prescribed for mink, and/or (2) prescribed to mink farms with no other animal species recorded on the farm. The temporal developments in antimicrobial consumption were presented as annual kg active compound together with the trend in number of breeding females as a measure of population size.
To enable comparison of individual classes of antimicrobials, the consumption was measured in Defined Animal Doses. To adjust for fluctuations in population size, an estimated treatment proportion (TP) per year was calculated as;
where DADDkg (mg/kg) is the number of defined daily dosage for treatment of one kg biomass, defined on product level as the recommended average daily dose, according to the principles described previously by Jensen et al. [5]; active compound was the annual antimicrobial use summarized on 4th or 5th ATCvet level [15]; the live animal biomass was estimated from number of breeding females registered at Kopenhagen Fur, and data on litter size and growth, as described by Jensen et al. [5]. A TP of 10 DADD/1000 biomass × days corresponds to 1% of the population biomass being treated on an average day.
Results
Resistance occurrence
In the hemolytic E. coli isolates, the highest occurrence of resistance was recorded for ampicillin (82.3%). Additionally, high resistance levels were found for streptomycin, sulphonamides, tetracyclines, and trimethoprim (>40%) (Table 1). For these compounds as well as spectinomycin, resistant isolates were recorded from any sampling site. For other tested antimicrobials, resistance levels were low.
Among the hemolytic E. coli, 45 different phenotypic resistance profiles were recorded. Only 19 of 158 isolates were sensitive to all 17 tested antimicrobials. Multiresistance, i.e. being resistant to three or more compounds, was recorded in 60% of all the isolates. The most common phenotypes were resistant to ampicillin-streptomycin-sulphonamide-tetracycline/trimethoprim (see Additional file 2). Mono-resistance was recorded in 10% of the isolates. Resistance for up to 10 compounds was recorded.
Resistance among the non-hemolytic E. coli isolates was also highest for ampicillin (48%), followed by streptomycin, sulphonamide, and trimethoprim (>25%) (Table 2). For these antimicrobials and tetracycline, resistant isolates were observed for all kind of samples. For other tested antimicrobials, resistance was at low levels.
The hemolytic and non-hemolytic E. coli isolates showed similar resistance patterns, e.g. both showed the highest level of resistance to ampicillin. However, higher levels of resistance were in general observed among the hemolytic isolates than among the non-hemolytic isolates (Tables 1, 2). The differences were statistically significant for ciprofloxacin (P < 0.03) and highly significant (P < 0.001) for ampicillin, streptomycin, sulphonamide, tetracycline and trimethoprim. Only for ciprofloxacin the resistance levels were higher in the non-hemolytic isolates (4%) than in the hemolytic isolates (1%) (Tables 1, 2).
All the 41 P. aeruginosa isolates were sensitive to ciprofloxacin and gentamicin. Colistin resistance was found in 17% of the isolates. All isolates were susceptible to apramycin in a concentration below 16 µg/mL (Table 3).
The two species of beta-hemolytic streptococci tested in this study, presented similar resistance patterns (Tables 4, 5). The majority of the 36 S. canis isolates and the 30 S. dysgalactiae isolates were resistant to tetracycline (97% and 83%, respectively). Additionally, high levels of resistance to erythromycin were found in both streptococci species with more than 40% of the isolates (Tables 4, 5). As all the isolates of S. dysgalactiae were sensitive to penicillin, and two of the S. canis isolates were resistant.
The two staphylococcus species tested in this study, presented similar resistance patterns except for penicillin (Tables 6, 7). Among the 55 S. delphini isolates the highest occurrence of resistance were found for tetracycline (51%), penicillin (47%) and erythromycin (20%) (Table 6). Among the 20 S. schleiferi isolates about half of the isolates were resistant to tetracyclines, but only two isolates were resistant penicillin (Table 7).
Only nine S. aureus isolates were available for testing. They were susceptible to the majority of the tested antimicrobials, while five of the isolates were resistant to penicillin and four to tetracyclines. One of the isolates was resistant to cefoxitin, suggesting that this S. aureus isolate was a methicillin-resistant S. aureus (MRSA).
Antimicrobial consumption
The overall antimicrobial consumption in the mink production measured in kg active compound, increased by 130% from 2007 to 2012, followed by a slight temporary decrease, most pronounced in 2014 (Fig. 1). From 2010 there has been an increase in number of breeding females, which may explain for some of the increase in usage (Fig. 1). Taking into account the changes in population size, the antimicrobial consumption increased by 109%, from 23 DADD/(1000 biomass × days) in 2007 to 48 DADD/(1000 biomass × days) in 2012 (Fig. 2). In 2014, the antimicrobial consumption decreased to around 30 DADD/(1000 biomass × days), and since increasing towards 40 DADD/(1000 biomass × days) in 2016. The rise during the period 2007–2012 was mainly related to the use of aminopenicillins (mainly amoxicillin), tetracyclines and macrolides, which are by far the most frequently used antimicrobials in the mink production (Fig. 2). Lincomycin in combination with spectinomycin has been commonly used, but it has been decreasing the past years. Cephalosporins and fluoroquinolones comprised less than 0.01% of the antimicrobial consumption in Danish mink during 2007–2012; amphenicols (florfenicol) comprised 0.06% and colistin comprised 0.2% of the consumption.
Fig. 1.
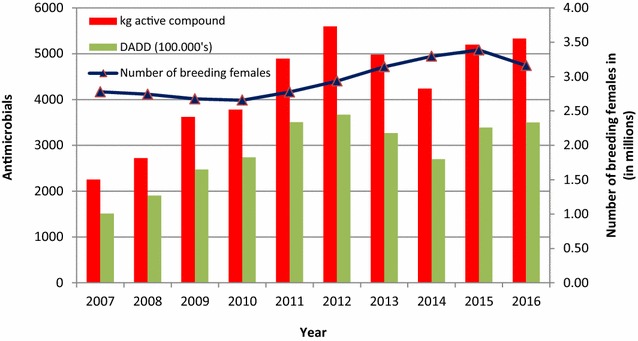
Antimicrobial prescriptions in Danish mink production (2007–2016). The prescription of antimicrobials given in kg active compound and DADD per year, and the curve indicating number of breeding females (in millions). DADD: defined animal daily dose is the assumed average maintenance dose needed to treat one kg animal
Fig. 2.
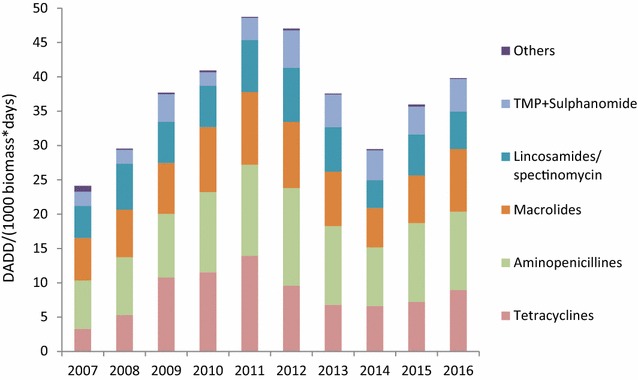
Antimicrobial prescriptions in the Danish mink production (2007–2016) by antimicrobial class. DADD defined animal daily dose is the assumed average maintenance dose needed to treat one kg animal. Others: Pleuromutilins, amphenicols, aminoglycosides, cephalosporins, colistin, fluoroquinolones, penicillin. TMP + sulphonamide: trimethoprim with sulphonamide
The seasonal pattern shows a dramatic peak in antimicrobial consumption in May (Fig. 3a). This is true for all antimicrobial classes, but most pronounced for the most used antimicrobials; aminopenicillins, macrolides, lincosamides with spectinomycin, and tetracyclines (Fig. 3a). The prescription of tetracycline also increases into the autumn (June–October), when the kits are growing and the biomass is significantly higher (Fig. 3b). In contrast, during the period from pelting (November–December) until the whelping season (May), the prescription of antimicrobial was very low (Fig. 3b).
Fig. 3.
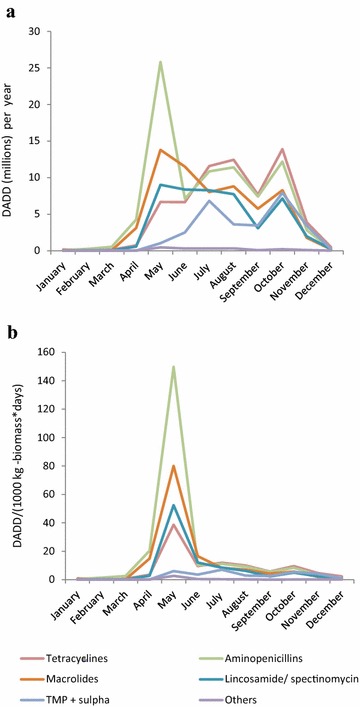
Seasonal patterns in antimicrobial prescriptions by antimicrobial class in the Danish mink production (2007–2016). a The graph is a monthly average from the time period 2007–2016, and illustrates the seasonal pattern in antimicrobial consumption. DADD defined animal daily dose is the assumed average maintenance dose needed to treat one kg animal. b The graph is a monthly average from the time period 2007–2016, and illustrates the seasonal pattern in antimicrobial consumption relative to the size of Danish mink production (monthly average, 2007–2016). DADD/(1000 kg – biomass * day) = number of DADD’s used within a given period per tonnes live biomass multiplied by number of days at risk within the time period (month), the unit describes the prescribed antimicrobials relative to the biomass on the farm, i.e. the decrease during autumn as the kits grow and the biomass increases. Others: Pleuromutilins, amphenicols, aminoglycosides, cephalosporins, colistin, fluoroquinolones, penicillin. TMP + sulpha: trimethoprim with sulphonamide
Discussion
In the present study, by far the highest level of resistance in E. coli was recorded for ampicillin, with 82.3% of the hemolytic and 48.0% of the non-hemolytic isolates. A similar observation was reflected in a previous study on antimicrobial susceptibility in mink pathogens, where the highest occurrence of resistance was found to ampicillin [2]. The same study showed that streptomycin, tetracyclines, sulphonamides, spectinomycin, and trimethoprim were associated with the highest levels of resistance [2]. These antimicrobial classes together with the aminopenicillins are also the most commonly used, but much fewer animals are treated with these drugs compared to aminopenicillins (Fig. 3b).
The resistance profiles of E. coli, with more than 50% of the isolates being resistant to sulphonamide and streptomycin, which are not commonly used in Danish mink, might be related to usage and/or to co-selection [16]. The potential of E. coli to transfer resistance plasmids and thereby spread antimicrobial resistance is well known; several resistance genes have been discovered, some genes give multiple resistances, and numerous resistance genes can be found within one isolate [17]. In this study, a high level of resistance to streptomycin was recorded, and as streptomycin is not used in mink, co-selection is the most likely cause [16, 17].
For both the hemolytic (1.9%) and non-hemolytic (0.7%) E. coli, a low number of cefotaxime resistant isolates were found. This resistance might indicate extended spectrum beta-lactamases (ESBL) status, but it was not investigated further in this study.
When comparing the hemolytic and non-hemolytic E. coli, resistance for most compounds was higher among the hemolytic isolates than among the non-hemolytic ones. A similar observation was made in a previous study, comparing hemolytic and non-hemolytic E. coli in Danish mink [18]. The reason for this is not known, and there is currently no evidence to suggest that these strains are more virulent to mink or more likely to be exposed to antimicrobials and subsequently develop resistance. However, this needs to be further investigated. In pigs, the hemolytic E. coli O149 is the most important pathogen in weaning diarrhea, and hemolysis is thought to be involved in the pathogenesis, although other toxins than hemolysin are known to be important [19].
In mink, P. aeruginosa is causative of hemorrhagic pneumonia, and this bacterium is well recognized because of its intrinsic resistance to most antimicrobials [8, 9]. High susceptibility was found to ciprofloxacin, colistin, and gentamicin. The few colistin-resistant strains found in this study might belong to the Gaussian distribution of the susceptible wild types (Table 3). In a previous study, all P. aeruginosa isolates were found susceptible to gentamicin and colistin [2].
In this study, both group G (S. canis) and group C (S. dysgalactiae) streptococci were investigated. In the two streptococcus species, high resistance levels to tetracycline were found; S. canis: 97% and S. dysgalactiae: 83%. High levels of resistance to tetracycline were also found in a previous study [2]. Resistance to macrolides, represented by erythromycin was high in data from 2008 [2] and this pattern was also found in the present study with more than 50% of the isolates being resistant in both species (Tables 4, 5). Whether the high levels of resistance to macrolides and tetracycline reflects the similarly high consumption of these compounds (Fig. 2) is uncertain. The tiamulin and spectinomycin MIC distributions showed a distinct division into two groups in both species. This might indicate the grouping of susceptible wild type and a resistant population (Tables 4, 5). Penicillin resistance was low in the streptococci despite high consumption of aminopenicillins; this is a pattern known also from other species, e.g. humans and cattle [20]. In this study, two S. canis isolates had a MIC value of 0.25 µg/mL to penicillin while the other isolates had MIC values ≤0.063 µg/mL. This needs to be further investigated.
The taxonomy of staphylococci has changed so that isolates from mink that were previously identified as S. intermedius are now considered to belong to the species S. delphini. Thus, the isolates reported by Pedersen et al. [2] as S. intermedius were likely all S. delphini. Among S. delphini, far the highest level of resistance was found to tetracycline (51%). A similar pattern was observed in 2008 [2], as high levels of resistant isolates were found to tetracycline, penicillin and erythromycin.
One of the S. aureus isolates was resistant to cefoxitin. This observation subsequently prompted an investigation of occurrence of MRSA in mink, and it has become evident that MRSA is widespread on Danish mink farms. The majority of the isolates are livestock-associated MRSA CC398, and belonging to spa-types t034 and t011, which are also most prevalent in pigs [21].
In general, the occurrence of resistance towards cephalosporins and fluoroquinolones is very low in bacterial isolates from Danish mink, most likely due to the very low consumption of the compounds both in Danish mink and other production animals in Denmark (Fig. 2) [20].
There was a marked increase in antimicrobial prescription in May (Fig. 3a). The reason is probably that that mink kits are born around early May, and the antimicrobials are mainly for treatment of pre–weaning mink diarrhea. In the peri-weaning period May–July, the prescription of aminopenicillins was 27% higher than macrolides and 75% higher compared to the use of tetracyclines. In contrast, tetracyclines were used 10% more than aminopenicillins and 65% more than macrolides in autumn. Thus aminopenicillins are in general used to treat pre- and post-weaning animals in the spring, whereas tetracyclines are used mainly in the almost full-grown animals in the autumn. Consequently, more animals can be treated with the given amount of aminopenicillins in the spring, than the tetracycline in the autumn. This explains the difference between Fig. 3a, b.
Conclusions
For E. coli, high levels of resistance were recorded, especially among hemolytic isolates, to the most used compounds ampicillin and tetracyclines. High resistance levels to streptomycin and sulphonamides were recorded, probably due to co-resistance. The most commonly used antimicrobials are also reflected in the resistance patterns of Gram positive bacteria. The antimicrobial consumption data displays an overall decrease from 2011 to 2014, and then a gradual increase in 2015 and 2016.
There is a need for guidelines regarding treatment and susceptibility of relevant pathogens in Danish mink for veterinarians and farmers to optimize (and minimize) the use of antimicrobial compounds.
Additional files
Additional file 2. Resistance profiles recorded in the isolates of hemolytic Escherichia coli (n = 158) from Danish mink (2014–2016).
Authors’ contributions
NKN and DCKL collected resistance data and drafted the manuscript. MC recovered resistance data from LIMS databases. GL was responsible for collecting bacterial isolates for sensitivity testing. VFJ provided descriptive analyses on antimicrobial usage from VetStat. KP validated resistance data and completed the manuscript. All authors contributed to the manuscript. All authors read and approved the final manuscript.
Acknowledgements
This investigation was supported by grants from the Pelsdyravlerfonden, 2014–2016. The skilled technical assistance from Mrs. Susanne M Ranebro and Pia T Hansen is gratefully acknowledged.
Competing interests
The authors declare that they have no competing interests.
Availability of data
The datasets used and/or analyzed during the current study are available from the corresponding author on reasonable request.
Consent for publication
Not applicable.
Ethics approval
Not applicable.
Funding
This investigation was supported by a grant from The Fur Animal Levy Fund and the Danish Veterinary and Food Administration.
Publisher’s Note
Springer Nature remains neutral with regard to jurisdictional claims in published maps and institutional affiliations.
Footnotes
Electronic supplementary material
The online version of this article (doi:10.1186/s13028-017-0328-6) contains supplementary material, which is available to authorized users.
Contributor Information
Nanett Kvist Nikolaisen, Email: nannik@vet.dtu.dk.
Desireé Corvera Kløve Lassen, Email: desiree.lassen@gmail.com.
Mariann Chriél, Email: march@vet.dtu.dk.
Gitte Larsen, Email: gitl@vet.dtu.dk.
Vibeke Frøkjær Jensen, Email: vfje@vet.dtu.dk.
Karl Pedersen, Email: kape@vet.dtu.dk.
References
- 1.Kopenhagen Fur: Historical data. http://www.kopenhagenfur.com/da/minkavl/historisk-data/verdensproduktion-i-minkskind. Accessed 28 Feb 2017.
- 2.Pedersen K, Hammer AS, Sørensen CM, Heuer OE. Usage of antimicrobials and occurrence of antimicrobial resistance among bacteria from mink. Vet Microbiol. 2008;133:115–122. doi: 10.1016/j.vetmic.2008.06.005. [DOI] [PubMed] [Google Scholar]
- 3.Aarestrup FM, Seyfarth AM, Emborg H-D, Pedersen K, Hendriksen RS, Bager F. Effect of abolishment of the use of antimicrobial agents for growth promotion on occurrence of antimicrobial resistance in fecal enterococci from food animals in Denmark. Antimicrob Agents Chemother. 2001;45:2054. doi: 10.1128/AAC.45.7.2054-2059.2001. [DOI] [PMC free article] [PubMed] [Google Scholar]
- 4.Garcia-Miguera L, Hendriksen RS, Fraile L, Aarestrup FM. Antimicrobial resistance of zoonotic and commensal bacteria in Europe: the missing link between consumption and resistance in veterinary medicine. Vet Microbiol. 2014;170:1–9. doi: 10.1016/j.vetmic.2014.01.013. [DOI] [PubMed] [Google Scholar]
- 5.Jensen VF, Sommer HM, Struve T, Clausen J, Chriél M. Factors associated with usage of antimicrobials in commercial mink (Neovison vison) production in Denmark. Prev Vet Med. 2016 doi: 10.1016/j.prevetmed.2016.01.023. [DOI] [PubMed] [Google Scholar]
- 6.Anononymous. DANMAP 2014—Use of antimicrobial agents and occurrence of antimicrobial resistance in bacteria from food and humans in Denmark. Copenhagen, Denmark. ISSN 1600-2032. 2015.
- 7.Clinical and Laboratory Standards Institute. Performance standards for antimicrobial disk and dilution susceptibility test for bacteria isolated from animals; Approved standard, 4th ed. CLSI document VET01-A4, CLSI, Wayne, Pennsylvania, USA, 2013.
- 8.Clinical Lab Standards Institute—CLSI: Intrinsic Resistance, M100 S27:2017. http://em100.edaptivedocs.info/GetDoc.aspx?doc=CLSI%20M100%20S27:2017&scope=user. Accessed 28 Feb 2017.
- 9.The European Committee on antimicrobial susceptibility testing—EUCAST: expert rules and intrinsic resistance 27 Sep 2016. http://www.eucast.org/expert_rules_and_intrinsic_resistance/ Accessed 28 Feb 2017.
- 10.Pedersen K, Pedersen K, Jensen H, Finster K, Jensen VF, Heuer OE. Occurrence of antimicrobial resistance in bacteria from diagnostic samples from dogs. J Antimicrob Chemother. 2007;60:775–781. doi: 10.1093/jac/dkm269. [DOI] [PubMed] [Google Scholar]
- 11.Social science statistics: statistical test calculators, http://www.socscistatistics.com/tests/Default.aspx. Accessed 2 Mar 2017.
- 12.Stege H, Bager F, Jacobsen E, Thougaard A. VETSTAT-the Danish system for surveillance of the veterinary use of drugs for production animals. Prev Vet Med. 2003;57:105–115. doi: 10.1016/S0167-5877(02)00233-7. [DOI] [PubMed] [Google Scholar]
- 13.Anonymous. VetStat. The Danish Veterinary and Food Administration. http://www.foedevarestyrelsen.dk/Leksikon/Sider/VetStat.aspxx. Accessed Mar 2017.
- 14.Anonymous. DANMAP 2001—use of antimicrobial agents and occurrence of antimicrobial resistance in bacteria from food and humans in Denmark. Copenhagen, Denmark. ISSN 1600-2032. 2002.
- 15.WHO Collaborating Centre for Drug Statistics Methodology. New ATC/DDDs and alterations from the October 2015 meeting. http://www.whocc.no/news/new_atc_ddds_and_alterations_from_the_october_2015_meeting. Accessed 10 Apr 2016.
- 16.Tadesse DA, Zhao S, Tong E, Ayers S, Singh A, Bartholomew MJ, McDermott PF. Antimicrobial drug resistance in Escherichia coli from humans and food animals, United States, 1950–2002. Emerg Infect Dis. 2012;18:741–749. doi: 10.3201/eid1805.111153. [DOI] [PMC free article] [PubMed] [Google Scholar]
- 17.Guerral B, Junker E, Schroeter A, Malorny B, Lehmann S, Helmuth R. Phenotypic and genotypic characterization of antimicrobial resistance in German Escherichia coli isolates from cattle, swine and poultry. J Antimicrob Chemother. 2003;52:489–492. doi: 10.1093/jac/dkg362. [DOI] [PubMed] [Google Scholar]
- 18.Vulfson L, Pedersen K, Chriel M, Frydendahl K, Andersen Holmen T, Madsen M, Dietz HH. Serogroups and antimicrobial susceptibility among Escherichia coli isolated from farmed mink (Mustela vison Schreiber) in Denmark. Vet Microbiol. 2001;79:143–153. doi: 10.1016/S0378-1135(00)00343-6. [DOI] [PubMed] [Google Scholar]
- 19.Fairbrother JM, Gyles CL. Colibacillosis. In: Zimmerman JJ, Karriker LA, Ramirez A, Schwartz KJ, Stevenson GW, editors. Diseases of Swine. 10. Hoboken: Wiley; 2012. pp. 723–747. [Google Scholar]
- 20.Anononymous. DANMAP 2015—use of antimicrobial agents and occurrence of antimicrobial resistance in bacteria from food and humans in Denmark, ISSN 1600-2032. 2016.
- 21.Hansen JE, Larsen AR, Skov RL, Chriél M, Larsen G, Angen Ø, Larsen J, Lassen DCK, Pedersen K. Livestock-associated methicillin-resistant Staphylococcus aureus is widespread in farmed mink (Neovison vison) Vet Microbiol. 2017;207:44–49. doi: 10.1016/j.vetmic.2017.05.027. [DOI] [PubMed] [Google Scholar]
- 22.Clinical Lab Standards Institute (CLSI): Bacterial breakpoint data from M100 S27:2017. http://em100.edaptivedocs.info/GetDoc.aspx?doc=CLSI%20M100%20S27:2017&scope=user. Accessed 28 Feb 2017.
- 23.Clinical Lab Standards Institute (CLSI): Bacterial breakpoint data from VET01S ED3:2015. http://vet01s.edaptivedocs.info/GetDoc.aspx?doc=CLSI%20VET01S%20ED3:2015&scope=user. Accessed 28 Feb 2017.
- 24.European Committee on Antimicrobial Susceptibility Testing, EUCAST: Data from the EUCAST clinical breakpoints—bacteria (v 7.0, 2017-01-01). http://www.eucast.org/clinical_breakpoints/. Accessed 28 Feb 2017.
- 25.European Committee on Antimicrobial Susceptibility Testing, EUCAST: epidemiological cut-off values (ECOFFs), antimicrobial wild type distributions of microorganism. https://mic.eucast.org/Eucast2/SearchController/search.jsp?action=init. Accessed 29 May 2017.
Associated Data
This section collects any data citations, data availability statements, or supplementary materials included in this article.
Supplementary Materials
Additional file 2. Resistance profiles recorded in the isolates of hemolytic Escherichia coli (n = 158) from Danish mink (2014–2016).


