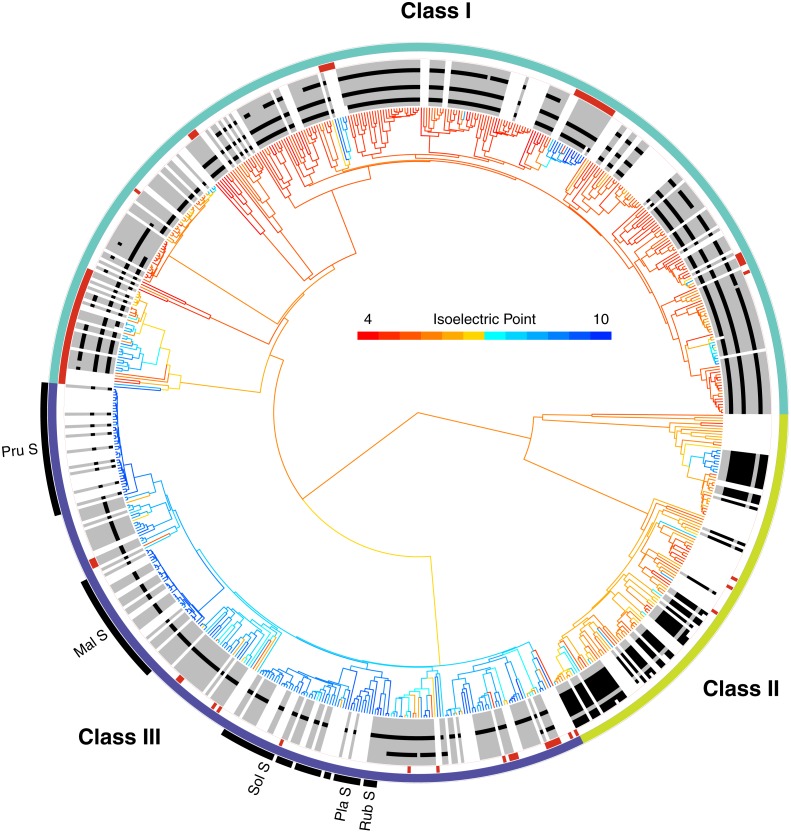
Figure 2. The phylogenetic distribution of intron patterns, isoelectric point (pI) values, and RNase function of the T2/S-RNase family in land plants.
Class designations are labeled (I, II, & III) along with key groups known to function as S-RNases (Pru, Prunus; Mal, Malus; Sol, Solanaceae; Pla, Plantaginaceae; Rub, Rubiaceae). Red notches show sequences known to lack RNase function (or inferred to lack the function based on absence of a histidine essential for that function). The greyscale ring illustrates the pattern of intron presence (black) or absence (grey) at eleven positionally homologous introns found in T2/S-RNases in land plants, clarified in Fig. 3. White areas indicate that the sequence was too short to infer presence–absence, or entirely unavailable (cDNA sequence). The tree branches are colored by the predicted pI value (scale shown) of the amino acid sequence, which was reconstructed for internal branches.

