

Abstract
Background
Titanium carbide (TiC) is used for ceramic metal composites in several industries and is regarded as a nanomaterial for catalyst and battery applications. However, there are very few studies in regard to the toxicological potential of TiC nanoparticles (NPs).
Objective
To study the toxicodynamics and toxicokinetics of TiC NPs in Sprague Dawley rats in acute (24 h) and subacute (28 days) oral administrations. The acute doses were 0.5, 5, 50, 300 and 1000 mg kg−1; the subacute doses were 0.5 and 50 mg kg−1.
Results
Organ histopathological examination (esophagus, stomach, intestines, spleen, liver, and kidneys) indicates the absence of damage at all applied doses, in both assessments. In the acute administration, alkaline phosphatases increased (5, 300 and 1000 mg kg−1), ASAT increased (1000 mg kg−1) and bile salts decreased (0.5 mg kg−1). No alterations in urine parameters (sodium, potassium, osmolarity) were found. Acute administration of TiC caused mineral changes in organs (liver, spleen, kidneys). TiC was mostly cleared by feces excretion 24 h after administration, in subacute administration causing variations in mineral absorption (Mg, Al, P, S, Ca, Zn). TiC could pass the intestinal barrier as TiC traces were detected in urine.
Conclusion
No sign of toxicity was found after oral administration. TiC was excreted mostly in feces producing mineral absorption alterations. Low traces were retrieved in urine, indicating that TiC can cross the intestinal barrier.
Keywords: Titanium carbide nanoparticle, Histopathology, Plasma, Biodistribution, PIXE, Toxicity
1. Introduction
Nanomaterials (NMs) are actively used for a wide variety of applications such as biocompatible materials [1], textile functionalization [2], coatings against UV radiation [3], drug delivery [4], and cell radiation delivery [5]. This unprecedented progress has been associated with concerns about the possible health impacts of NMs. Hence, nanotoxicology has been developed as a specific field of study in light of reports indicating that NMs may generally be more toxic than larger sized particles [6].
Among the NMs already in use, titanium carbide (TiC) is a transition metal carbide with a face centered cubic structure [7]. It presents noteworthy properties such as high hardness (28–35 GPa), low density (4.93 g cm−3), high melting point (3067 °C) and high Young's modulus (300–480 GPa) [8]. Upon such mechanical and thermal properties the industry has adopted TiC for ceramic metal composites applications like tool bits, screws, industrial knives and blades, compaction dies, and wear parts for aerospace and high stress industrial applications [9]. It has been used as catalyst supports for (bio)chemical reactions [10]. Today this compound is also considered because of its capacity to improve battery technology as nanosheets [11], nanowire field emitters [12], and nanorod catalysts produced from cotton cloth [8]. The relevance of TiC for the industry and specially its potential applications as a NM was recognized a decade ago by government agencies, like NREL in USA, which has dedicated budgets for low-cost synthesis of TiC [13]. Unintended exposure of TiC in the nanoscale to workers or individuals can take place when products containing TiC are exposed to wear, breakdown or undergo decommissioning. Within this context it is necessary to ask whether such unintentional exposure can have adverse effects to the health. Information about the potential toxicological effects of TiC NPs is very limited and scarce: N-hTERT keratinocytes exposed to TiC NPs resulted in LDH and IL8 release [14]; single dose intra-tracheal instillation to rat lungs resulted in a two-fold higher biopersistence, half time of 17 days, when compared to silicon carbide [25]; and, exposure to human plasma resulted in very high pro-coagulant activity when compared to carbon black [15]. The gastrointestinal (GI) pathway is a major entry point for NMs which may arrive due to (un)intentional ingestion or from inhaled particles through the respiratory tract mucociliary clearance mechanism [16], [17], [18], and can potentially end up in the bloodstream if the NMs are able to pass the GI tract. This study addresses whether TiC NPs can cause toxicity to rats when exposed via the GI pathway, using acute and subacute oral administration exposures, by studying the induced toxicodynamics and TiC toxicokinetics.
2. Materials and methods
2.1. Nanoparticle dispersions
Titanium carbide NPs were obtained from Io-Li-Tec (Germany) and used without further treatment. No trace of endotoxin was found using the endotoxin Limulus Amebocyte Lysate kit (Lonza, Switzerland). For the physicochemical characterization, a TiC NP dispersion was prepared at 1 mg mL−1 with MilliQ water and stirred at 400 rpm during 30 min, used immediately afterwards. For the acute and subacute administrations, a TiC NP stock dispersion was prepared weekly at 200 mg mL−1 with tap water, stirred during 30 min and stored at 4 °C. Then, daily fresh dilutions were prepared from the stock solution, previous vortexing for re-dispersion, at selected concentrations for in vivo administration. No surfactant was used to disperse the NPs, like Pluronic F108, in order to avoid surface and particle size distribution modifications [14], [19], [20]. It should be noted that throughout this manuscript any mention of TiC implies NPs of TiC, unless otherwise specified.
2.2. Nanoparticle characterization
The particle size distribution of TiC was characterized using a high resolution transmission electron microscope (HRTEM) at an acceleration voltage of 200 kV (Monochromated Tecnai 2001, Philips). A droplet (10 μL) was left to dry on holey carbon film supported on a cooper 200 mesh grid (Quantifoil R1.2/1.3). A Jeol FEG-SEM operated at 20 keV with an EDX (Energy Dispersive X-ray) detector was used to determine the bulk chemical composition of TiC.
Particle size distributions (PSD) in number were measured with a disc centrifuge DC24000 system (CPS instruments Inc., USA). The measurement is based on the centrifugal liquid sedimentation (CLS) method according to Stokes’ law using a 405 nm wavelength laser. This method is also known as Differential Centrifugal Sedimentation (DCS). The diameters measured are hydrodynamic diameters, which for spherical particles provide the real diameter (sphericity factor equal to 1). A certified calibration standard of PVC microparticles (226 nm), was used to calibrate all the measurements. Each measurement was done by injecting 0.1 mL of the TiC NP dispersion into the centrifugal disk (see Section 2.1 for details).
Specific surface area measurements were obtained by the BET method with an Accelerated Surface Area and Porosimetry System (ASAP, Micromeritics 2010).
X-ray diffraction (XRD) measurements were performed with a Siemens D5000 diffractometer equipped with a Cu X-ray source operating at 40 kV and 40 mA and a secondary monochromator allowing selection of the Kα radiation of Cu (λ = 1.5418 Å).
Surface composition was analyzed with an X-ray Photoelectron Spectroscopy (XPS) system. The apparatus used is a SSX-100 system using Al K-α X-rays, with spectra recorded at 35° take-off angle. The analysis depth of XPS is around 5 nm. Core-level lines (C1s, Si2p) were calibrated to the C 1s peak (284.6 eV) and Au 4f7/2 peak (84.0 eV). The spectra were analyzed, fitting the Gaussian function to the experimental curve, with a non-linear least squares scheme, and using a Shirley background. Nominal resolution was measured as full width at half maximum of 1.0 eV (core-level spectrum) or 1.5 eV (survey spectrum). Pristine TiC was deposited as such on a gold slab.
2.3. Oral administration protocol
2.3.1. Animals
Nulliparous and non-pregnant female Sprague-Dawley rats (Charles River, France) were used for acute oral toxicity studies (age: 8 weeks, weight: 190–200 g) and for subacute oral toxicity studies (age: 6 weeks, weight: 150–170 g). Animals were housed in a controlled environment at a temperature of 20–22 °C, humidity of 45–65%, and 12 h light/dark cycle. They had free access to tap water and to commercial laboratory complete food (SAFE: Scientific Animal Food & Engineering, Rats and mice. Product #A03-10, batch 12037, Belgium). Rats were acclimatized to 2 weeks before housing in individual type III cages or in metabolic cages (Techniplast COD.170013, Belgium). A daily monitoring of stress, morbidity and mortality was performed. All animal experiments were done in agreement with the local ethics committee for animals. Each dose was orally administered between 9 and 10 am, feces and urine were collected the next day between 8 and 9 am.
2.3.2. Acute administration
To evaluate the potential acute oral toxicity of TiC, the OECD (Organization for Economic Cooperation and Development) guideline 420 for acute toxicity study of chemicals was used as a reference [21]. The recommended doses in this guideline had to be adapted for NPs due to technical limitations. For example, the highest recommended dose for acute oral toxicity is 2000 mg kg−1, nevertheless, such high concentration of NPs induced agglomerates to sediment in aqueous media due to the NPs physicochemical properties [14], [22]. The maximal dose found to avoid sedimentation was 1000 mg kg−1.
The administration of TiC was performed in a sequential scheme adapted from the predetermined dose method [21] as follows: the lowest single dose of TiC dispersion was administered to the first group of rats. The administration of a higher dose to the next group was done 24 h later. If at least one animal of the group should die or show any sign of external or visual toxicity, the NPs at that concentration are considered as toxic and subsequent higher doses are not administered.
TiC dispersions were prepared at 0.1, 1, 10, 60 and 200 mg mL−1 and were administered at doses of 0.5, 5, 50, 300 and 1000 mg kg−1 respectively, respecting a dose volume of 5 mL kg−1. The dispersions were administered orally with a rigid stainless steel needle. The rats were divided into six groups of five rats per group: a control group which received only tap water whereas the five other groups received the TiC dispersions. Each group (n = 5) was divided into two sub-groups: 2 rats in conventional type III cages and 3 rats individually housed in metabolic cages. The rats were observed at 10 and 30 min, 18 and 24 h after administration. Afterwards, they were sacrificed by intraperitoneal injection of Nembutal (60 mg kg−1), followed by an autopsy.
2.3.3. Subacute administration
To evaluate the potential subacute toxicity of TiC, OECD guideline 407 for chemicals for subacute toxicity of chemicals was used as a reference [23]. TiC dispersions were prepared at concentrations of 0.1 mg mL−1 and 10 mg mL−1 to be administered at 0.5 mg kg−1 and 50 mg kg−1. The dispersions were administered orally using a rigid stainless steel needle. Administration was performed once per day, 5 days per week during 4 consecutive weeks (28 days). These low and mild doses were selected due to their periodic administration, based on the results obtained from the acute toxicity study. The total administered dose at the end of the assessment was 10 mg kg−1 and 1000 mg kg−1.
The rats were divided into three groups of six rats per group: a control group receiving only tap water, a group receiving the low dose (0.5 mg kg−1) and a group receiving the mild dose (50 mg kg−1). Each group (n = 6) was divided into two sub-groups for the individual housing: 3 rats in conventional type III cages and 3 rats in metabolic cages. The rats were observed at 10 and 30 min, 18 and 24 h after administration. Rats were sacrificed at the end of the 28 days by an intraperitoneal injection of Nembutal (60 mg kg−1), followed by an autopsy.
2.4. Toxicity assessment
2.4.1. Morphological and pathological examinations
Organs (esophagus, stomach, small and large intestines, spleen, pancreas, kidneys and liver) were collected for autopsy. All organs were fixed in formalin 10%, embedded in paraffin blocks and cut into slices (6 μm thick). The sections were placed on glass slides, and revealed by a staining technique using hematoxylin and eosin (H&E) and observed under an optical microscope (Olympus Provis AX70, Japan) equipped with a camera (Zeiss AxioCam, Japan). Histopathological examination was conducted in collaboration with the Institute of Pathology and Genetics (IPG, Belgium).
2.4.2. Plasma analysis
Blood samples from the left ventricle of the heart were extracted from all animals per group (n = 5 for acute administration, n = 6 for subacute administration), using a 21-gauge needle and collected in heparin and citrated tubes. Plasma was obtained after centrifugation at 2000 × g for 10 min. Sodium, potassium, glucose, total cholesterol, total protein, alkaline phosphatase (AP), albumin and amylase were analyzed. Parameters reflecting the liver function, ASAT and ALAT, and the renal function, urea and creatinine, were measured at the clinical biology laboratory of CHU (Sart Tilman – Ulg, Belgium) using a HITACHI 917 (Roche, USA). Bile salts were analyzed at the Laboratory of Dr Collard (Belgium) using an Architect C8000 (ABBOTT, Belgium).
2.4.3. Urine analysis
Urinary osmolarity was measured after a twofold dilution in ultrapure water (MilliQ 18.2 MΩ cm) with a micro-osmometer (Fiske Micro-osmometer Model 2010, USA). Sodium and potassium concentrations were measured in urine samples after a twofold dilution in ultrapure water (MilliQ 18.2 MΩ cm) by flame spectroscopy (Instrumentation Laboratory 943, Italy).
2.4.4. Statistical analysis
Data were analyzed with GraphPad Prism software using a non-parametric Mann–Whitney test by comparing control and treated samples.
2.5. Detection of TiC in urine
Urines were collected from each rat, housed on metabolic cages, every day during the experiment. After a filtration procedure the urine filtrates were analyzed with a Jeol FEG-SEM operated at 20 keV with an EDX (Energy Dispersive X-ray) detector. The filtration procedure was the following: a fraction of the urine (2 mL) was deposited on a 650 nm filter inside an ultrafree centrifugal filter (Millipore, USA) and centrifuged at 10,000 × g during 2 min. Then the filtrate was collected and deposited on a 450 nm filter inside an ultrafree centrifugal filter, and submitted to centrifugation at 10,000 × g during 2 min. Finally, the filtrate obtained was deposited on a 100 nm filter inside an ultrafree centrifugal filter, and submitted once more to centrifugation at 10,000 × g during 2 min. The filters of 220 and 450 nm were prepared for FEG-SEM observation. 500 μL of 2.5% glutaraldehyde in 0.1 M cacodylate buffer (composed of Na(CH3)2·AsO2·3H2O in distilled water at pH 7.4) was placed on the filter for 1 h. The glutaraldehyde solution was removed by centrifugation at 10,000 × g during 2 min, then 500 μL of 0.2 M cacodylate buffer was added. Filters were washed with 0.2 M cacodylate buffer. The next step was the dehydration of the sample with successive baths of alcohol from 30 to 100 °C. A critical drying point was performed with a Balzers Critical Point Dryer (CPD) 030 (BAL-TEC Gmbh®, Germany). Afterwards, a thin layer of platinum (11.5 nm) was deposited under argon atmosphere on filters with a metallizer Balzers union (BAL-TEC Gmbh, Germany).
2.6. Detection of TiC and elemental composition analysis on feces and organs
Particle-Induced X-ray Emission (PIXE) was used to quantify the amount of TiC and mineral content on feces and organs. The fundamentals of the technique have been explained elsewhere [24], [25]. It was preferred over other techniques due to several reasons: (1) the sample preparation is simple (see next section) where there is no need to label the particles or to completely dissolve the target material like with atomic absorption spectroscopy (AAS) or inductively coupled plasma atomic emission spectroscopy (ICP-AES); (2) there is not a restriction on the particle size to measure; (3) it is a non-destructive technique; (4) high volume statistics (see PIXE analysis section); and (5) the technique has a ppm-level of sensitivity similar to AAS [26], which is better than energy dispersed X-ray spectroscopy (EDX), a similar technique using electrons instead of ions [25].
2.6.1. Sample preparation
Feces were collected from each rat everyday on both acute and subacute toxicity studies. The dose (or first dose in subacute administration) was applied on day 0. This means that, for example, the concentrations reported for day 1 correspond to the collected feces produced during the prior day. Rat liver, kidneys and spleen were prepared for elemental quantification. Both feces and organs were prepared into pellets for ion beam analysis. The feces were dried in an oven at 60 °C for 24 h. The daily amount of rat feces allowed the preparation of up to 3 pellets per rat, all of them were measured and averaged. Each pellet of feces was prepared with the following procedure: feces were weighed and then chromium nitride (Cr2N) powder (Goodfellow, 99% purity, 45 micron particle size) was added in a ratio of 7–10% of the feces weight. Both feces and Cr2N powder were then subjected to ball milling in order to get a homogeneous powder mixture. This mixture was finally hard pressed into a pellet (diameter: 2 cm, thickness: 1 mm). In the case of organs, they were dried in an oven at 37 °C for 24 h, and then weighed. Organs were dry-frozen with liquid nitrogen [27], powdered by ball milling with 7–10% of Cr2N powder, and then hard pressed to produce pellets (diameter: 2 cm, thickness: 1 mm). The reason for mixing feces or organs with Cr2N is to avoid charge accumulation in the sample during ion beam irradiation, and to use Cr as an internal standard for quantitative measurements [25]. Chromium was selected because it is not present in the biological matter or as an impurity in TiC, and it does not interfere with other elements during the PIXE measurements.
2.6.2. PIXE analysis
Ion beam measurements were performed with the ALTAÏS accelerator of the University of Namur. The incident ion beam was 2.5 MeV protons, and both Particle-Induced X-ray Emission (PIXE) and Rutherford Back-Scattering (RBS) measurements were done simultaneously. The geometry and setup for the measurements have been described previously [25]. Briefly, with respect to the beam direction: the sample was tilted at 45°, a Canberra LEGe (Low Energy Germanium) detector was located at 90° for PIXE measurements, and a Canberra PIPS detector was positioned at 145° for RBS measurements. An aluminum collimator (1 mm aperture, 0.2 mm thick) was used in front of the PIXE detector. The samples were mounted on a rotating device providing a total scan area of 140.5 mm2.
PIXE measurements were validated with two standards from the International Atomic Energy Agency (IAEA 153 and IAEA 155). The results are in agreement with respect to the reported concentrations (better than 5%) [28], [29]. The addition of 7–10 wt.% Cr2N to the samples was chosen as a best compromise between the X-ray yield from the biological material and TiC with respect to the X-ray attenuation caused by a heavy-element inclusion into the matrix (biological matter). Data analysis included this attenuation factor. A 2.5 MeV proton beam has a penetration depth of 62.32–61.95 μm into a biological matrix containing 7–10 wt.% Cr2N, respectively [30]. Therefore, small variations in the amount of Cr2N powder into the biological matrix have less than 5% change in the measured volume per sample. For a biological matrix under similar analysis conditions the limit of detection (LOD) and limit of quantification (LOQ) of Ti is 10 and 33 ppm, respectively [25]. Other minerals have been measured in either feces or organs: magnesium (Mg), aluminum (Al), phosphorous (P), sulfur (S), calcium (Ca), and zinc (Zn). Their respective LOD and LOQ are presented as element (LOD, LOQ) in ppm: Mg (87, 290), Al (84, 280), P (32,107), S (24, 80), Ca (60, 200), Zn (24, 80).
2.6.3. Optimal dose group analysis
The trace elements of the diet ingested by rats were measured by PIXE [31]. From the average diet ingested by rats, 16.9 mg, mineral Ti in the diet accounts for 11.26 mg. For administered doses of 0.5 and 50 mg kg−1, Ti content accounts for 0.091–0.122 mg and 9.1–12.2 mg (average rat weight: 182 g at day 1, 244 g at day 28), respectively. Therefore, of these two groups, only the high dose group (50 mg kg−1) was measured by differentiating it from the ingested Ti in the food.
2.6.4. Statistical analysis
Three samples (n = 3) were measured per condition. Means were calculated as the average of the samples per condition, and error bars represent the propagation of uncertainty. Statistical significance of the biodistribution data was analyzed by the Holm–Sidak method (two-way ANOVA) with the SigmaStat software. Statistical significance analysis was carried out for same day samples (control versus treated animals) and different day samples (control versus treated animals, and treated versus treated animals). Significant results were divided into p < 0.05, p < 0.01, and p < 0.001.
3. Results
3.1. Nanoparticle and dispersion characterization
A HRTEM image of TiC is shown in Fig. 1. Table 1 summarizes the physicochemical characterizations of TiC NPs, which have been previously reported [14], [25]. Briefly, pristine TiC is composed of sphere-like particles of cubic structure with an average diameter of 39.6 ± 8.9. The specific surface area, the surface that can potentially interact with the external media (dispersant media, biomolecules and/or biological systems), was 16 m2 g−1. The bulk of TiC is close to the 1:1 Ti:C ratio expected to be found. The surface of TiC is dominated by a carbon and oxygen rich layer, most likely due to environmental contamination. The analysis of TiC dispersion in water was done by CLS, measuring the primary (individualized) particles (PPs) in 18 nm and the aggregates in 161 nm. The PPs account for 75% of the number of particles, using a cut-off diameter of 90 nm that separates the distributions of PPs and aggregates.
Fig. 1.
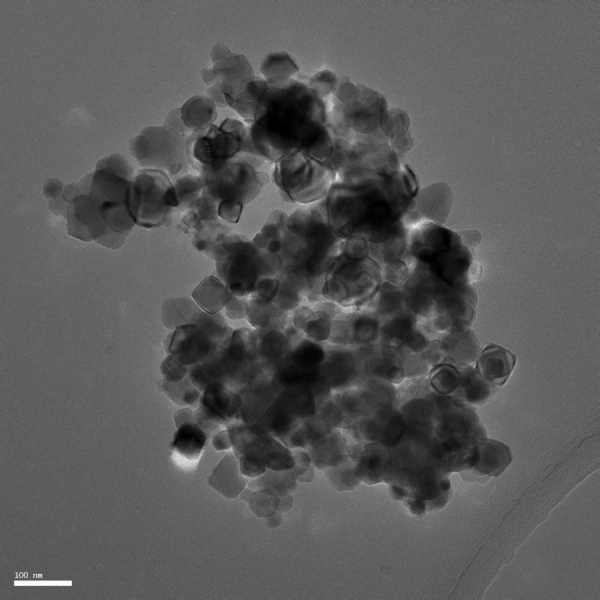
TEM image of pristine TiC. The average diameter is 39.6 ± 8.9 nm. Scale bar: 100 nm.
Table 1.
TiC physicochemical characterization.
| Physical properties | Measured | Suppliera |
|---|---|---|
| Average diameter (TEM) [nm] | 39.6 ± 8.9 | 20 |
| Primary particle diameter (CLS) [nm]c | 18 | – |
| Agglomerates/aggregates diameter (CLS) [nm]c | 161 | – |
| Primary particles (CLS) [%]c,d | 75 | – |
| Agglomerates/aggregates (CLS) [%]c,d | 25 | – |
| Surface area (BET) [m2 g−1] | 16 | 50 |
| Crystallography (XRD) | Cubic | – |
| Chemical composition | Ti | C | O | Ti | C | O |
|---|---|---|---|---|---|---|
| Bulk composition (EDX) [at.%] | 36.9 | 59.5 | 3.6 | 99.0b | ||
| Surface composition (XPS) [at.%] | 8.1 | 64.5 | 27.4 | |||
Iolitec technical data sheet 05/01/2007.
Product purity reported as TiC only.
Hydrodynamic diameters from water dispersion, derived from number-based distribution.
Cut-off size between primary particles and agglomerates/aggregates at 90 nm.
3.2. Acute toxicity
The animals received a single dose of TiC (0.5, 5, 50, 300 or 1000 mg kg−1) dispersed in tap water using a stainless steel needle. All the animals survived the single administration of TiC, regardless of the concentration, and did not show any sign of discomfort (lethargy, nausea, vomiting or diarrhea) during the 24 h following TiC administration.
Twenty-four hours after the administration, all the animals were submitted to a detailed autopsy. From a macroscopic point of view, no change was observed in the analyzed organs (esophagus, stomach, small and large intestines, liver, spleen or kidneys). Similarly, no significant difference was observed in the weight of organs between treated and control animals and these weights were in the physiological range described for rats [32].
Several blood parameters were measured (Table 2): sodium, potassium, glucose, total cholesterol, AP, albumin, parameters reflecting the liver function (ASAT and ALAT), bile salts and parameters reflecting the kidney function such as urea and creatinine. A significant decrease of plasmatic AP was observed for the groups treated with 5, 300 and 1000 mg kg−1 of TiC. ASAT increased for animals treated with 1000 mg kg−1 of TiC, suggesting a potential alteration of liver function. A decrease of bile salts was observed in animals treated with 0.5 mg kg−1 of TiC, compared with control animals. The absence of increase in the urea and creatinine concentrations suggested that the kidney function was likely not affected by TiC administration.
Table 2.
Plasmatic concentration of acute and subacute TiC-treated groups compared with the control group.
| Exposure | Acute |
Subacute |
|||||||
|---|---|---|---|---|---|---|---|---|---|
| Parameters | Control | Group 1 | Group 2 | Group 3 | Group 4 | Group 5 | Control | Group 1 | Group 2 |
| (physiological range)a | Water | 0.5 mg kg−1 | 5 mg kg−1 | 50 mg kg−1 | 300 mg kg−1 | 1000 mg kg−1 | Water | 0.5 mg kg−1 | 50 mg kg−1 |
| Sodium 130–150 (mmol·L−1) |
143.2 ± 0.8 | 142.0 ± 0.7 | 142.6 ± 0.9 | 143.0 ± 1.2 | 141.5 ± 1.01 | 143.8 ± 1.3 | 138.8 ± 1.7 | 139.7 ± 1.4 | 104.7 ± 0.8 |
| Potassium 4.5–6.0 (mmol L−1) |
3.7 ± 0.6 | 3.5 ± 0.3 | 3.1 ± 0.3 | 3.7 ± 0.4 | 3.6 ± 0.5 | 3.6 ± 0.3 | 3.2 ± 0.1 | 3.3 ± 0.3 | 3.2 ± 0.4 |
| Glucose 0.89–1.83 (g L−1) |
1.3 ± 0.2 | 1.2 ± 0.2 | 1.1 ± 0.1 | 1.2 ± 0.2 | 1.3 ± 0.2 | 1.2 ± 0.1 | 1.3 ± 0.2 | 1.4 ± 0.2 | 1.3 ± 0.4 |
| Urea 0.32–0.54 (g L−1) |
0.4 ± 0.04 | 0.4 ± 0.04 | 0.3 ± 0.03 | 0.4 ± 0.1 | 0.4 ± 0.1 | 0.4 ± 0.03 | 0.5 ± 0.1 | 0.5 ± 0.1 | 0.5 ± 0.1 |
| Creatinine 3.9–22.9 (mg L−1) |
2.4 ± 0.2 | 2.2 ± 0.1 | 2.5 ± 0.2 | 2.7 ± 0.3 | 2.9 ± 0.5 | 2.7 ± 0.3 | 2.8 ± 0.3 | 2.7 ± 0.3 | 2.9 ± 0.3 |
| Total proteins 59.0–84.0 (g L−1) |
53.0 ± 2.7 | 53.2 ± 1.1 | 52.4 ± 1.95 | 53.4 ± 2.4 | 52.0 ± 1.4 | 55.2 ± 1.5 | 57.5 ± 2.7 | 58.3 ± 1.9 | 58.8 ± 2.9 |
| Albumin 32.0–43.0 (g L−1) |
37.8 ± 1.5 | 38.2 ± 1.8 | 37.4 ± 1.5 | 38.2 ± 2.2 | 37.5 ± 1.3 | 39.6 ± 1.1 | 40.2 ± 2.4 | 41.2 ± 2.3 | 41.3 ± 3.0 |
| AP 39–216 (UI L−1) |
204.8 ± 23.4 | 182.4 ± 43.3 | 157.4 ± 26.8* | 170.2 ± 34.7 | 115.0 ± 18.01** | 136.2 ± 24.7** | 122.2 ± 26.1 | 130.8 ± 50.2 | 145.7 ± 47.0 |
| ASAT 39–92 (UI L−1) |
76.8 ± 9.4 | 83.8 ± 9.9 | 80.0 ± 8.5 | 76.3 ± 11.6 | 82.0 ± 5.8 | 101.8 ± 6.95* | 105.0 ± 17.8 | 88.8 ± 13.6 | 99.3 ± 15.7 |
| ALAT 17–50 (UI L−1) |
24.0 ± 3.9 | 25.6 ± 5.7 | 24.0 ± 3.5 | 26.0 ± 4.3 | 24.0 ± 2.6 | 35.0 ± 14.4 | 29.0 ± 5.4 | 40.3 ± 14.5 | 36.0 ± 13.1 |
| Amylase NAb (UI·L−1) |
808.0 ± 215.3 | 851.4 ± 212.8 | 844.0 ± 124.5 | 927.2 ± 147.4 | 834.5 ± 206.1 | 934.0 ± 168.5 | 1032.0 ± 179.1 | 1091.0 ± 189.2 | 1174.0 ± 257.1 |
| Total cholesterol 0.5–1.0 (g L−1) |
0.68 ± 0.07 | 0.78 ± 0.10 | 0.84 ± 0.21 | 0.84 ± 0.14 | 0.72 ± 0.22 | 0.85 ± 0.17 | 0.9 ± 0.1 | 0.9 ± 0.2 | 0.9 ± 0.2 |
| Bile salts 0–40 (μM) |
12.4 ± 1.7 | 8.1 ± 1.3* | 12.6 ± 2.4 | 10.2 ± 2.3 | 11.7 ± 2.2 | 13.3 ± 4.6 | 13.2 ± 7.9 | 6.4 ± 2.5 | 6.2 ± 1.9 |
Mean ± SD, n = 5 for acute administration, n = 6 for subacute administration. Statistical studies were performed for each studied biochemical parameter between control group and treated group using a non-parametric Mann–Whitney test (GraphPad Prism 5.0 software). AP: alkaline phosphatases; ASAT: aspartate amino-transferase; ALAT: alanine amino-transferase.
Physiological range (from [32]).
NA: not available. Statistical analysis: non parametric Mann–Whitney test.
Statistical significance between control and treated animals: p < 0.05.
Statistical significance between control and treated animals: p < 0.01.
Histopathological examinations showed that the esophagus, stomach and intestines were not affected by the administration of TiC NPs (data not shown). The epithelium of the GI tract (esophagus, stomach, small and large intestines) did not exhibit irregularities, even at the dose of 1000 mg kg−1. TiC NPs can be observed in the large intestine lumen of the animals regardless of the concentration administered (Fig. 2). Kidneys examination of control and TiC treated groups, see Fig. 3, showed no anomalies between control and treated groups: the medullar and the cortex exhibited a normal aspect, indicating no renal damage. Liver examination showed that its architecture was not affected by TiC administration (Fig. 4). No steatosis, cholestase or hepatocellular insufficiency or other sign of suffering were observed. Spleen examination showed the absence of damage (data not shown).
Fig. 2.

Histopathological examination of large intestine of TiC treated animals after acute administration at concentration of 0.5 (A and C) and 1000 mg kg−1 (B and D). Arrows indicate the presence of TiC agglomerates in intestine lumen. H&E, 400× (A and B) and 1000× (C and D).
Fig. 3.

Histopathological examination of the renal cortex after acute administration from selected animals. (A) Control group, (B) 0.5 and (C) 1000 mg kg−1 TiC treated groups. CR: renal corpuscles. H&E, 400×.
Fig. 4.

Histopathological examination of the liver after acute administration from selected animals. (A) Control group, (B) 0.5 and (C) 1000 mg kg−1 TiC treated groups. H&E, 200×.
3.2.1. Feces analysis: acute administration
Feces from rats subjected to an acute oral administration were analyzed from days 1 to 3 in order to clarify the rate of excreted TiC. The procedure was the same applied to the subacute administration samples. The data revealed that TiC is completely expelled within the day it was administered. Table 3 summarizes the absolute concentrations of the control and treated groups.
Table 3.
Summary of rat feces elemental quantification from PIXE analysis of control and treated groups from the acute administration study.
| Day on study | Weight (g, mean ± SD) | Fecal mass collected (mg) | Elemental analysis (ppm, mean ± SD) |
|---|---|---|---|
| Ti | |||
| Control group | |||
| 1 | 205.67 ± 8.74 | 2479 | 174 ± 11 |
| 2 | 207.67 ± 8.74 | 1680 | 462 ± 14 |
| 3 | 209.67 ± 8.74 | 1916 | 180 ± 13 |
| Treated group | |||
| 1 | 204.67 ± 14.15 | 2904 | 4485 ± 26 |
| 2 | 206.67 ± 14.15 | 2588 | 201 ± 12 |
| 3 | 208.67 ± 14.15 | 2510 | 182 ± 13 |
3.2.2. Organs analysis: acute administration after 24 h and 7 days
Several organs were prepared for element analyses by PIXE: liver, kidneys, and spleen. The rats were given a single dose of TiC by oral administration and were sacrificed one or 7 days later. Fig. 5 summarizes the organs elemental analyses. Data were normalized with respect to their control concentrations. An increase in TiC was found on the spleen at day 7, when compared to the concentration at day 1. The result suggests that TiC may pass through the intestinal barrier. Organs mineral composition are presented in Fig. 5A–C for liver, kidneys, and spleen, respectively. Liver presents a statistical variation in the quantity of Al found on day 1, and the spleen presents a statistical variation in the quantity of Ca between days 1 and 7. Both liver and kidneys follow a qualitative similar behavior: taking as example P and S, both of them present at higher concentrations on day 1 compared to day 7. This is contrary to the concentrations measured for spleen. Table 4 summarizes the absolute concentrations of the control and treated groups.
Fig. 5.

PIXE analysis of element variation in different rat organs at 1 day and 7 days after acute administration of 50 mg kg−1 of TiC. All plots have been normalized with respect to rat weight and control concentrations. (A) Liver, (B) kidneys, (C) spleen. Statistical analysis: two way ANOVA using the Holm–Sidak method. Statistical significance between: control and treated animals (+), treated animals (*), control animals (×). +, *, × indicate p < 0.05; ++, **, ×× indicate p < 0.01; +++,***, ××× indicate p < 0.001.
Table 4.
Summary of rat organ elemental quantification from PIXE analysis of control and treated at 1 day and seven from the acute administration study.
| Organ | Elemental analysis (ppm, mean ± SD) |
|||||||
|---|---|---|---|---|---|---|---|---|
| Mg | Al | P | S | Ca | Ti | Mn | Fe | |
| Control group (24 h) | ||||||||
| Liver | 1981 ± 240 | 792 ± 65 | 12,424 ± 42 | 7714 ± 26 | 132 ± 13 | 85 ± 5 | 292 ± 53 | 551 ± 14 |
| Kidneys | 7833 ± 900 | 1757 ± 241 | 33,851 ± 159 | 23,038 ± 99 | 534 ± 43 | 281 ± 18 | 820 ± 210 | 651 ± 40 |
| Spleen | 3146 ± 867 | 4201 ± 243 | 35,475 ± 152 | 18,295 ± 87 | 318 ± 49 | 304 ± 19 | 1334 ± 233 | 4124 ± 73 |
| Treated group (24 h) | ||||||||
| Liver | 2117 ± 285 | 1416 ± 78 | 15,274 ± 50 | 9732 ± 31 | 121 ± 16 | 79 ± 6 | 376 ± 49 | 750 ± 16 |
| Kidneys | 7954 ± 1068 | 3384 ± 290 | 39,151 ± 182 | 25,883 ± 115 | 564 ± 49 | 224 ± 21 | 742 ± 194 | 724 ± 46 |
| Spleen | 6773 ± 751 | 1891 ± 205 | 32,272 ± 140 | 16,445 ± 79 | 210 ± 46 | 227 ± 16 | 865 ± 179 | 3215 ± 62 |
| Control group (7 days) | ||||||||
| Liver | 2586 ± 232 | 506 ± 62 | 12,728 ± 42 | 7368 ± 25 | 102 ± 13 | 65 ± 5 | 302 ± 47 | 606 ± 13 |
| Kidneys | 9155 ± 974 | 1560 ± 262 | 37,634 ± 177 | 25,559 ± 110 | 534 ± 47 | 251 ± 19 | 1018 ± 206 | 726 ± 43 |
| Spleen | 4633 ± 866 | 2287 ± 240 | 37,847 ± 159 | 19,737 ± 92 | 246 ± 51 | 285 ± 18 | 990 ± 200 | 3604 ± 70 |
| Treated group (7 days) | ||||||||
| Liver | 2640 ± 270 | 778 ± 72 | 13,849 ± 47 | 8711 ± 29 | 100 ± 14 | 64 ± 5 | 270 ± 44 | 676 ± 15 |
| Kidneys | 4802 ± 1035 | 2047 ± 278 | 40,066 ± 185 | 26,985 ± 115 | 583 ± 51 | 185 ± 20 | 670 ± 163 | 736 ± 43 |
| Spleen | 4944 ± 926 | 2805 ± 258 | 40,636 ± 171 | 21,318 ± 99 | 382 ± 55 | 291 ± 20 | 1334 ± 212 | 4400 ± 83 |
3.3. Subacute toxicity
The subacute toxicity study (28 days) was performed with TiC dispersions administered orally at a concentration of 0.5 or 50 mg kg−1 during four weeks, 5 days a week.
The rats were observed after 10 and 30 min, 18 and 24 h after each administration and their behavior was evaluated. Each animal survived the treatment with TiC on both concentrations, and did not show any sign of discomfort (lethargy, nausea, vomiting or diarrhea) during the whole experiment. The animals were weighed every day during the experiment, no abnormal weight variations were observed during this period. At the end of the experiment, the animals weighed between 200 and 240 g which corresponded to the normal weight range of Sprague-Dawley rats of eleven weeks (Sprague-Dawley age/weight curve, Charles River). Food and water consumption were also quantified. No change in both consumptions was observed during the 28 days of experiment, control or treated groups. On average, animals consumed daily 91 g kg−1 of food and 114 mL kg−1 of water. This consumption was within the physiological range for rats [33]. Twenty-eight days after the first administration of TiC, each animal was submitted to a detailed autopsy. No change was observed on the GI tract organs, liver, spleen and kidneys from a macroscopic point of view. There was no significant difference in the organs weight between the control and the TiC treated groups.
Histopathological analyses of different organs (esophagus, stomach, intestines, liver, kidney, and spleen) were performed. The histopathological examination of the GI tract (after acute administration) showed no differences between the control group and the TiC treated groups (data not shown). Similarly, spleen, kidney (renal cortex) or liver (parenchyma) was without anomalies for TiC treated rats (data not shown).
Twenty-eight days after the first TiC administration, blood samples were collected from the intracardiac cavity during necropsy. All the measured plasmatic parameters were in the normal range described for rats in control and treated groups [33], see Table 2.
3.3.1. Feces analysis: subacute administration
Feces from selected days were analyzed by PIXE in order to evaluate their TiC content following subacute oral administration. The TiC content was evaluated from the Ti signal (see Fig. 6A). All the feces of each selected day (control and TiC treated groups) were analyzed. Data from the TiC treated group were normalized with the data from the control group from the same selected day. Additionally, the data were normalized with respect to the average rat weight of the selected day to account for the increase of dosed TiC with an increased weight. During the days of administration (weekdays) Ti content did fluctuate and presented an average concentration ratio of 20.3 ± 7.8; during the days without administration (weekends) the concentration ratio was similar to those of the control group. In addition to Ti, other minerals were quantified such as Mg, Al, P, S, Ca, and Zn (see Fig. 6B–H). Two general trends are observed in the fecal release of these minerals: (1) when rats were administered TiC, their mineral release was lower than control concentrations: ∼50% lower on day 1 and reducing down to ∼25% on day 28; and (2) when rats were not administered with TiC (weekends, here reported days 5, 11 and 12) their release was higher than control concentrations, ∼150–200% on day 5 and reducing to ∼110% on day 11. Table 5 summarizes the absolute concentrations of the control and treated groups.
Fig. 6.

PIXE analyses of rat feces during subacute administration of 50 mg kg−1 day−1 of TiC from selected days. TiC administration was done only during weekdays. All plots have been normalized with respect to rat weight and control concentrations. Variation of: (A) Ti, (B) Mg, (C) Al, (D) P, (E) S, (F) Ca and (H) Zn. Statistical analysis: two way ANOVA using the Holm–Sidak method. Statistical significance between: control and treated animals (+), treated animals (*), control animals (×). +, *, × indicate p < 0.05; ++, **, ×× indicate p < 0.01; +++, ***, ××× indicate p < 0.001. The trend lines are guides to the eye.
Table 5.
Summary of rat feces elemental quantification from PIXE analysis of control and treated groups from the subacute administration study.
| Day on study | Weight (g, mean ± SD) | Fecal mass collected (mg) | Elemental analysis (ppm, mean ± SD) |
||||||||
|---|---|---|---|---|---|---|---|---|---|---|---|
| Ti | Mg | Al | P | S | Ca | Mn | Fe | Zn | |||
| Control group | |||||||||||
| 1 | 158.67 ± 5.03 | 2801 | 184 ± 13 | 94,251 ± 830 | 4006 ± 182 | 77,550 ± 128 | 8069 ± 44 | 58,542 ± 75 | 1555 ± 92 | 1987 ± 34 | 677 ± 23 |
| 5 | 170.67 ± 1.15 | 2905 | 157 ± 9 | 66,964 ± 565 | 2924 ± 123 | 49,715 ± 82 | 5556 ± 29 | 39,400 ± 50 | 1176 ± 71 | 1484 ± 24 | 559 ± 16 |
| 6 | 174.67 ± 2.52 | 2647 | 173 ± 9 | 95,568 ± 838 | 4019 ± 184 | 81,645 ± 130 | 7924 ± 43 | 64,002 ± 80 | 1538 ± 81 | 1874 ± 34 | 662 ± 24 |
| 7 | 178.67 ± 3.51 | 2884 | 208 ± 20 | 111,557 ± 988 | 4620 ± 222 | 97,363 ± 156 | 9298 ± 51 | 74,128 ± 94 | 1578 ± 79 | 2208 ± 39 | 866 ± 27 |
| 8 | 181 ± 2 | 3061 | 171 ± 12 | 80,966 ± 741 | 3012 ± 165 | 67,261 ± 114 | 7259 ± 40 | 50,663 ± 69 | 1360 ± 85 | 1672 ± 31 | 572 ± 21 |
| 9 | 178.33 ± 3.21 | 2160 | 212 ± 16 | 105,602 ± 936 | 4597 ± 207 | 91,109 ± 148 | 9052 ± 49 | 69,640 ± 89 | 1794 ± 100 | 2133 ± 42 | 705 ± 30 |
| 10 | 181.33 ± 8.02 | 2180 | 205 ± 14 | 108,734 ± 834 | 4800 ± 183 | 89,159 ± 131 | 8895 ± 44 | 73,141 ± 83 | 1804 ± 90 | 2312 ± 37 | 839 ± 27 |
| 11 | 184.67 ± 6.81 | 2567 | 173 ± 13 | 97,250 ± 796 | 4540 ± 175 | 81,799 ± 125 | 7722 ± 42 | 64,794 ± 76 | 1470 ± 81 | 2052 ± 34 | 673 ± 25 |
| 12 | 188 ± 6.93 | 2503 | 196 ± 14 | 103,993 ± 863 | 4361 ± 190 | 93,649 ± 139 | 7923 ± 45 | 72,535 ± 85 | 1588 ± 88 | 2005 ± 36 | 762 ± 25 |
| 14 | 194 ± 4.36 | 2282 | 218 ± 15 | 124,836 ± 914 | 5145 ± 193 | 98,909 ± 142 | 8678 ± 47 | 71,931 ± 84 | 1809 ± 91 | 2162 ± 38 | 787 ± 29 |
| 21 | 202 ± 7 | 2198 | 183 ± 16 | 114,232 ± 895 | 4537 ± 194 | 96,644 ± 142 | 8817 ± 47 | 68,276 ± 84 | 1579 ± 90 | 2131 ± 39 | 810 ± 31 |
| 28 | 210.67 ± 2.08 | 1868 | 245 ± 15 | 105,062 ± 889 | 4721 ± 194 | 94,448 ± 144 | 8484 ± 47 | 67,493 ± 85 | 1581 ± 103 | 1944 ± 38 | 700 ± 28 |
| Treated group | |||||||||||
| 1 | 159.67 ± 12.22 | 1367 | 10,253 ± 38 | 88,899 ± 763 | 3772 ± 165 | 70,786 ± 117 | 8407 ± 41 | 59,227 ± 73 | 1327 ± 74 | 1861 ± 31 | 679 ± 21 |
| 5 | 172 ± 8.66 | 2058 | 238 ± 15 | 100,980 ± 866 | 4852 ± 192 | 93,630 ± 139 | 8427 ± 46 | 70,340 ± 84 | 1799 ± 92 | 2101 ± 38 | 772 ± 26 |
| 6 | 174.33 ± 8.38 | 1980 | 4021 ± 29 | 96,798 ± 934 | 5092 ± 213 | 88,677 ± 146 | 9521 ± 50 | 67,331 ± 90 | 1714 ± 91 | 2141 ± 39 | 823 ± 27 |
| 7 | 179 ± 11.27 | 2807 | 4080 ± 29 | 103,006 ± 967 | 4741 ± 221 | 93,058 ± 153 | 11,338 ± 54 | 69,801 ± 92 | 1711 ± 95 | 2307 ± 40 | 846 ± 27 |
| 8 | 187 ± 12.12 | 3709 | 2885 ± 21 | 80,497 ± 703 | 3218 ± 155 | 68,949 ± 110 | 6343 ± 37 | 46,479 ± 63 | 1420 ± 87 | 1553 ± 31 | 540 ± 22 |
| 9 | 189.67 ± 10.79 | 2470 | 3782 ± 25 | 83,898 ± 747 | 3856 ± 164 | 77,419 ± 119 | 6520 ± 39 | 59,015 ± 74 | 1619 ± 94 | 1700 ± 33 | 627 ± 23 |
| 10 | 195.33 ± 8.74 | 3483 | 4330 ± 28 | 106,045 ± 892 | 3875 ± 196 | 82,598 ± 136 | 8378 ± 46 | 60,411 ± 82 | 1415 ± 74 | 1974 ± 35 | 693 ± 24 |
| 11 | 196 ± 10.82 | 2713 | 794 ± 18 | 107,286 ± 894 | 4256 ± 202 | 93,118 ± 141 | 8652 ± 48 | 67,501 ± 84 | 1697 ± 94 | 2147 ± 40 | 766 ± 31 |
| 12 | 197 ± 13.23 | 2251 | 253 ± 14 | 100,294 ± 841 | 4639 ± 185 | 84,467 ± 131 | 7819 ± 44 | 64,113 ± 81 | 1542 ± 82 | 1950 ± 36 | 727 ± 26 |
| 14 | 203.67 ± 16.26 | 2743 | 4082 ± 28 | 102,233 ± 862 | 4212 ± 190 | 83,496 ± 133 | 7534 ± 45 | 59,935 ± 78 | 1619 ± 86 | 1898 ± 38 | 688 ± 29 |
| 21 | 219 ± 21 | 3027 | 7957 ± 40 | 109,912 ± 966 | 4742 ± 218 | 96,900 ± 152 | 9114 ± 52 | 71,921 ± 91 | 1738 ± 91 | 2164 ± 44 | 841 ± 36 |
| 28 | 235.67 ± 25.42 | 2279 | 4783 ± 30 | 98,746 ± 882 | 4508 ± 194 | 90,908 ± 141 | 8524 ± 48 | 65,099 ± 84 | 1495 ± 97 | 1984 ± 39 | 756 ± 29 |
3.3.2. Elimination of TiC by urine excretion
Urine samples were collected each day and quantified. The average daily urine volume collected was 58.5 mL kg−1, which is within the physiological reference range described for rats [33]. No differences were observed in osmolarity, sodium and potassium of urine filtrates in both 0.5 and 50 mg kg−1 TiC subacute treated groups compared to the control group, see Fig. 7.
Fig. 7.

Diuresis (mL) (A), daily osmolarity (B), sodium (C) and potassium (D) excretion during subacute administration. Mean ± SD, n = 3. (●) Shows the data from the control group; (■) shows the data from the 0.5 mg kg−1 TiC treated group and (▴) shows the data from the 50 mg kg−1 TiC treated group.
Urine filtrates were observed by electron microscopy (FEG-SEM) after a filtration and centrifugation process in order to detect the possible presence of TiC. Sample images from the urine of a TiC treated rat is shown in Fig. 8 from the acute and subacute administration, showing granular agglomerations even with the low dose of 0.5 mg kg−1 after acute administration, see Fig. 8A. These granular agglomerations were found only in the urine of treated rats in both acute and subacute administration. An EDX analysis on these agglomerations, see Fig. 8D, exhibits a strong Ti signal, qualitatively confirming that TiC can pass the intestinal barrier.
Fig. 8.

FEG-SEM images of TiC in the urine filtered through a 450 nm mesh. (A) 24 h after 0.5 mg kg−1 acute administration, (B) zoom in of (A and C) 28 days after 50 mg kg−1 subacute administration, (D) EDX from selected area in (C) showing the presence of Ti, see arrows.
4. Discussion
The design idea of this study was that the obtained results can be used, tracked and compared with other NM studies, regardless of their individual significance. There are two common deficiencies to achieve this objective. Firstly, many papers on the toxicity of NMs, especially pre-2006, lack a proper physicochemical characterization of the used products. For example: particle size distribution (i.e. change from pristine to dispersed powders), crystallinity (i.e. anatase or rutile for TiO2), surface area (porosity), and chemical composition (surface and bulk). Such reported parameters could have explained apparent differences of similar experiments using supposedly similar NMs, i.e. SWCNT [34] or TiO2 NPs [35], [36]. Secondly, the use of non-standardized or in-house protocols. These points are subjects of attention, for example there are currently several European projects aiming to address this issue in specific areas, such as QualityNano (http://www.qualitynano.eu/), NanoValid (http://www.nanovalid.eu/), and NanoReg (http://www.nanoreg.eu/). To avoid the aforementioned pitfalls, the present study has extensive physicochemical characterization of the used TiC product and followed standardized animal exposure protocols.
4.1. Physicochemical properties of TiC
When nanomaterials (NMs) enter into a biological medium they are surrounded by proteins and lipids, and an interaction medium-NMs takes place by the formation of a hard corona [37], [38]. Nevertheless, the link between NMs properties, hard corona formation and toxicological response is unclear. Hence, there is a need for extensive physicochemical characterization of NMs. The dispersion conditions selected for TiC minimized the NPs surface alteration, as similarly done in an in vivo silicon carbide (SiC) NPs study [31]. Seventy-five percent of TiC is below 100 nm under the dispersion conditions, therefore the TiC in this study is a nanomaterial product according to the recommendation of the European Commission for the definition of a nanomaterial: >50% particles in number are <100 nm [39]. The pass of TiC through rat gastric fluid is not expected to alter significantly the particle size distribution, as shown in a study that the decrease in TiC primary particles when exposed to reconstituted gastric fluid is 1.3–5% [20].
4.2. Toxicity
Acute and subacute assessments were based from current OECD guidelines [21], [23], where adaptations took place in terms of the used doses due to technical limitations, i.e. high doses resulted into mud-like suspensions. Acute and subacute in vivo oral administration assessments are relevant in light of the potential toxicological-related effects that NMs can exert, such as: NMs capacity to pass across the intestinal barrier [40], possible NMs accumulation and damage exerted to key organs (GI tract, liver, kidneys, spleen) and the cardiovascular system [17], [41], effects in blood serum [42], and the possible alteration to urinary parameters (potassium, sodium, osmolarity) which can be used as alternative biomarkers to track down the effects of NMs in the bloodstream.
Histological analyses showed no signs of morphological alterations, granulomas or tissue damage, in the analyzed sections with respect to the control group. This result applied for both acute and subacute TiC administrations in the GI tract, liver, kidneys and spleen. Given the lack of morphological alterations, immunochemistry assays were not pursued. These negative effects may be correlated to the fact that TiC is mostly eliminated via feces in a short period of time. In contrast TiO2 NPs are more toxic. In vivo studies with TiO2 NPs on male and female CD-1 mice via intragastric administration at similar doses and particle sizes to those used in this study found liver hydropic degeneration and necrosis at a dose of 5 g kg−1 TiO2 and kidney proteinic liquids in renal tubules and glomerulus swelling [43], [44]. Exposure of SiC under similar conditions to those of this study has been reported [31], showing that these NPs induced no morphological alteration when compared to the control group.
Alteration of plasma biochemical parameters reveals modifications in the blood enzymes, which may indicate a series of events, for example systemic leakage from intracellular sites or target tissues due to cellular or tissue injury [58]. In the present study, within the acute administration assessment (0.5, 5, 50, 300 and 1000 mg kg−1) there was a significant decrease in the plasmatic AP in three of the treated groups. Similarly, ASAT increased for the highest administered dose group, and bile salts decreasing for the lowest dose group. For the subacute administration assessment (0.5 and 50 mg kg−1), no biochemical parameter was altered, reflecting that alterations in plasmatic AP or bile salts from low dose acute administration are not relevant for a context of chronic exposure under the studied doses. In comparison, subacute intragastric administration of TiO2 to male and female Wistar rats led to an increase in WBC, LYMs, MONs and EOS blood parameters [44], [45]. Subacute administration of SiC in Sprague Dawley female rats resulted in a statistical decrease of plasmatic urea in the 50 mg kg−1 exposed group [31].
No differences were found in the urinary parameters between the control and TiC exposed groups. In contrast exposed groups to SiC under the same conditions to this study found a marked reduction in the osmolarity of the treated groups with respect to the control group [31].
In summary, from a toxicity point of view, TiC causes markedly less alterations under similar exposure conditions than its metal-oxide (TiO2) and metal-carbide counterparts (SiC). Such differences are based on the different physical and chemical properties of the materials such as the crystallinity and surface area. Titanium dioxide NPs have a toxicity associated with their crystalline structure, anatase and rutile, and their associated chemical reactivity to induce reactive oxygen species (ROS) [46]. In this sense, TiC NPs have a mixed surface composed of TiO2 and C compounds; however, their crystalline structure is that of cubic TiC without any other phases indicating the presence of crystalline TiO2, see Table 1. The specific surface area of SiC NPs used by Lozano et al. [31], was 30 m2 g−1, about two-fold higher than that of 16 m2 g−1, the specific surface area of TiC NPs used in this study. Both their primary particle sizes are similar, 23 versus 18 nm for SiC and TiC, respectively. Therefore, the higher surface area of SiC NPs resulted in the formation of a protein corona that could interact with more proteins and molecules in the surrounding environment (i.e. blood, urine) hence causing more alterations to the urinary and plasma biochemical parameters than TiC counterparts. The results points out that it is within a range from 16 to 30 m2 g−1 where this biological alterations can be detected in rats assuming a lack of chemical reactivity in the NPs, like the case of crystalline TiO2 [47].
4.3. Biodistribution of TiC and elemental composition changes to feces and organs
The concentration of TiC in feces for the acute administration demonstrates that it is expelled within one day after administration, faster than SiC NPs studied under the same conditions [31]. This result is in agreement with the results from subacute administration during the weekend (no administration on those days) where the Ti concentration dropped to control concentration. These control concentration of Ti are, as mentioned Section 3, due to the Ti content found in the rat food. The concentration of TiC measured per day had very little variation, as reflected by the small error bars. The day-to-day fluctuations seem to suggest variability due to the not homogenous suspension in the stock solution, inducing variability in the daily preparation of the suspension.
PIXE measurements offer the advantage of multi-elemental acquisition, and thus all the elements found in the feces were acquired from Mg up to zinc (Zn). A response to TiC administration was observed in rats as a change in the concentration of some elements in the excreted feces with respect to the control group. These changes were observed in the subacute administration for all measured minerals. For all of them the same trend is observed despite the differences in the concentration. This trend as exemplified in Fig. 6B for days 1–14 shows that with respect to the control values, a higher mineral absorption (value lower than 1.0) is directly related to TiC administration, a tendency that reverts (mineral excretion, value higher than 1) when it is not administered. The increase in absorption is 45–50% on day 1, diminishing down to 16–28% on day 28. The second key element is that during the days without administration there is a higher fecal excretion from those elements than control samples, suggesting a lower absorption through the GI tract. The highest absorption reduction took place on the first weekend, here shown day 5, with 49–107%. The reduction in fluctuation amplitude from the first to the second weekend suggests that the administration of TiC influences less with time the absorption of elements from the eaten food. Similarly the absorption increase during exposure days going from 45–50% (day 1) down to 16–28% (day 28) supports this hypothesis. The fluctuations on these elements may have important repercussions. For example, both Ca2+ and PO4−3 ions control the many essential cellular processes [48]. Variations in their supply, although not inducing an immediate short term toxicity effect or perceptible damage on either the GI tract or liver and kidneys, may present long term repercussions such as changes in the mitochondrial function, apoptotic cell death or bone metabolism [48]. Magnesium is involved in the synthesis of DNA, RNA and proteins, and plays a complementary role with Ca as a long-term regulatory element [49]. Reddy et al. found that Ca, P and Mg are reduced in feces excretion for rats without intestinal microflora [50], implying that the rats in this study could have had their microflora altered due to TiC administration. Variations in absorbed Al could be related to alterations to the sites of Al absorption, the small intestine and colon [51]. Iron is required to capture energy from food oxidation and enables oxygen transport to tissue through the hemoglobin in the red blood cells; however, abnormal regulation of Fe uptake leads to disease of the liver and other organs [52]. Excess Zn intake leads to symptoms of anemia and impaired immune function [53]. In all, these variations may cause long-term effects in bone metabolism and cellular signaling, and may produce pathological conditions.
The biodistribution of TiC was studied in rat liver, kidneys and spleen after a single administration and sacrifice either 1 or 7 days later. These organs are important for the translocation of NMs from the intestinal barrier to the bloodstream and their eventual renal filtration. For example the liver is the primary organ involved in the metabolism and detoxification of xenobiotics [54]. In the liver, the Ti concentration in the treated group was like the control samples. For kidneys the Ti concentration was similar on both days, lower than control samples. For the spleen there was a reduction in Ti concentration on day 1. Similarly the organ mineral contents were analyzed. Most of them were either higher or lower than control concentrations. In general, the liver and kidneys followed contrary changes in comparison to the spleen. For example the concentrations of P, S and Zn were higher on day 1 than day 7 in the liver and kidneys but inverse for the spleen. For the liver the concentration of Al was significantly higher on day 1, while for spleen the difference in Ca concentration between days 1 and 7 was statistically significant. In summary, the administration of TiC causes alterations to the absorbed minerals which are reflected also as alterations in the minerals observed at different organs, and such variations in organs can even be traced after a single administration up to 7 days later. In comparison to the same study using SiC NPs, TiC causes lower impact alterations to the mineral content in organs [31].
The studied TiC was found able to cross from the intestinal barrier and reach the blood stream, as observed in traces in urine. Other NMs have been found to cross the intestinal barrier, like SiC NPs [31] and Au NPs [40]. Studies with carbon-based NMs have similarly found a low percentage cross of the intestinal barrier, like carbon nanotubes [55], [56] and 14C functionalized fullerenes which were 98% cleared in feces within 48 h and the other 2% excreted through urine [17], [57].
5. Conclusion
The effects of a TiC oral administration were minimal and do not pose a threat in the short-term. Those effects were: an alteration to the mineral absorption through the GI tract, likely a result of alteration the intestinal microflora, and alterations in the organs mineral content and the plasma AP, ASAT and bile salts. A very small amount of TiC passed through the GI tract and was excreted in urine. Therefore, the results presented in this study indicate that under the studied doses TiC NPs do not induce toxicity to rats via the GI pathway by oral administration. An aerosol exposure study should complete the evaluation of the TiC NPs potential to induce toxicity.
Funding
This work was supported by the Service Public de Wallonie (SPW) – Direction générale opérationnelle – Economie, Emploi et Recherche (DGO6), Département des Programmes de Recherche (Nanotoxico Project, SPW/FUNDP research convention No. 516252). The authors acknowledge financial support from the European Union under the Framework 7 programme through the project QNano INFRASTRUCTURE-2010-1-262163.
Publié avec le concours de la Fondation Universitaire de Belgique (Published with the support of the University Foundation of Belgium).
Conflict of interest statement
The authors report no conflict of interests.
Transparency document
Acknowledgement
O. Toussaint is a senior Research Associate from the F.N.R/F.N.R.S., Belgium.
Footnotes
Available online 12 May 2014
References
- 1.Heublein B., Pethig K., Elsayed A.M. Silicon carbide coating – a semiconducting hybrid design of coronary stents – a feasibility study. J. Invasive Cardiol. 1998;10:255–262. [PubMed] [Google Scholar]
- 2.Avila A.G., Hinestroza J.P. Smart textiles: tough cotton. Nat. Nanotechnol. 2008;3:458–459. doi: 10.1038/nnano.2008.233. [DOI] [PubMed] [Google Scholar]
- 3.Nel A., Xia T., Mädler L., Li N. Toxic potential of materials at the nanolevel. Science. 2006;311:622–627. doi: 10.1126/science.1114397. [DOI] [PubMed] [Google Scholar]
- 4.Wang W., Zhang S., Chinwangso P., Advincula R.C., Lee T.R. Electric potential stability and ionic permeability of SAMs on gold derived from bidentate and tridentate chelating alkanethiols. J. Phys. Chem. C. 2009;113:3717–3725. [Google Scholar]
- 5.Marega R., Karmani L., Flamant L., Nageswaran P.G., Valembois V., Masereel B., Feron O., Borght T.V., Lucas S., Michiels C., Gallez B., Bonifazi D. Antibody-functionalized polymer-coated gold nanoparticles targeting cancer cells: an in vitro and in vivo study. J. Mater. Chem. 2012;22:21305–21312. [Google Scholar]
- 6.Oberdörster G. Pulmonary effects of inhaled ultrafine particles. Int. Arch. Occup. Environ. Health. 2001;74:1–8. doi: 10.1007/s004200000185. [DOI] [PubMed] [Google Scholar]
- 7.Winkler B., Juarez-Arellano E.A., Friedricha A., Bayarjargal L., Yan J., Clark S.M. Reaction of titanium with carbon in a laser heated diamond anvil cell and reevaluation of a proposed pressure induced structural phase transition of TiC. J. Alloys Compd. 2009;478:392–397. [Google Scholar]
- 8.Tao X., Du J., Yang Y., Li Y., Xia Y., Gan Y., Huang H., Zhang W., Li X. TiC nanorods derived from cotton fibers: chloride-assisted VLS growth, structure, and mechanical properties. Cryst. Growth Des. 2011;11:4422–4426. [Google Scholar]
- 9.Ferro-TiC . 2013. Titanium Carbide Applications. Available from the website: http://www.ferro-tic.com/ (accessed 12.12.13) [Google Scholar]
- 10.Popovska N., Streitwieser D.A., Xu C., Gerhard H. Paper derived biomorphic porous titanium carbide and titanium oxide ceramics produced by chemical vapor infiltration and reaction (CVI-R) J. Eur. Ceram. Soc. 2005;25:829–836. [Google Scholar]
- 11.Lukatskaya M.R., Mashtalir O., Ren C.E., Dall’Agnese Y., Rozier P., Taberna P.L., Naguib M., Simon P., Barsoum M.W., Gogotsi Y. Cation intercalation and high volumetric capacitance of two-dimensional titanium carbide. Science. 2013;341:1502–1505. doi: 10.1126/science.1241488. [DOI] [PubMed] [Google Scholar]
- 12.Yuan X., Cheng L., Zhang L. Synthesis of TiC nanowires on porous ZrSiO4 substrate and their field emission properties. Vaccum. 2014;99:294–297. [Google Scholar]
- 13.NREL . 2001. Low Cost Synthesis and Consolidation Of Titanium Carbide. Available from the website: http://www.nrel.gov/docs/fy01osti/28245.pdf (accessed 12.12.13) [Google Scholar]
- 14.Mejia J., Valembois V., Piret J.P., Tichelaar F., van Huis M., Masereel B., Toussaint O., Delhalle J., Mekhalif Z., Lucas S. Are stirring and sonication pre-dispersion methods equivalent for in vitro toxicology evaluation of SiC and TiC? J. Nanopart. Res. 2012;14:815–832. [Google Scholar]
- 15.Laloy J., Robert S., Marbehant C., Mullier F., Mejia J., Piret J.-P., Lucas S., Chatelain B., Dogné J.-M., Toussaint O., Masereel B., Rolin S. Validation of the calibrated thrombin generation test (cTGT) as the reference assay to evaluate the procoagulant activity of nanomaterials. Nanotoxicology. 2012;6:2. doi: 10.3109/17435390.2011.569096. [DOI] [PubMed] [Google Scholar]
- 16.Brown J., Zeman K., Bennett W. Ultrafine particle deposition and clearance in the healthy and obstructed lung. Am. J. Respir. Crit. Care Med. 2002;166:1240–1247. doi: 10.1164/rccm.200205-399OC. [DOI] [PubMed] [Google Scholar]
- 17.Oberdörster G., Maynard A., Donaldson K., Castranova V., Fitzpatrick J., Ausman K., Carter J., Karn B., Kreyling W., Lai D., Olin S., Monteiro-Riviere N., Warheit D., Yang H. Principles for characterizing the potential human health effects from exposure to nanomaterials: elements of a screening strategy. Particle Fibre Toxicol. 2005;2:8. doi: 10.1186/1743-8977-2-8. [DOI] [PMC free article] [PubMed] [Google Scholar]
- 18.Bergin I.L., Witzmann F.A. Nanoparticle toxicity by the gastrointestinal route: evidence and knowledge gaps. Int. J. Biomed. Nanosci. Nanotechnol. 2013;3 doi: 10.1504/IJBNN.2013.054515. 44 pp. [DOI] [PMC free article] [PubMed] [Google Scholar]
- 19.Taurozzi J.S., Hackley V.A., Wiesner M.R. Ultrasonic dispersion of nanoparticles for environmental, health and safety assessment – issues and recommendations. Nanotoxicology. 2011 doi: 10.3109/17435390.2010.528846. [DOI] [PubMed] [Google Scholar]
- 20.Mejia J., Toussaint O., Masereel B., Lucas S. Fate of SiC and TiC nanoparticles dispersions in simulated gastric fluid. Int. J. Nano Biomater. 2012;4:243–255. [Google Scholar]
- 21.OECD . Guideline 407. 2001. Organisation for Economic Co-operation and Development. OECD guideline for testing of chemicals: repeated dose 28-day oral toxicity study in rodents. Available from the website: http://www.oecd.org/dataoecd/50/41/37477972.pdf (accessed 2011) [Google Scholar]
- 22.Bagwe R., Hilliard L., Tan W. Surface modification of silica nanoparticles to reduce aggregation and nonspecific binding. Langmuir. 2006;22:4357–4362. doi: 10.1021/la052797j. [DOI] [PMC free article] [PubMed] [Google Scholar]
- 23.OECD . Guideline 407. 1995. Organisation for Economic Co-operation and Development. OECD guideline for testing of chemicals: repeated dose 28-day oral toxicity study in rodents. Available from the website: http://www.oecd.org/dataoecd/50/41/37477972.pdf (accessed 2011) [Google Scholar]
- 24.Johansson S.A.E., Campbell J.L., Malmqvist K.G. John Wiley and Sons Inc.; New York: 1995. Particle-induced X-Ray Emission Spectrometry (PIXE) [Google Scholar]
- 25.Lozano O., Mejia J., Masereel B., Toussaint O., Lison D., Lucas S. Development of a PIXE analysis method for the determination of the biopersistence of SiC and TiC nanoparticles in rat lungs. Nanotoxicology. 2012;6:263–271. doi: 10.3109/17435390.2011.572301. [DOI] [PubMed] [Google Scholar]
- 26.Deconninck G., Bodart F., Demoulin E. Comparison between PIXE and flame spectroscopy for trace analysis in human albumins. Nucl. Instrum. Methods. 1981;181:259–261. [Google Scholar]
- 27.Galuszka J., Jarczyk L., Rokita E., Strzalkowski A., Sych M. The influence of target preparation and mode of irradiation on PIXE analysis of biological samples. Nucl. Instrum. Methods Phys. Res. B. 1984;3:141–146. [Google Scholar]
- 28.IAEA . 1989. International Atomic Energy Agency. Reference Materials Catalogue and Documents. Available from the website: http://curem.iaea.org/catalogue/TE/TE_001530000.html (accessed 2011) [Google Scholar]
- 29.IAEA . 1990. International Atomic Energy Agency. Reference Materials Catalogue and Documents. Available from the website: http://curem.iaea.org/catalogue/TE/TE_001550000.html (accessed 2011) [Google Scholar]
- 30.Ziegler J. 2003. SRIM 2003. Available from the website: http://www.srim.org/ [accessed 2012]. The biological matrix was assumed as 70 at% C and 30 at% O. Thus the molecule simulated was xCr2N + C2.33O, with x being 0.0261–0.0373 at%, which corresponds to 7–10 wt% addition of Cr2N. The density was estimated by the software. [Google Scholar]
- 31.Lozano O., Laloy J., Alpan L., Mejia J., Rolin S., Toussaint O., Dogné J.-M., Lucas S., Masereel B. Effects of SiC nanoparticles orally administered in a rat model: biodistribution, toxicity and elemental composition changes in feces and organs. Toxicol. Appl. Pharmacol. 2012;264:232–245. doi: 10.1016/j.taap.2012.08.004. [DOI] [PubMed] [Google Scholar]
- 32.Sharp P.E., La Regina M.C. CRC Press; Taylor & Francis Group: 1998. The Laboratory Rat. [Google Scholar]
- 33.Krinke G.J., Bullock G.R., Bunton T. Handbook of Experimental Animals. Academic Press; London: 2000. The laboratory rat. [Google Scholar]
- 34.Geraci C.L., Castranova V. Challenges in assessing nanomaterial toxicology: a personal perspective. Wiley Interdiscip. Rev. Nanomed. Nanobiotechnol. 2010;2:569–577. doi: 10.1002/wnan.108. [DOI] [PubMed] [Google Scholar]
- 35.Takenaka S., Dornhofer-Takenaka H., Muhle H. Alveolar distribution of fly ash and of titanium dioxide after long-term inhalation by Wistar rats. J. Aerosol Sci. 1986;17:361–364. [Google Scholar]
- 36.Churg A., Stevens B., Wright J.L. Comparison of the uptake of fine and ultrafine TiO2 in a tracheal explant system. Am. J. Physiol. 1998;274:L81–L86. doi: 10.1152/ajplung.1998.274.1.L81. [DOI] [PubMed] [Google Scholar]
- 37.Nel A.E., Madler L., Velegol D., Xia T., Hoek E.M., Somasundaran P., Klaessig F., Castranova V., Thompson M. Understanding biophysicochemical interactions at the nano–bio interface. Nat. Mater. 2009;8:543–557. doi: 10.1038/nmat2442. [DOI] [PubMed] [Google Scholar]
- 38.Monopoli M.P., Walczyk D., Campbell A., Elia G., Lynch I., Bombelli F.B., Dawson K.A. Physical–chemical aspects of protein corona: relevance to in vitro and in vivo biological impacts of nanoparticles. J. Am. Chem. Soc. 2011;133:2525–2534. doi: 10.1021/ja107583h. [DOI] [PubMed] [Google Scholar]
- 39.European Commission . 2011. Nanomaterials. Available from the website: http://ec.europa.eu/environment/chemicals/nanotech/index.htm (accessed November 2011) [Google Scholar]
- 40.Hillyer J.F., Albrecht R.M. Gastrointestinal persorption and tissue distribution of differently sized colloidal gold nanoparticles. J. Pharm. Sci. 2001;90:1927–1936. doi: 10.1002/jps.1143. [DOI] [PubMed] [Google Scholar]
- 41.Oberdörster G., Oberdörster E., Oberdörster J. Nanotoxicology: an emerging discipline evolving from studies of ultrafine particles. Environ. Health Perspect. 2005;113:823–839. doi: 10.1289/ehp.7339. [DOI] [PMC free article] [PubMed] [Google Scholar]
- 42.Kim Y.S., Kim J.S., Cho H.S., Rha D.S., Kim J.M., Park J.D., Choi B.S., Lim R., Chang H.K., Chung Y.H., Kwon I.H., Jeong J., Han B.S., Yu I.J. Twenty-eight-day oral toxicity, genotoxicity, and gender-related tissue distribution of silver nanoparticles in Sprague-Dawley rats. Inhal. Toxicol. 2008;20:575–583. doi: 10.1080/08958370701874663. [DOI] [PubMed] [Google Scholar]
- 43.Wang J., Zhou G., Chen C., Yu H., Wang T., Ma Y., Jia G., Gao Y., Li B., Sun J., Li Y., Jiao F., Zhao Y., Chai Z. Acute toxicity and biodistribution of different sized titanium dioxide particles in mice after oral administration. Toxicol. Lett. 2007;168:176–185. doi: 10.1016/j.toxlet.2006.12.001. [DOI] [PubMed] [Google Scholar]
- 44.Iavicoli I., Leso V., Bergamaschi A. Toxicological effects of titanium dioxide nanoparticles: a review of in vivo studies. J. Nanomater. 2012 36 pp., Art ID 964381. [PubMed] [Google Scholar]
- 45.Bu Q., Yan G., Deng P., Peng F., Lin H., Xu Y., Cao Z., Zhou T., Xue A., Wang Y., Cen X., Zhao Y.L. NMR-based metabonomic study of the sub-acute toxicity of titanium dioxide nanoparticles in rats after oral administration. Nanotechnology. 2010;21:125105. doi: 10.1088/0957-4484/21/12/125105. [DOI] [PubMed] [Google Scholar]
- 46.Shi H., Magaye R., Castranova V., Zhao J. Titanium dioxide nanoparticles: a review of current toxicological data. Particle Fibre Toxicol. 2013;10:15. doi: 10.1186/1743-8977-10-15. [DOI] [PMC free article] [PubMed] [Google Scholar]
- 47.Warheit D.B. Debunking some misconceptions about nanotoxicology. Nano Lett. 2010;10:4777–4782. doi: 10.1021/nl103432w. [DOI] [PubMed] [Google Scholar]
- 48.Clapham D.E. Calcium signaling. Cell. 2007;131:1047–1058. doi: 10.1016/j.cell.2007.11.028. [DOI] [PubMed] [Google Scholar]
- 49.Saris N.E., Mervaala E., Karppanen H., Khawaja J.A., Lewenstam A. Magnesium: an update on physiological, clinical and analytical aspects. Clin. Chim. Acta. 2000;294:1–26. doi: 10.1016/s0009-8981(99)00258-2. [DOI] [PubMed] [Google Scholar]
- 50.Reddy B.S., Pleasants J.R., Wostmann B.S. Effect of intestinal microflora on calcium, phosphorus and magnesium metabolism in rats. J. Nutr. 1969;99:353–362. doi: 10.1093/jn/99.3.353. [DOI] [PubMed] [Google Scholar]
- 51.Whitehead M., Farrar G., Christie G., Blair J., Thompson R., Powell J. Mechanisms of aluminum absorption in rats. Am. J. Clin. Nutr. 1997;65:1446–1452. doi: 10.1093/ajcn/65.5.1446. [DOI] [PubMed] [Google Scholar]
- 52.Rouault T. How mammals acquire and distribute iron needed for oxygen-based metabolism. PLoS Biol. 2003;1:326–328. doi: 10.1371/journal.pbio.0000079. [DOI] [PMC free article] [PubMed] [Google Scholar]
- 53.Fosmire G. Zinc toxicity. Am. J. Clin. Nutr. 1990;51:225–227. doi: 10.1093/ajcn/51.2.225. [DOI] [PubMed] [Google Scholar]
- 54.Sahu S. Nanotoxicity: From In Vivo and In Vitro Models to Health Risks. John Wiley & Sons; Chichester: 2009. Hepatotoxic potential of nanomaterials. [Google Scholar]
- 55.Wang H., Wang J., Deng X., Sun H., Shi Z., Gu Z., Liu Y., Zhao Y. Biodistribution of carbon single-wall carbon nanotubes in mice. J. Nanosci. Nanotechnol. 2004;4:1019–1024. doi: 10.1166/jnn.2004.146. [DOI] [PubMed] [Google Scholar]
- 56.Carrero-Sánchez J.C., Elías A.L., Mancilla R., Arrellín G., Terrones H., Laclette J.P., Terrones M. Biocompatibility and toxicological studies of carbon nanotubes doped with nitrogen. Nano Lett. 2006;6:1609–1616. doi: 10.1021/nl060548p. [DOI] [PubMed] [Google Scholar]
- 57.Yamago S., Tokuyama H., Nakamura E., Kikuchi K., Kananishi S., Sueki K., Nakahara H., Enomoto S., Ambe F. In vivo biological behavior of a water-miscible fullerene: 14C labeling, absorption, distribution, excretion and acute toxicity. Chem. Biol. 1995;2:385–389. doi: 10.1016/1074-5521(95)90219-8. [DOI] [PubMed] [Google Scholar]
- 58.Dandekar P., Dhumal R., Jain R., Tiwari D., Vanage G., Patravale V. Toxicological evaluation of pH-sensitive nanoparticles of curcumin: Acute, subacute and genotoxicity studies. Food Chem. Toxicol. 2010;48:2073–2089. doi: 10.1016/j.fct.2010.05.008. [DOI] [PubMed] [Google Scholar]
Associated Data
This section collects any data citations, data availability statements, or supplementary materials included in this article.