

Summary
The MLL1 histone methyltransferase gene undergoes many distinct chromosomal rearrangements to yield poor-prognosis leukemia. The remaining wild-type allele is most commonly, but not always, retained. To what extent the wild-type allele contributes to leukemogenesis is unclear. Here we show using rigorous, independent animal models that endogenous MLL1 is dispensable for MLL-rearranged leukemia. Potential redundancy was addressed by co-deleting the closest paralog, Mll2. Surprisingly, Mll2 deletion alone had a significant impact on survival of MLL-AF9-transformed cells and additional Mll1 loss further reduced viability and proliferation. We show that MLL1/MLL2 collaboration is not through redundancy but regulation of distinct pathways. These findings highlight the relevance of MLL2 as a drug target in MLL-rearranged leukemia and suggest its broader significance in AML.
Keywords: AML, leukemia, histone methyltransferase, MLL1, MLL2, Wbp7, H3K4
Graphical abstract
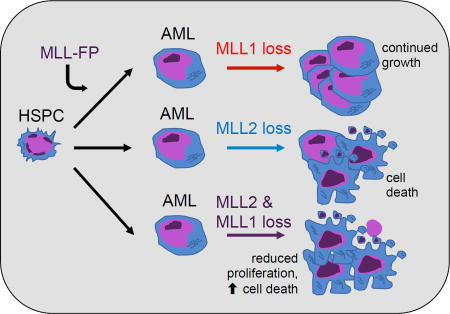
Chen et al. report that wild-type MLL1 is dispensable for MLL fusion leukemia, but instead loss of MLL2 reduces the survival of leukemia cells from human patients and in a mouse model of MLL-AF9 AML. Combined loss of MLL1 and MLL2 further reduces leukemia cell viability.
Introduction
The human Mixed Lineage Leukemia (MLL, MLL1, KMT2A) gene is disrupted by chromosomal translocations and other rearrangements in acute lymphoblastic leukemia (ALL) and acute myeloid leukemia (AML) at high frequency in infants and lower frequencies in children and adults. Chromosomal translocations result in the fusion of the amino-terminal part of MLL1 to one of more than 70 different partners forming gain-of-function oncoproteins (Muntean and Hess, 2012; Slany, 2016). The gain-of-function activity likely results from acquiring novel transcriptional effector domains from the fusion partner, including direct interaction with a transcriptional Super Elongation Complex (SEC), as well as the recruitment of the DOT1L histone H3, lysine 79 (H3K79) methyltransferase by many of the common MLL fusion proteins (MLL-FPs) (Bitoun et al., 2007; Okada et al., 2005; Yokoyama et al., 2010). Significant advances in understanding the mechanisms of transformation have recently been made, including the elucidation of MLL-FP-driven leukemogenic pathways (Muntean and Hess, 2012; Slany, 2016). Nonetheless, targeted therapy for MLL-rearranged leukemia that is clinically effective so far remains elusive.
Similarity to the Drosophila Trithorax (Trx) protein prompted studies demonstrating that MLL1, like Trx, positively regulates target gene expression including homeobox (Hox) genes (Yu et al., 1995). Trithorax and MLL1 contain a Su(var)3–9/Enhancer of Zeste/Trithorax (SET) domain, also present in S. cerevisiae Set1. The connection between histone methyltransferase (HMT) activity of the Set1/Trx related SET domains and gene activation was first extrapolated from Set1 studies (Briggs et al., 2001; Nislow et al., 1997; Roguev et al., 2001) and is generally conserved from yeast to humans (reviewed in (Herz et al., 2013)). In mammals, three pairs of SET domain-containing orthologs, namely MLL1 and 2, MLL3 and 4, and SETD1A and B (also called KMT2A and B, KMT2C and D, and KMT2F and G) (Allis et al., 2007), perform H3K4 mono-, di-, and tri-methylation with different global and gene-specific roles depending on cell type (Gu and Lee, 2013). These SET-domain containing proteins are each multiprotein complexes that target chromatin through distinct combinations of protein-protein and protein-DNA interactions, however they share several SET-domain interacting proteins that influence enzymatic activity (Dou et al., 2006; Goo et al., 2003; Shinsky et al., 2015; Wu et al., 2008; Yokoyama et al., 2004). The MLL1 and MLL2 complexes are unique in their N-terminal interaction with Menin-LEDGF, a subcomplex involved in binding to H3K36-methylated chromatin (Hughes et al., 2004; Yokoyama et al., 2005; Zhu et al., 2016). In the case of MLL-FPs, this subcomplex interaction is critical to sustain a leukemogenic gene program and has been the target of successful inhibitory compounds (Borkin et al., 2015; Yokoyama et al., 2005).
A common feature of MLL1-rearranged patient blast cells is that most retain and express the other intact, wild-type MLL1 allele. Because MLL-FPs lose the C-terminal SET domain upon translocation, and yet MLL-FP target gene promoters remain H3K4me3-modified, it has been assumed that endogenous MLL1 maintains this H3K4me status and facilitates MLL-FP-mediated leukemogeneis. Several lines of investigation support this concept. First, localization of MLL-AF9 to the HoxA locus in Mll1 knockout fibroblasts cannot occur, but can be restored by re-expression of full length MLL1 (Milne et al., 2010). Furthermore, shRNA knockdown and genetic deletion of Mll1 in MLL-AF9 murine leukemia cells reduced clonogenic potential and leukemia progression (Thiel et al., 2010). More recently, a drug disrupting the interaction of MLL1 and a critical SET subcomplex component, WDR5, inhibited growth of MLL-AF9 leukemia cells in vitro (Cao et al., 2014). Collectively these studies suggest that the HMT activity of MLL1 may contribute to expression of MLL-FP target genes, a logical concept given the lack of H3K4-methyltransferase activity of the FPs.
On the other hand, occasionally the second MLL1 allele is lost in patient blasts (Tang et al., 2014), as exemplified in the ML-1 leukemia cell line (Ohyashiki et al., 1986), suggesting that the requirement for MLL1 is not absolute. Furthermore, MLL-FP-driven leukemia can be initiated in cells genetically lacking the SET domain (thus the HMT activity) of endogenous MLL1 as efficiently as wild-type cells (Mishra et al., 2014). This finding was corroborated using domain scanning mutagenesis in established leukemia cells (Shi et al., 2015). Given these discrepancies and the importance of discovering therapeutic targets in MLL-rearranged leukemia, we rigorously re-addressed whether the endogenous MLL1 protein contributes to MLL-FP-initiated leukemia and whether redundancy with related methyltransferases plays any roles in these conflicting observations.
Results
Impact of MLL1 loss on MLL-FP-initiated AML
To determine the requirement for MLL1 in ongoing leukemia, we established MLL-FP-transformed cells in which the Kmt2a gene (referred to as Mll1) could be deleted upon induction of Cre∷ERT2 (Cre+) using 4-hydroxytamoxifen (4-OHT) or tamoxifen (TAM) (Figure 1A). Two critical controls were performed to ensure that MLL1-specific effects were measured. First, animals in which a single allele of Mll1 was flanked by loxP sites (“floxed, F”) were used as negative controls, as the resulting heterozygotes experience Cre induction and exhibit no overt phenotypes (data not shown). Second, we used deletion of Men1 (encoding Menin), an essential cofactor for MLL-fusion leukemia, as a reference. Multiple genetic and pharmacologic studies confirm that Menin is required for growth of MLL-FP-transformed cells (Borkin et al., 2015; Caslini et al., 2007; Yokoyama et al., 2005).
Figure 1. Endogenous MLL1 is dispensable for leukemia maintenance.

A) Scheme to test the role of endogenous MLL1 in MLL-FP-transformed leukemia cells. LSK cells from the indicated genotypes were transduced with bicistronic MLL-AF9 or MLL-AF6 retroviruses (YFP). Transduced cells were serially replated 4–6 times to select for transformed cells, treated with 50 nM 4-OHT in liquid culture for 24 hours, then subjected to CFU assays. In parallel, MLL-FP-transduced cells were engrafted into recipients. TAM was injected as indicated in the STAR Methods. B–E) CFU results from MLL-AF9- (B–C) or MLL-AF6- (D–E) transformed cells of the indicated genotypes. Mll1- (B and D) or Men1-deficient (C and E) CFUs were scored 7 days after plating in triplicate and then normalized to the CFU numbers obtained without 4-OHT. Bars represent normalized averages ± standard deviation (SD) from two independent experiments; ns, not significant; ****, p<0.0001. F–G) Kaplan-Meier survival curves of recipient animals engrafted with 0.3 million MLL-AF9- (F) or 1 million MLL-AF6- (G) transduced cells of the indicated genotypes (n=6–9 per genotype). TAM injections are indicated by dashed lines. H) Scheme for isolating an LSC-enriched population (YFP+/Lin/c-Kit+) from primary MLL-AF9 leukemia recipients 5 days after initiating TAM injections. I) Kaplan-Meier survival curve for mice transplanted with 2,500 Mll1Δ/+ or Mll1Δ/Δ (n=9 per genotype) LSC-enriched MLL-AF9 cells from primary recipients. J) CFU frequency was assessed as indicated in (B) (n=4 per genotype). Bars indicate averages ± SD; ns, not significant. K) Volcano plot of microarray results comparing sorted, LSC-enriched Mll1Δ/+ and Mll1Δ/Δ MLL-AF9 leukemia cells (n=4 per genotype). The fold change of normalized expression values versus −Log10 (p value) is shown. Differentially expressed genes are listed in Table S1. See also Figure S1 and Table S1.
Bone marrow Lin−/Sca1+/c-Kit+ (LSK) cells transduced with MLL-AF9 or MLL-AF6 were transformed in vitro by serially replating in methylcellose until blast colonies were enriched and non-transformed cells failed to replate (not shown). These two fusion oncoproteins were chosen as representative MLL-FPs that transform through distinct mechanisms, either through direct SEC recruitment or not (Yokoyama et al., 2010). Pools of transformed cells were treated briefly in liquid culture with 4-OHT to induce gene deletion (Figure 1A). The resulting Mll1- or Men1-deficient cells were then tested for serial replating activity as a surrogate for self-renewal. Consistently, no reduction in colony forming unit (CFU) frequency was observed upon initial plating in MLL-AF9- (Figure 1B) or MLL-AF6-transformed (Figure 1D) Mll1-deficient cultures or upon serial replating (data not shown). Mll1 deletion persisted after removal of 4-OHT (Figure S1A–B), demonstrating the absence of selective pressure to retain non-rearranged Mll1. In contrast, a substantial reduction in CFU was observed after Men1 deletion (Figure 1C and 1E). Furthermore, there was no evidence of differentiation of MLL-AF9- or MLL-AF6-transformed Mll1-deficient cells (Figure S1C and data not shown).
To test the role of endogenous MLL1 in ongoing leukemia in vivo, animals engrafted with either MLL-AF9 or MLL-AF6-transduced cells were injected with TAM after the peripheral blood leukemia percentage reached ~20% (Figure S1D–E). Leukemogenesis proceeded with the same kinetics as wild-type in Mll1-deficient MLL-AF9- or MLL-AF6-initiated leukemia (Figure 1F–G) despite efficient gene deletion (Figure S1F). Parallel experiments demonstrated that Men1 deletion resulted in a survival advantage for the recipients (Figure S1G) as has been previously shown (Caslini et al., 2007; Yokoyama et al., 2005).
We considered whether MLL1 loss would selectively affect leukemia stem cells (LSCs), revealed only upon secondary transplantation, so we sorted viable, YFP+/Lin−/c-Kit+ cells (LSC-enriched (Krivtsov et al., 2006; Somervaille and Cleary, 2006)) from TAM-treated primary recipients and engrafted them at limiting numbers to secondary recipients (Figure 1H). Both Mll1-deleted (Δ)Mll1Δ/Δ and control Mll1Δ/+ leukemia cells engrafted secondary recipients and produced a rapidly fatal disease with similar kinetics (Figure 1I and S1H). Leukemia cells from moribund mice remained Mll1-deficient with no selection for non-deleted cells (Figure S1I). CFUs of MLL-AF9 leukemia rendered Mll1-deficient in vivo (Figure 1H) were also not reduced (Figure 1J).
To clarify the impact of Mll1 deletion, genes differentially expressed comparing Mll1Δ/Δ and control Mll1Δ/+ leukemia cells were determined using the LSC-enriched population from TAM-treated primary recipients (Figure 1H). In agreement with the functional studies above, very few genes differed between the control Mll1Δ/+ and Mll1Δ/Δ cells, with 51 down-regulated and 17 up-regulated genes identified based on a fold change ≥1.5 and p<0.05 (Figure 1K and Table S1). Specifically, the expression of HoxA genes, which are strongly dependent on Mll1 in normal hematopoietic stem and progenitor cells (HSPCs) (Jude et al., 2007), was unaffected by Mll1 deletion (Figure S1J). Therefore, loss of Mll1 in MLL-FP-initiated leukemia has no impact on leukemia self-renewal in vitro or leukemia progression in vivo. This observation contrasts with the strong impact on leukemia progression and in vitro growth upon Men1 deletion (Figure 1C, E, S1G).
Despite the significant gene expression and functional impacts of Mll1 deletion on primary HSPCs (Jude et al., 2007), it is possible that the strong driving pressure of the MLL-FP results in compensation for MLL1 loss through unknown mechanisms. In fact, most Mll1 knockout alleles are not true null alleles, with various portions of proteins expressed from mutant alleles (Ayton et al., 2001; McMahon et al., 2007; Yagi et al., 1998; Yu et al., 1995). To rule out compensation through remaining portions of MLL1 itself, or unpredicted mechanisms, we reproduced the leukemia studies using a distinct conditional knockout allele created in the Stewart laboratory (Figure S2A). Cre-mediated recombination results in no detectable MLL1 protein (Denissov et al., 2014). As originally shown using the Ernst allele (Mll1E) (Jude et al., 2007) deletion using sorted LSK cells harboring the Stewart allele (Mll1S) resulted in significant down-regulation of Hoxa9, Meis1, Mecom/Evi1 and Prdm16 expression (Figure S2B). Consistent with our findings in MLL-FP-transformed cells (Figure 1), deletion of Mll1 using the Stewart allele had no impact on the growth, CFU frequency or colony size of MLL-AF9-transformed cells (Figure 2A–B). At the 4th serial replating after Mll1 deletion, the cells remained fully deleted (Figure 2C and data not shown) and expression of the MLL1 target genes Hoxa9 and Meis1 remained constant (Figure 2C). Furthermore, CRISPR/Cas9-mediated editing of MLL1 in human MLL-AF9 leukemia cells also showed that loss of endogenous MLL1 had no impact on cell growth (Figure 2D–F, S2C–E). Together, our results demonstrate that MLL1 is not required to maintain MLL-FP-transformed cell growth, in contrast to the strong dependence on Menin (Figure 1C, 1E, S1G)(Caslini et al., 2007; Yokoyama et al., 2005). Furthermore, prototypical MLL1 target genes are no longer under MLL1 control in MLL-AF9 leukemia cells.
Figure 2. Two distinct Mll1 targeting strategies corroborate lack of requirement for MLL1.

A) Serial replating of MLL-AF9-transformed leukemia cells after deletion of Mll1 using either the Mll1E (generated in Ernst laboratory) or Mll1S (generated in Stewart laboratory) conditional knockout alleles. One thousand cells were replated and CFUs were scored in triplicate every 5 days. CFUs were normalized to ethanol (EtOH)-treated cultures for each genotype. Bars indicate averages of triplicate cultures ± SD. Representative results of three independent experiments are shown. B) Representative colony images at the end of the 5th replating. C) Expression of Mll1 Hoxa9 and Meis1 at the end of the 1st and 4th serial replating as measured by qRT-PCR. Bars indicate triplicate PCR reactions ± SD. Representative results of two independent experiments are shown. D) Sequence of 5–6 independent genomic clones from each of 3 single cell line clones after CRISPR/Cas9 targeting (day 26) of human MLL1 (KMT2A) in MOLM-14 cells. The relevant region is shown with dashes representing deleted nucleotides. E) MLL1-C terminal western blot from cell clones shown in D after sequencing. F) Growth of MLL1-deficient clones (red, KMT2A) versus non-targeting (blue dash, NT) clones after sequencing. Average normalized viable cell counts from 3 independent clones per genotype are shown ± SD. See also Figure S2.
An unexpected role for Mll2 in MLL-AF9-driven leukemia
MLL2 (KMT2B) is the most closely related to MLL1 in the SET domain as well as in overall domain structure (Glaser et al., 2006) and there is some evidence that both can target to Hox loci and potentially compensate for each other (Denissov et al., 2014; Hughes et al., 2004). MLL2 is expressed at least as abundantly as MLL1 in AML, including both MLL-rearranged and other subtypes (Figure S3A). To determine whether MLL1 and MLL2 function redundantly to maintain leukemogenic target genes, we generated MLL-AF9-driven leukemia cells as in Figure 1A using c-Kit+ BM harboring combinations of Mll1F, Mll2F or both alleles. As observed before, deletion of Mll1 did not affect the initial CFUs, which was also true of Mll2 deletion alone on the first plating (Figure 3A). However, co-deletion of both genes significantly reduced CFUs (Figure 3A) although not as severely as the loss of Men1 (Figure 1C). We also observed a significant reduction in colony size using Mll1;Mll2 knockout leukemia cells (Figure 3B). Cell accumulation in liquid culture more clearly illustrated the growth defects, revealing no difference for Mll1 deletion but a ~50% reduction for Mll2-deficent MLL-AF9 cells after 9 days (Figure 3C–D). Strikingly, a >90% reduction in viable cells was observed at the same time point for Mll1;Mll2 knockout leukemia cells (Figure 3E). To determine the basis for the reduced cell accumulation, viability and proliferation assays were performed 5 days after initiating gene deletion. Cell viability was reduced in Mll2-deleted cells and was reduced further upon Mll1;Mll2 co-deletion (Figure 3F), consistent with increased cleaved Caspase-3, a hallmark of apoptosis in Mll1;Mll2 double knockout cells (Figure S3B). The Mll1;Mll2 double knockout also exhibited a slight but consistent reduction in proliferation (Figure 3G, S3C–E). Differentiation was not observed with any of the genotypes except for Men1-deleted cells (Figure 3H and S3F).
Figure 3. Loss of MLL2 affects the growth of MLL-AF9 leukemia cells and collaborates with MLL1 loss.

A) Results of CFU assays performed after Mll1, Mll2 or Mll1;Mll2 deletion in MLL-AF9-transformed leukemia cells. The Mll1 floxed allele is the Mll1S version. Leukemia cells were treated with 100 nM 4-OHT for 24 hours, washed, cultured an additional 48 hours and plated on methylcellulose. Colonies were scored in triplicate at 7 days and normalized to EtOH-treated controls; averages of two independent experiments ± SD are shown; ****, p<0.0001. B) Representative colony image from Cre+;Mll1F/F, Cre+;Mll2F/F or Cre+;Mll1F/F;Mll2F/F leukemia cells treated with EtOH or 4-OHT after 7 days growth in methylcellulose. C–E) Leukemia cell growth in liquid culture was quantified after deleting Mll1, Mll2 or both genes (Mll1;Mll2). In each panel, the top graph illustrates deletion of a single allele (F/+ controls) and bottom graph represents homozygous deletion of the indicated gene(s). Deletion was initiated (t=0) as described in (A) for Mll1 (C), Mll2 (D) or Mll1;Mll2 (E) then live cell numbers were determined in triplicate cultures from day 3 to day 9 and normalized to day 3 input cell number. Error bars reflect SD. Representative results of two independent experiments are shown. F) Cell viability was determined at day 5 post-deletion in triplicate cultures. Bars indicate averages ± SD; **, p<0.01; ***, p<0.001. G) Proliferation was measured using BrdU assays 5 days after initiating gene deletion. Bars indicate averages from three independent experiments ± SD; **, p<0.01. H) Representative Wright-Giemsa-stained cytospin images of MLL-AF9 leukemia cells 5 days post-deletion comparing Men1 to Mll1;Mll2 knockout cells. Differentiated cells are indicated by black arrows. See also Figure S3–S4.
We asked whether human AML exhibited the same sensitivities to MLL1 and MLL2 loss using an inducible CRISPR/Cas9-mediated gene editing system (Figure S4A). This approach confirmed that MLL1 editing in all leukemia lines had little impact on cell growth, including MLL-FP and other oncogene-expressing cell lines (Figure S4B–E). However, the loss of MLL2 reduced growth and survival of all cell lines regardless of driver oncogene (Figure S4B–E). In most lines tested (except HL-60), editing both HMTs resulted in a further significant reduction in cell growth compared to loss of MLL2 alone (Figure S4F). These data underscore the significance of MLL2 and MLL2+MLL1 in survival and proliferation of murine and human AML.
To test whether the co-deletion of Mll1 and Mll2 affected ongoing leukemogenesis in vivo, we expanded control Cre+;Mll1F/+;Mll2F/+ and Cre+;Mll1F/F;Mll2 F/F, MLL-AF9-transformed leukemia cells in primary recipients, transplanted equal number of leukemia cells into secondary recipients, then initiated deletion through TAM injections when the peripheral blood leukemia percentage reached ~20% (Figure 4A). In contrast to our observations with Mll1 (Figure 1F–G), we observed significantly delayed latency in recipients of Mll1;Mll2 double knockout leukemia cells (Figure 4B). Further, Mll1;Mll2-deficient leukemia cells generated in vivo yielded reduced CFUs, smaller colonies, reduced growth and reduced survival in vitro (Figure 4C–G).
Figure 4. Mll1;Mll2 deletion delays leukemogenesis in vivo and impairs AML growth.

A) Starting peripheral blood leukemia percentage prior to TAM injections. MLL-AF9 leukemia cells were generated by transducing LSK cells and defined as CD45.2+/YFP+. Bars indicate averages from 6–7 mice per genotype ± SD; ns, not significant. B) Kaplan-Meier curve showing the survival of TAM-treated Cre+;Mll1F/+;Mll2F/+ (n=7) and Cre+;Mll1F/F;Mll2F/F (n=6) MLL-AF9 leukemia recipients. Dotted lines indicate TAM injections. C) CFU assay was performed using 1,000 sorted CD45.2+/YFP+ cells from recipients 5 days after the TAM treatment (n=3 per genotype). Bars indicate averages ± SD; *, p<0.05. D) The total viable cell number per plate was determined 7 days after plating. Bars indicate averages ± SD; **, p<0.01. E) Three representative colony images are shown from the cultures described in (C). F) Cell growth in liquid culture. Two thousand five hundred leukemia cells from TAM-treated recipients were used to initiate liquid culture and live cells were enumerated every other day. Triplicate cultures from 3 donors per genotype were normalized to input cell number, averaged and represented as relative cell number. Error bars represent SD. G) Leukemia cell viability at day 4 of the liquid culture. Bars indicate averages of triplicate cultures from 3 individual donors per genotype ± SD; ****, p<0.0001.
MLL1 and MLL2 collaborate to regulate gene expression and leukemia maintenance
To determine the molecular pathways regulated by MLL1/MLL2 proteins and gain insight into their collaboration, we investigated genes deregulated by acute Mll1 and/or Mll2 deletion in MLL-AF9 leukemia cells. RNA-sequencing (RNA-seq) was performed using cells 3 days after initiating gene deletion, which was determined optimal for protein reduction (Glaser et al., 2009) and reduced expression of direct target genes (data not shown). Similar to what we observed previously (Figure 1K) few (69) genes were altered by Mll1 deletion alone, 171 were deregulated by Mll2 deletion alone and 444 genes deregulated by the Mll1;Mll2 compound knockout given the same criteria for analysis (Figure 5A and Table S2–S4). To assess potential overlap in the pathways regulated by these two proteins, we focused on down-regulated genes, since both MLL1 and MLL2 predominantly activate or maintain expression of direct target genes (Artinger et al., 2013; Austenaa et al., 2012). In addition to the limited overlap in genes down-regulated by Mll1- versus Mll2-deletion (16%), it appeared that Mll2-dependent genes dominated the transcriptional landscape of the double knockout. For example, only 5% of the down-regulated genes in the Mll1;Mll2 double knockout cells were shared with the Mll1-knockout, whereas Mll2-dependent genes were 30% of the double knockout category (Figure 5B and Table S5). Nonetheless, 68% of the down-regulated genes in Mll1;Mll2 double knockout leukemia cells are unique (Figure 5B and Table S5).
Figure 5. Genome-wide transcriptional consequences of Mll1-, Mll2- and Mll1;Mll2- deletion in MLL-AF9 leukemia cells.

A) Volcano plots representing RNA-seq data comparing individual or co-deletion of Mll1 and Mll2 in MLL-AF9-transformed cells. Data was obtained from duplicate cultures 72 hours after initiating deletion. Differentially expressed genes were determined by comparing each 4-OHT-treated sample to its own EtOH control. Genes with fold change ≥1.5 and p<0.05 are listed in Table S2–S4. B) Venn diagram illustrating overlap in down-regulated genes. The genes in each category are indicated in Table S5. C) GO term enrichment using Ingenuity Pathway Analysis (IPA) “diseases or functions” category. Shown are the top 10 up-regulated and down-regulated pathways after Mll1;Mll2 deletion based on −Log10(p value). D) Z scores for selected pathways shown for all 3 genotypes (Mll1, Mll2 or Mll1;Mll2 double knockout). Pathways selected reflect the largest Z scores in the double knockout cells from the IPA category described in (C). All categories were enriched with p<1012 except “viral infection” in the Mll1 knockout data, which was enriched with p=9.68×10⁴. See also Table S2–S5.
To broadly consider the cellular pathways affected in the Mll1;Mll2 knockout leukemia cells, we performed Gene Ontology (GO) term enrichment. The top up-regulated GO terms observed in Mll1;Mll2 double knockout cells included “cell death”, “apoptosis” and “necrosis”, while the top down-regulated showed “proliferation” and “viral infection” terms (Figure 5C and Tables S2–S4). A progressive enrichment in these gene categories was observed in Mll1, Mll2, and Mll1;Mll2 double knockout cells (Figure 5D), in accord with the increased cell death and decreased cell proliferation phenotypes we observed in Mll1;Mll2-deleted leukemia cells in Figure 3.
To specifically address whether Mll1;Mll2 loss affected MLL-AF9 target genes, we performed Gene Set Enrichment Analysis (GSEA) comparing to gene sets representing MLL-AF9-regulated or bound genes (Bernt et al., 2011; Zuber et al., 2011). Neither gene set reached significance (p≥0.05) in any of our RNA-seq data (Figure 6A). Similarly, neither DOT1L–regulated nor Hoxa9/Meis1-regulated genes were enriched (Figure S5, (Bernt et al., 2011; Huang et al., 2012)). In contrast, Men1 deletion significantly enriched MLL-AF9-upregulated and MLL-AF9-bound gene sets (NES=2.13, 2.17, p<0.001, data not shown), consistent with its direct impact on MLL-FPs. qRT-PCR of representative MLL-AF9 target genes corroborated the GSEA findings including the small but reproducible reduction in Jmjd1c and Runx2 expression in Mll1;Mll2-deleted cells (Figure 6B). Thus, the majority of MLL-AF9-regulated genes are not affected by Mll1;Mll2 co-deletion.
Figure 6. Co-deletion of Mll1 and Mll2 does not significantly deregulate MLL-AF9 fusion target genes.

A) GSEA plots showing the lack of significant enrichment of MLL-AF9-regulated genes or direct MLL-AF9-bound targets in MLL-AF9 leukemia cells with Mll1, Mll2 or Mll1;Mll2 co-deletion. Gene sets are described in STAR Methods. B) Validation of select MLL-AF9 target gene expression using three randomly picked clones from each leukemia pool. Expression of the indicated genes was determined 72 hours post-deletion. Bars represent qRT-PCR results from 3 independent clones ± SD. See also Figure S5.
Interestingly, several previously characterized MLL2 target genes (Magohb, Pigp) (Austenaa et al., 2012; Glaser et al., 2006; Ladopoulos et al., 2013) were significantly down-regulated in the Mll2-deficient leukemia cells, and further down-regulated in the double knockout cells (Figure 7A). To gain insight into possible mechanisms of collaboration between MLL1 and MLL2, we performed chromatin immunoprecipitation (ChIP) experiments focusing on these previously characterized MLL2 target genes in all three genotypes. The promoter regions of both Pigp and Magohb exhibited reduced H3K4me3 enrichment in the Mll2, but not Mll1 knockout cells, but this was not exacerbated in the Mll1;Mll2 double knockout cells (Figure 7B), suggesting a contributory role for MLL1 that is distinct from promoter H3K4 methylation. We then examined overall H3K4 methylation levels and found that loss of MLL2 resulted in the overall reduction in H3K4me2/me3 levels, which again was not exacerbated by MLL1 loss (Figure 7C). The overall reduction of H3K4me2/me3 as determined by densitometry was 40–70% (Figure 7D). This observation is more severe, but consistent with findings in Mll2-deficient macrophages and embryonic stem cells (Austenaa et al., 2012; Denissov et al., 2014).
Figure 7. Reduced expression of MLL2 target genes is exacerbated by loss of MLL1, but through mechanisms other than H3K4 methylation.

A) Validation of RNA-seq results using qRT-PCR focusing on direct MLL2 target genes. Three independent clones randomly picked from each leukemia pool were tested for expression of the indicated genes 72 hours post-gene deletion. Bars represent PCR data from 3 independent clones ± SD; **, p<0.01; ***, p<0.001. B) ChIP-PCR to detect H3K4me3 enrichment at Pigp and Magohb promoter regions was performed 72 hours after gene deletion. Shown is the fold enrichment compared to input, representative of two individual experiments. Bars represent averages from triplicate PCR reactions ± SD. C) Representative western blotting showing levels of total H3K4me1, H3K4me2 and H3K4me3 in MLL-AF9 leukemia cells 72 hours after initiating gene deletion. D) Quantification of H3K4me1/2/3 western blots. Pixel density was normalized to the EtOH-treated control. The average normalized intensity from 3 independent experiments ± SD is shown.
Survival pathways uniquely affected by co-deletion of Mll1 and Mll2
Apparent from the RNA-seq data of Mll1;Mll2 knockout leukemia cells was reduction in components of three major pathways previously implicated in AML survival (NFκB, integrin β-3 and IL-3). First, reduced tonic NFκB signaling was inferred based on an enrichment for RelA (NFκB)-dependent genes in the Mll1;Mll2 knockout data set using GSEA (Figure 8A). This observation was confirmed in independent samples rendered Mll1;Mll2-deficient either in vitro or in vivo (Figure 8B–C). Furthermore, the induction of NFκB-regulated genes in Mll1;Mll2-deficient MLL-AF9 leukemia cell by lipopolysaccharide (LPS) was profoundly attenuated (Figure S6A). LPS activates NFκB signaling through toll-like receptor 4 (TLR4), and as shown previously (Austenaa et al., 2012), this phenomenon in Mll2-deficient macrophages was attributed to reduced Pigp, encoding a critical component of an enzyme complex that adds glycosyl phosphatidylinositol (GPI) anchors to cell surface proteins (Ferguson et al., 2009). In the Austenaa et al. study, reduced surface expression of CD14, a GPI-modified TLR4 co-receptor was responsible for attenuated NFκB signaling. This mechanism likely operates in MLL-AF9-transformed cells as well, since overexpression of a GPI-independent form of CD14 (CD14-TM) can partially rescue expression of NFκB-dependent genes in Mll1;Mll2 double knockout cells (Figure S6B). Given the evidence that inhibition of NFκB can severely limit MLL-AF9 leukemogenesis (Kuo et al., 2013) and is known to play a pro-survival or LSC-maintenance role in AML with diverse cytogenetics (Guzman et al., 2001; Kagoya et al., 2014), it is likely that this defect contributes to reduced survival of Mll1;Mll2 knockout MLL-AF9 cells.
Figure 8. Altered NFκB, integrin β-3 and IL-3 pathways in Mll1;Mll2 deficient MLL-AF9 leukemia.

A) GSEA plot showing the enrichment of RelA-regulated genes in the control compared to Mll1;Mll2-deleted MLL-AF9-transformed cells. B) Expression of representative NFκB targets in Mll1;Mll2-deleted MLL-AF9 leukemia cells produced in vitro. qRT-PCR was performed 72 hours post-deletion. Bars indicate averages of triplicate PCR reactions ± SD and experiments were reproduced twice; **, p<0.01; ****, p<0.0001. C) Expression of representative NFκB targets in Mll1;Mll2-deleted MLL-AF9 leukemia cells produced in vivo. Five days after TAM injections, leukemia cells (CD45.2+/YFP+) were sorted and expression of NFκB target genes was determined by qRT-PCR. Averages from 2–3 recipients per genotype are shown ± SD; *, p<0.05; ***, p<0.001. D) The expression level of Itgb3 was validated in independently transformed MLL-AF9 leukemia cells by qRT-PCR. Averages from two recipients per genotype ± SD are shown; ***, p<0.001. E) CD61 staining by flow cytometry after Mll1;Mll2 deletion evaluated 72 hours after EtOH or 4-OHT treatment as in (D). Shown are representative histograms from three independent experiments. Neg indicates unstained control. F) Cell surface CD61 expression was significantly reduced in Mll1;Mll2 double knockout leukemia cells. Transformed MLL-AF9 leukemia cells were treated as in (D) and the geometric mean fluorescent intensity was graphed. Bars indicate averages of triplicate cultures ± SD; **, p<0.01. G) The expression level of Il3ra transcript was validated in independently transformed MLL-AF9 pools by qRT-PCR with EtOH- or 4-OHT-treated samples. Data represents averages from two recipients per genotype ± SD; **, p<0.01. H) Cell viability at different IL-3 concentrations using Cre+;Mll1F/F, Cre+;Mll2F/F or Cre+;Mll1F/F;Mll2F/F leukemia cells treated with EtOH or 4-OHT. Seventy-two hours after initiating gene deletion, leukemia cells were cultured with 0.1 or 10 ng/mL IL-3. Data represents average percentage of viable cells 3 days later from triplicate cultures ± SD. I) MLL-AF9 leukemia cell viability with individual or combined treatment of IKK inhibitor VII (0.5 µM) + R406 (0.5 µM) + low IL-3 (0.1 ng/mL) for 3 days. Data represents averages of triplicate cultures ± SD; ****, p<0.0001. J) Model illustrating the role of MLL-FPs and MLL1/MLL2 in maintaining leukemia survival and proliferation. MLL-FP-regulated pathways are largely distinct from MLL1/MLL2-regulated pathways. Loss of both MLL1 and MLL2 deregulates NFκB, integrin β-3 and IL-3 pathways, reducing survival and proliferation. The dashed arrow indicates that MLL1 contributes to these processes through unknown collaborative mechanisms, which likely do not involve HMT activity. See also Figure S6–S7 and Table S6.
The second survival pathway affected in the Mll1;Mll2 double knockout leukemia cells is represented by integrin β-3/CD61 (encoded by Itgb3). The Itgb3 transcript was confirmed to be consistently down-regulated in Mll1;Mll2 double knockout leukemia cells, but not in either single knockout (Figure 8D and Figure S6C). In leukemia cells 3 days after Mll1;Mll2 deletion, the CD61+ population and the mean fluorescence intensity (MFI) within this population dropped ~2-fold (Figure 8E–F). Interestingly, the enrichment of H3K4me3 at the promoter of the Itgb3 gene was also reduced, suggesting this gene may be a direct target of MLL2 in leukemia cells (Figure S6D and data not shown). Previous studies had demonstrated that MLL-AF9 leukemia is particularly sensitive to depletion of integrin β-3 as knockdown of Itgb3 inhibits MLL-AF9-driven leukemogenesis in vivo, as does inhibition of its intracellular signaling component, Spleen Tyrosine Kinase (SYK, (Miller et al., 2013)).
Finally, the Il3ra transcript was also confirmed to be reduced by ~50% in Mll1;Mll2 double knockout leukemia cells (Figure 8G). Mll2-deficient leukemia cells could be partially rescued by culturing cells in high (≥10 ng/mL) IL-3 whereas the double knockout cells could only be slightly rescued (Figure 8H). Furthermore, re-expression of IL3Rα partially rescued the double knockout cells (Figure S6E). In addition to playing a critical role in the survival of AML cells, this cytokine receptor (also called CD123) identifies a repopulating fraction of AML (Jordan et al., 2000) and is a target of antibody-, cell- and toxin-based therapeutics in AML and other hematologic malignancies (Liu et al., 2015).
To determine the relative importance of MLL2 target genes and pathways deregulated upon co-deletion of Mll1 and Mll2, we expressed genes in Cre+;Mll1F/F;Mll2F/F cells, treated cells with 4-OHT to induce deletion, then measured cell viability 4 days later. This test included Pigp, Magohb, Itgb3 and Il3ra (likely direct MLL2 targets), as well as the pro-survival proteins Bcl-xL and Bcl-2 to test the degree to which blocking cell death compares to re-expression of more upstream regulators. Re-expression of most individual genes was not sufficient to restore cell viability, however, the expression of Bcl-xL, Bcl-2 or IL3Rα significantly restored cell viability, and to a lesser extent, cell accumulation post-Mll1;Mll2 deletion (Figure S6E), illustrating the significant role of IL-3 signaling and cell survival machinery. Given the depth of gene expression changes in Mll1;Mll2-deficient leukemia cells, it is not surprising that a single gene does not fully rescue the survival defects. However, due to the significant impact of individual inhibition of NFκB, integrin β-3 or IL-3 signaling (Kuo et al., 2013; Liu et al., 2015; Miller et al., 2013), the reduction of all 3 pathways concurrently in the Mll1;Mll2 knockout cells would be predicted to dramatically reduce survival and proliferation.
Since there are currently no drugs that selectively target MLL2, or both MLL1+MLL2, we determined whether we could recapitulate the effects observed in Mll1;Mll2 double knockout leukemia cells using a pharmacologic approach targeting downstream pathways. Pharmacologic inhibitors of NFκB and integrin β-3/SYK have been tested individually on MLL-FP leukemia cells (Kuo et al., 2013; Miller et al., 2013). To test pharmacologic co-inhibition of these pathways, we used combinations of the IκB kinase (IKK) inhibitor VII and R406 to inhibit SYK signaling together with reduced IL-3 concentration. Although single treatment had minimal toxicity, double treatment showed a range of synergism, and combined inhibition of NFκB, integrin β-3 and IL-3 signaling were significantly more effective than pair-wise combinations (Figure 8I and Figure S7). Synergy between NFκB and SYK inhibition was observed for other MLL-FP-driven murine and human AML samples (Figure S7A–B and Table S6), and variably in other genetically defined models of AML (Figure S7A–B and Table S6). Importantly, human cord blood CD34+ progenitors were less sensitive to the drug combination than primary human AML when compared side-by-side, although a much greater sample number would be required to make conclusions regarding the categories of AML exhibiting sensitivity to this drug combination. These data suggest that MLL2, with contribution from MLL1, may regulate critical survival targets in multiple cytogenetic categories of AML. These data also illustrate that predictions from the genetic data, despite the lack of effective MLL2 inhibitors, may be informative for defining targetable pathways for which inhibitors exist. Nonetheless, these findings demonstrate therapeutic value in targeting the MLL2 histone methyltransferase in AML and further predict that this approach would be complementary to direct MLL-FP targeting as occurs using compounds that inhibit Menin interaction (Figure 8J).
Discussion
The current study initially aimed to unambiguously determine the role of endogenous MLL1 in MLL-FP-driven leukemia. We found that neither MLL-AF9- nor MLL-AF6-initiated leukemia was affected by deleting endogenous Mll1. Differentiation, proliferation, survival, self-renewal in vitro and in vivo, as well as the maintenance of leukemogenic MLL-FP direct target gene expression were all unaffected by deletion of endogenous Mll1 using two distinct conditional knockout models and human leukemia cells. Importantly, loss of Mll1 alone can have a major impact in other AML models, including those initiated by MN1 and Nup98 fusion proteins (Riedel et al., 2016; Xu et al., 2016). In searching for an explanation for our results, we uncovered a role for the MLL1 paralog, MLL2, which had not previously been implicated in leukemia. We show that Mll2 deletion reduced MLL-AF9 leukemia cell survival, and that the co-deletion of both Mll1 and Mll2 resulted in more severe reductions in survival, proliferation and gene expression than either individual gene deletion. Our conclusions regarding the role of MLL1 in MLL-FP leukemia differ from prior studies (Cao et al., 2014; Thiel et al., 2010) possibly due to combined effects of Cre induction and Mll1 deletion, since we and others have found reduced cell viability upon sustained Cre expression (Li et al., 2014; Zhu et al., 2012), which we have minimized in this study through optimizing protocols for induction. Also, the pharmacologic inhibition of MLL1 (Cao et al., 2014) resulted in very different gene expression changes than our genetic deletions, possibly due to unpredicted effects of the new compounds in cells. Future side-by-side comparisons and treatment of Mll1-deficient AML cells will clarify these discrepancies.
Because Mll1 deletion has such a severe impact on bone marrow hematopoiesis (Gan et al., 2010; Jude et al., 2007; McMahon et al., 2007), the discovery that Mll2 plays a larger role in sustaining MLL-FP-driven leukemia presents an encouraging opportunity for targeted therapy. The data presented here suggest a larger therapeutic index upon inhibition MLL2 as compared to MLL1 inhibition in leukemia patients. MLL2 loss affects oocyte viability, female fertility and early embryogenesis (Andreu-Vieyra et al., 2010; Denissov et al., 2014) but has little apparent impact on normal hematopoiesis or tissue homeostasis in adult animals (Glaser et al., 2009). In this leukemia model it appears that the HMT activity of MLL2 is involved in its leukemia maintenance role, based on the observation of reduced global and MLL2 target gene-specific H3K4me2/3 levels. This is in contrast to the lack of requirement for the MLL1 HMT activity/SET domain in MLL-AF9-driven leukemia (Mishra et al., 2014). Thus selective targeting the HMT activity of MLL2 may limit ongoing leukemogenesis without affecting normal tissue homeostasis.
The mechanism(s) by which MLL1 collaborates with MLL2 to promote leukemia survival and proliferation are currently unclear. Examination of genes that are unaffected by Mll1 deletion on its own, but exacerbated by Mll1 deletion in the Mll2-deficient background shows that the reduction in H3K4me3 enrichment around the transcription start site is not exacerbated in the double knockout. Therefore, it is possible that the contribution of MLL1 to the double knockout phenotype occurs through mechanisms other than its HMT activity, as suggested by our prior studies (Mishra et al., 2014). These mechanisms could be indirect, such as maintaining expression of synergistic signaling pathways that influence MLL2 target gene expression through non-HMT activities of the MLL1 protein complex. Alternatively, it is possible that MLL1 acts as an HMT in subtle ways that influence MLL2 target genes that were not detected in prior studies. Although the loss of promoter H3K4me2/3 enrichment due to Mll2 deletion may not be sufficient to reduce the expression of a gene in some cases (eg. (Austenaa et al., 2012)), it may expose the gene to repressive histone modifications, which may be influenced by the absence of Mll1. Interestingly, the co-deletion of Jmjd2a/b/c, H3K9 demethylases, also resulted in reduced Magohb and Il3ra expression as we observed in the Mll1;Mll2 knockout MLL-AF9 cells (Agger et al., 2016). These observations suggest that Magohb and Il3ra represent a class of genes in leukemia cells that are poised for H3K9me3-mediated repression upon the loss of H3K4me2/3.
Analysis of genes deregulated in Mll1;Mll2 double knockout cells identified least three major AML survival pathways that are impaired. We show that tonic NFκB signaling is attenuated, integrin β-3 level is reduced, and that IL-3 signaling is ineffective upon co-deletion of Mll1 and Mll2. The mechanisms connecting these transcriptional changes to MLL1/MLL2 are likely both direct and indirect. One mechanism proposed to account for the sensitivity of MLL-rearranged leukemia to NFκB inhibition was an inter-dependence between RelA/NFκB and MLL1/MLL-FPs to sustain leukemogenic target gene expression such as Hoxa9 and Meis1 (Kuo et al., 2013). Although our data also show a profound reduction in basal and inducible NFκB target gene response, it appears to occur through a mechanism more similar to the signaling defect reported in Mll2Δ/Δ macrophages (Austenaa et al., 2012), since it can be partially rescued by transmembrane-targeted CD14 and is specific to TLR4 ligands (data not shown). Furthermore, we do not observe a reduction in Hoxa9/Meis1 or their target genes. Nonetheless, a chromatin-based mechanism (Kuo et al., 2013) may also contribute to the reduced viability of Mll1;Mll2 knockout leukemia cells, particularly in vivo where the signal for NFκB activation is unknown.
Pharmacologic inhibition of three pathways under MLL2/MLL1 control was sufficient to synergistically kill MLL-AF9 leukemia, recapitulating the survival defect observed upon Mll1;Mll2 deletion. Furthermore, the fact that the Mll1;Mll2-deficient leukemia cells do not exhibit down-regulation of direct MLL-AF9 target genes suggests that combining MLL2 or MLL1+MLL2 inhibition with compounds that disrupt the Menin-MLL interface (Borkin et al., 2015) or DOT1L activity (Bernt et al., 2011) would further sensitize cells and improve cell killing in this category of poor-prognosis leukemia. More broadly, the pathways under MLL2/MLL1 control are not specific to MLL-AF9-driven AML and have been implicated in other cytogenetic categories of AML, suggesting that targeting MLL2 or MLL1+MLL2 may be generally applicable in AML treatment.
STAR METHODS
CONTACT FOR REAGENT AND RESOURCE SHARING
Further info and requests for resources and reagents should be directed to and will be fulfilled by the Lead Contact, Patricia Ernst (patricia.ernst@ucdenver.edu).
EXPERIMENTAL MODEL AND SUBJECT DETAILS
Animals
Animal studies were conducted in accordance with IACUC-approved animal protocols at Dartmouth College, University of Colorado, Denver and in accordance with German animal welfare legislation. The Ernst Mll1F/F, Stewart Mll1F/F, Mll2F/F and Men1F/F mice were intercrossed with male R26CreER mice from Artemis or The Jackson Laboratories. Recipients were C57BL/6 or B6.SJL (Ptprca Pep3b/BoyJ) female mice between 6 and 12 weeks of age, purchased from The Jackson Laboratory. Deletion efficiency for all alleles was determined by qRT-PCR or semi-quantitative genomic PCR using the primers listed in Table S7.
Mouse cell culture
LSK cells were cultured in SFEM medium (Stemcell Technology) supplemented with 300 ng/mL murine SCF (R&D), 20 ng/mL murine IL-11, 4 ng/mL murine Flt3L and 50 µg/mL gentamicin (Mediatech, Inc.). MLL-AF9, MLL-AF6, Cbfβ-SMMHC/NrasG12D, MN1 and BCR-ABL/NUP98-HOXA9 leukemia cells were cultured in Iscove’s Modified Dulbecco’s medium (IMDM, Mediatech, Inc.), BSA/insulin/transferrin (BIT, Stemcell Technology), 15% fetal bovine serum (FBS, Gibco), 2 mM L-glutamine (Mediatech, Inc.), 50 µM 2-mercaptoethanol (2-ME), 50 µg/mL gentamicin, 50 ng/mL murine SCF, 10 ng/mL murine IL-6 and 10 ng/mL murine IL-3.
Human cell culture
All human studies were performed with informed consent and approval from the Colorado Multiple Institutional Review Board. MOLM-14, MV4;11, KASUMI-1 and HL-60 cells were cultured in RPMI 1640 (Mediatech, Inc.), 10% FBS and 50 µg/mL gentamicin. MONO-MAC-1 cells were cultured in IMDM, 10% FBS and 50 µg/mL gentamicin. Umbilical cord blood cells were obtained from ClinImmune Labs; mononuclear cells were purified on Ficoll-Paque PLUS (GE Healthcare Life Sciences), then CD34+ cells were enriched following the manufacturer’s instructions (Miltenyi Biotec). Primary AML cells were obtained from the adult AML or pediatric tissue banks at the University of Colorado School of Medicine or Children’s Hospital Colorado. Detailed AML sample information is shown in Table S6. Both CD34+ (fresh or frozen) and AML (frozen) samples were cultured in IMDM, 20% BIT, 30 µg/mL LDL, 50 µM 2-ME, 50 µg/mL gentamicin, 100 ng/mL human SCF, 10 ng/mL human TPO, 10 ng/mL human Flt3L, 10 ng/mL human IL-3 and 10 ng/mL human IL-7.
METHOD DETAILS
Recombinant DNA
The MSCV-MLL-AF6-YFP plasmid was generated by transferring an EcoRI to SalI fragment from the MLL-AF6-neo vector to MSCV-IRES-YFP. The plasmids used for re-expression (Figure S6E) were obtained by cloning murine Itgb3, murine Magohb (both amplified from mouse cDNA), murine Il3ra (purchased from SinoBiological), human BCL2L1 (Addgene) and human BCL2 (Dr. Kazuhito Yamamoto) into MSCV-IRES-hCD4.
Drug treatment
For NFκB activation, MLL-AF9 leukemia cells were treated with 100 ng/mL LPS for the time indicated in the figure. Both R406 and IKK inhibitor VII were dissolved in DMSO for drug treatment. Cre induction in leukemia cells was initiated in culture medium supplemented with 50–100 nM 4-OHT dissolved in ethanol. TAM was dissolved in sunflower oil; 2 mg per mouse was injected intraperitoneally every other day using 2–3 doses.
Retroviral procedures, transformation and engraftment of MLL-FP cells
Retroviral supernatants were produced using 293T cells as described (Artinger et al., 2013). To produce leukemia lines, LSK or c-Kit-enriched cells were purified, pre-stimulated overnight, and transduced as described (Artinger et al., 2013) with MSCV-MLL-AF9-YFP, MSCV-MLL-AF9-GFP or MSCV-MLL-AF6-YFP retroviral supernatant. Transduced cells were either replated in M3434 medium (StemCell Technologies) every 5–7 days, or transplanted by retro-orbital injection together with 0.4 million unfractionated bone marrow cells into lethally irradiated recipients. Animals were given Baytril-containing sterile water (0.1 mg/mL, Bayer) for 3 weeks post-transplantation. The emergence of AML was confirmed by the presence of CD45.1+/YFP+ or CD45.2+/YFP+ blasts in peripheral blood. After disease onset, leukemia cells were harvested from the bone marrow and transplanted into sublethally irradiated secondary recipients. Recipient conditioning was performed on a Cs137 irradiator using 950 Rads given in 2 doses 4 hours apart for lethal dose, or 450 Rads in a single dose for sublethal irradiation.
Flow cytometry and sorting
Cells were stained on ice in Hanks buffered saline solution (HBSS, Mediatech, Inc.) plus 2% FBS and sorted using a FACSAria (BD Biosciences). FlowJo software was used to analyze data from BD FACS Calibur, BD LSR Fortessa X-20 or EMD Millipore Guava. All the antibodies used for flow cytometry are listed in the Key Resource section above. Lineage antibodies included CD3e, IL-7Rα, CD8, CD19, Ter119, CD4, Gr-1, B220 and CD11b. The LSC-enriched population was defined as YFP+/Lin−/c-Kit+; lineage antibodies in this case were CD3e, IL-7Rα, CD8, CD19, Ter119, CD4 and B220.
Cell viability and proliferation assays
Viability was determined by PI (1 µg/mL) exclusion and Annexin V staining. The bromo-deoxyuridine (BrdU) incorporation assay was performed according to the manufacturer’s protocol using the APC BrdU Flow Kit using a 30 minute incubation with BrdU. Cell growth assays were initiated by plating 2,500–20,000 cells/200 µL with medium exchange the day of cell counting. Live cell enumeration was performed using EMD Millipore Guava.
Quantitative PCR reactions
Cells were lysed in TRIzol and RNA was purified with either RNeasy Mini Kits or Direct-zol RNA MiniPrep Kits. cDNA was produced using SuperScript III (Invitrogen) and qRT-PCR assays were performed using TaqMan Gene Expression Master mix (Applied Biosystems) and iTaq Universal Sybr Green (Bio-Rad) using primers or Taqman assays listed in Table S7.
ChIP-PCR assay
Two million cells were fixed with 1% formaldehyde (Sigma-Aldrich) at room temperature for 10 minutes then quenched with 0.125 M glycine. After washing, cells were resuspended in ChIP lysis buffer (1% SDS, 10 mM EDTA and 50 mM Tris-HCl pH 8.1) and sonicated using 30 minutes, 65% power, 30 seconds on and 30 seconds off (Active Motif). The sonicated chromatin was diluted using ChIP dilution buffer (0.01% SDS, 1.1% Triton-X100, 1.2 mM EDTA, 167 mM NaCl and 16.7 mM Tris-HCl pH 8.1). An aliquot was removed for the input control, then anti-H3K4me3 (Abcam) or anti-H3 antibody was added and incubated overnight. Protein A and Protein G Dynabeads (10 µL each) were added and incubated for 2 hours at 4°C. Beads were then sequentially washed with low salt wash buffer (0.5% SDS, 1% Triton-X100, 2 mM EDTA, 150 mM NaCl and 20 mM Tris-HCl pH8.1), high salt wash buffer (0.5% SDS, 1% Triton-X100, 2 mM EDTA, 500 mM NaCl and 20 mM Tris-HCl pH 8.1), LiCl wash buffer (0.25 M LiCl, 1% IGEPAL-CH630, 1% deoxycholic acid, 1 mM EDTA and 10 mM Tris-HCl pH 8.1) and TE (1 mM EDTA and 10 mM Tris-HCl pH8.1). Washed beads were mixed with elution buffer (1% SDS, 0.1 M NaHCO3 and 2 M NaCl) and crosslinks were reversed by overnight incubation at 65°C. A final concentration of 0.4 µg/mL RNase A and 0.5 µg/mL Proteinase K were added sequentially. Genomic DNA was collected from the supernatant after bead separation, phenol/chloroform extraction, and ethanol precipitation with 50 µg glycogen. The concentration of genomic DNA was determined using the Qubit dsDNA HS Assay Kit. Genomic DNA was diluted to 0.05 ng/µL and 1 µL used for qRT-PCR. The relative enrichment of H3K4me3 or H3 was expressed as the fold-change over the input: 2 ^ [Ct (input) – Ct (ChIP)].
Rescue assay
In vitro transformed MLL-AF9 cells were transduced with retroviral supernatant produced from MSCV-puro based viruses encoding either Pigp or CD14-TM, or MSCV-IRES-hCD4 based viruses encoding integrin β-3, Magohb and IL3Rα, Bcl-xL or Bcl-2. Cells were either grown in 2.5 µg/mL puromycin or hCD4+ cells sorted and expanded for 3 weeks, then triplicate cultures were treated with 100 nM 4-OHT for 24 hours. The 4-OHT was then washed out and cells were allowed to grow an additional 2 days (for day 3 analyses) or 4 days (for day 5 analyses). Relative viability is shown for day 5 and represents cells that are PI negative normalized to ethanol-treated controls. Relative fold expansion represents live (PI negative) cell counts normalized to ethanol-treated controls.
CRISPR/Cas9 editing
LentiCas9-EGFP (Donated by Dr. Phil Sharp & Dr. Feng Zhang) and pCW-Cas9 (Donated by Dr. Eric Lander & Dr. David Sabatini) were purchased from Addgene. All Lenti-guided RNA (gRNA)-BFP vectors were purchased from the Functional Genomics Shared Resource at the University of Colorado Cancer Center. MOLM-14 cells were transduced with LentiCas9-EGFP and Lenti-gRNA-BFP viruses sequentially and GFP+/BFP+ cells were sorted on day 7 for expansion as pools and single clones. Isolation, subcloning and sequencing of edited genomic DNA was performed from samples on day 26. Human leukemia cell lines transduced with pCW-Cas9 were selected and maintained in culture medium with 2.5 ug/mL puromycin. Two days after transducing with gRNA lentivirus, cells were treated with 1 ug/mL doxycycline (except KASUMI-1 which was treated with 0.25 ug/mL doxycycline) to induce Cas9 expression. CD38 gRNA was used as the positive control and the targeted mutation of CD38 gene was detected through disappearance of surface CD38 by flow cytometry.
Western blot
The cleaved Caspase-3 western was performed by lysing cells in ELB buffer (250 mM NaCl, 0.1% NP40, 50 mM HEPES buffer pH 7, 5 mM EDTA, 1 mM PMSF and protease inhibitor). Human leukemia cells were lysed using Buffer H (20 mM HEPES pH7.9, 1.5 mM MgCl2, 10 mM KCl and protease inhibitor) and dounced using 1 mL syringes with 26G1/2 needles; nuclei were extracted with Buffer D (10 mM HEPES pH7.9, 1.5 mM MgCl2, 0.2 mM EDTA pH8.0, 0.42 M KCl, 20% glycerol and protease inhibitor). Histone was prepared by first lysing cells with Histone Lysis Buffer (0.5% Triton and 0.2 M HCl) and then extracted at 4°C overnight with 0.2 N HCl. All the western blot antibodies are listed in the Key Resource section.
QUANTIFICATION AND STATISTICAL ANALYSIS
Genomic studies
For the gene expression arrays shown in Figure 1K, LSC-enriched cells from recipients of MLL-AF9 cells with the genotype of Cre+;Mll1F/+ or Cre+;Mll1F/F were sorted 3 days after the second dose of TAM. RNA was prepared using RNeasy Mini kit and then labeled using the GeneChip 3’ IVT PLUS Reagent Kit. The labeled products were hybridized to mouse 430 2.0 Arrays at the Dartmouth Genomics and Microarray Laboratory. CEL files were normalized using the GCRMA method and differentially expressed genes were determined by ANOVA in R using unfiltered expression values with a fold change cutoff of 1.5 and p value of 0.05. For RNA-seq, RNA prepared as above was measured on an Agilent Bioanalyzer (Agilent Technologies). Illumina HiSeq libraries were prepared and sequenced by the Genomics and Microarray Core Facility at the University of Colorado Anschutz Medical Campus. Sequenced single-end reads were mapped to the mouse genome (mm10) by GSNAP, expression (FPKM) derived by Cufflinks2, and differential expression analyzed with ANOVA in R (Baird et al., 2014). GSEA was performed in GSEA v2.1.0 software with 1,000 data permutations and gene set as the permutation type using genes with a minimal average expression of 0.5 FPKM (Figure 6A, Figure 8A and Figure S5). All the customized gene sets were obtained by using the list in the original papers except the RelA-dependent gene set which was obtained by reanalyzing in GenePattern and selecting the top 200 in the wild-type compared to knockout with p<0.05. GO-term enrichment was performed with Ingenuity Pathway Analysis. Only pathways with Z scores >1 or Z scores < −1 are shown in Figure 5C. RNA-seq from Lavallée et al. was downloaded and normalized expression (FPKM) for MLL1 and MLL2 were plotted based on phenotypes.
Data analysis, statistics and imaging
Statistical analyses were performed using Prism 6 software. Student’s t tests were used and error bars reflect standard deviation unless otherwise indicated. Survival analysis used the Log-rank (Mantel-Cox) test. Drug synergy was analyzed with CompuSyn software. Microscope images were taken with an Olympus Inverted Phase contrast microscope (CKX41, 40× objective) and processed using ImageJ. Image intensity for figures was adjusted with Adobe Illustrator CC uniformly for all blots.
DATA AND SOFTWARE AVAILABILITY
The microarray and RNA-seq data reported in this article have been deposited at the NCBI Gene Expression Omnibus with the following accession codes GSE93621, GSE93622 and GSE93623.
Supplementary Material
Significance.
Chromosomal translocations disrupting the MLL1 gene produce oncogenes that confer poor prognosis in childhood and adult leukemia. Despite extensive studies, effective strategies for targeting MLL fusion proteins (MLL-FPs) have not yet reached clinical practice. Here we address the question of whether the non-rearranged MLL1 allele plays a role in MLL-rearranged leukemia and thus would be a rational therapeutic target. We find that deletion of endogenous Mll1 has no impact on MLL-FP-driven leukemogenesis. However, we discover an unexpected role for its closest paralog, Mll2. Mll2 deletion reduces the survival of MLL-AF9 leukemia and Mll1 deletion in this context exacerbates this effect and reduces leukemogenesis in vivo. These data support the concept that targeting MLL2 itself would be a valuable therapeutic strategy.
Highlights.
MLL1 is dispensable for MLL-fusion protein-initiated acute myeloid leukemia
MLL2 loss reduces the survival of MLL-AF9-transformed cells
Co-deletion of Mll1 and Mll2 reveals collaborative rather than redundant activities
Mll2 and Mll1 together promote three major AML survival pathways
Acknowledgments
We thank Eric Pietras, Shanshan Pei, Kathrin Bernt, Craig Jordan and our lab members for discussion and critical review. We are grateful to Bin E. Li who was instrumental in troubleshooting gene deletion methods early in the project. We thank Liz Austenaa, Giocchino Natoli, Mick Milsom, Scott Armstrong, Shanshan Pei, Michael Verneris, Ashley Yingst, Kathrin Bernt, Haobin Ye and Lucio Castilla for critical reagents and advice and Vincent Lavallée and Guy Sauvageau for help analyzing AML data. This work was supported by N.I.H. grant HL090036 to P.E., the German Research Foundation (WA2837, FOR2033-A03, TRR127-A5) and the Else Kröner Fresenius Foundation 2013/A262 to C.W., Deutsche Krebshilfe 110560 to A.F.S. and A.K., a J.S.P.S. KAKENNHI grant 16H05337 and funding from Dainippon Sumitomo Pharma to A.Y. We acknowledge the assistance of the Dartmouth Genomics Shared Resource and the support from N.C.I. Grant P30CA046934 to K.J. and the Genomics and Microarray Shared Resource of Colorado.
Footnotes
Publisher's Disclaimer: This is a PDF file of an unedited manuscript that has been accepted for publication. As a service to our customers we are providing this early version of the manuscript. The manuscript will undergo copyediting, typesetting, and review of the resulting proof before it is published in its final citable form. Please note that during the production process errors may be discovered which could affect the content, and all legal disclaimers that apply to the journal pertain.
Conflicts of Interest
T.N. is a current employee of Janssen and P.E. owns Amgen stock.
Author Contributions
Y.C. and P.E. designed and Y.C. conducted most experiments. K.A., A.K. and A.F.S generated essential animal models. A.Y. contributed key reagents. P.E., K.A., C.W. and Y.L. performed some experiments. K.J., T.N. and Y.C. performed bioinformatic analyses. P.E., C.W. and A.F.S. obtained funding for this work. Y.C. and P.E. wrote the paper with input from all authors.
References
- Agger K, Miyagi S, Pedersen MT, Kooistra SM, Johansen JV, Helin K. Jmjd2/Kdm4 demethylases are required for expression of Il3ra and survival of acute myeloid leukemia cells. Genes Dev. 2016;30:1278–1288. doi: 10.1101/gad.280495.116. [DOI] [PMC free article] [PubMed] [Google Scholar]
- Allis CD, Berger SL, Cote J, Dent S, Jenuwien T, Kouzarides T, Pillus L, Reinberg D, Shi Y, Shiekhattar R, et al. New nomenclature for chromatin-modifying enzymes. Cell. 2007;131:633–636. doi: 10.1016/j.cell.2007.10.039. [DOI] [PubMed] [Google Scholar]
- Andreu-Vieyra CV, Chen R, Agno JE, Glaser S, Anastassiadis K, Stewart AF, Matzuk MM. MLL2 is required in oocytes for bulk histone 3 lysine 4 trimethylation and transcriptional silencing. PLoS Biol. 2010;8 doi: 10.1371/journal.pbio.1000453. [DOI] [PMC free article] [PubMed] [Google Scholar]
- Artinger EL, Mishra BP, Zaffuto KM, Li BE, Chung EK, Moore AW, Chen Y, Cheng C, Ernst P. An MLL-dependent network sustains hematopoiesis. Proc Natl Acad Sci U S A. 2013;110:12000–12005. doi: 10.1073/pnas.1301278110. [DOI] [PMC free article] [PubMed] [Google Scholar]
- Austenaa L, Barozzi I, Chronowska A, Termanini A, Ostuni R, Prosperini E, Stewart AF, Testa G, Natoli G. The histone methyltransferase Wbp7 controls macrophage function through GPI glycolipid anchor synthesis. Immunity. 2012;36:572–585. doi: 10.1016/j.immuni.2012.02.016. [DOI] [PubMed] [Google Scholar]
- Ayton P, Sneddon SF, Palmer DB, Rosewell IR, Owen MJ, Young B, Presley R, Subramanian V. Truncation of the Mll gene in exon 5 by gene targeting leads to early preimplantation lethality of homozygous embryos. Genesis. 2001;30:201–212. doi: 10.1002/gene.1066. [DOI] [PubMed] [Google Scholar]
- Baird NL, Bowlin JL, Cohrs RJ, Gilden D, Jones KL. Comparison of varicella-zoster virus RNA sequences in human neurons and fibroblasts. J Virol. 2014;88:5877–5880. doi: 10.1128/JVI.00476-14. [DOI] [PMC free article] [PubMed] [Google Scholar]
- Bernt KM, Zhu N, Sinha AU, Vempati S, Faber J, Krivtsov AV, Feng Z, Punt N, Daigle A, Bullinger L, et al. MLL-rearranged leukemia is dependent on aberrant H3K79 methylation by DOT1L. Cancer Cell. 2011;20:66–78. doi: 10.1016/j.ccr.2011.06.010. [DOI] [PMC free article] [PubMed] [Google Scholar]
- Bitoun E, Oliver PL, Davies KE. The mixed-lineage leukemia fusion partner AF4 stimulates RNA polymerase II transcriptional elongation and mediates coordinated chromatin remodeling. Hum Mol Genet. 2007;16:92–106. doi: 10.1093/hmg/ddl444. [DOI] [PubMed] [Google Scholar]
- Borkin D, He S, Miao H, Kempinska K, Pollock J, Chase J, Purohit T, Malik B, Zhao T, Wang J, et al. Pharmacologic inhibition of the Menin-MLL interaction blocks progression of MLL leukemia in vivo. Cancer Cell. 2015;27:589–602. doi: 10.1016/j.ccell.2015.02.016. [DOI] [PMC free article] [PubMed] [Google Scholar]
- Briggs SD, Bryk M, Strahl BD, Cheung WL, Davie JK, Dent SY, Winston F, Allis CD. Histone H3 lysine 4 methylation is mediated by Set1 and required for cell growth and rDNA silencing in Saccharomyces cerevisiae. Genes Dev. 2001;15:3286–3295. doi: 10.1101/gad.940201. [DOI] [PMC free article] [PubMed] [Google Scholar]
- Cao F, Townsend EC, Karatas H, Xu J, Li L, Lee S, Liu L, Chen Y, Ouillette P, Zhu J, et al. Targeting MLL1 H3K4 Methyltransferase Activity in Mixed-Lineage Leukemia. Mol Cell. 2014;53:247–261. doi: 10.1016/j.molcel.2013.12.001. [DOI] [PMC free article] [PubMed] [Google Scholar]
- Caslini C, Yang Z, El-Osta M, Milne TA, Slany RK, Hess JL. Interaction of MLL amino terminal sequences with menin is required for transformation. Cancer Res. 2007;67:7275–7283. doi: 10.1158/0008-5472.CAN-06-2369. [DOI] [PMC free article] [PubMed] [Google Scholar]
- Denissov S, Hofemeister H, Marks H, Kranz A, Ciotta G, Singh S, Anastassiadis K, Stunnenberg HG, Stewart AF. Mll2 is required for H3K4 trimethylation on bivalent promoters in embryonic stem cells, whereas Mll1 is redundant. Development. 2014;141:526–537. doi: 10.1242/dev.102681. [DOI] [PubMed] [Google Scholar]
- Dou Y, Milne TA, Ruthenburg AJ, Lee S, Lee JW, Verdine GL, Allis CD, Roeder RG. Regulation of MLL1 H3K4 methyltransferase activity by its core components. Nat Struct Mol Biol. 2006;13:713–719. doi: 10.1038/nsmb1128. [DOI] [PubMed] [Google Scholar]
- Ernst P, Fisher JK, Avery W, Wade S, Foy D, Korsmeyer SJ. Definitive hematopoiesis requires the mixed-lineage leukemia gene. Dev Cell. 2004;6:437–443. doi: 10.1016/s1534-5807(04)00061-9. [DOI] [PubMed] [Google Scholar]
- Ferguson MAJ, Kinoshita T, Hart GW. Glycosylphosphatidylinositol Anchors. In: Ajit Varki RDC, Esko Jeffrey D, Freeze Hudson H, Stanley Pamela, Bertozzi Carolyn R, Hart Gerald W, Etzler Marilynn E, editors. Essentials of Glycobiology. Cold Spring Harbor, NY: Cold Spring Harbor Press; 2009. [PubMed] [Google Scholar]
- Gan T, Jude CD, Zaffuto K, Ernst P. Developmentally induced Mll1 loss reveals defects in postnatal haematopoiesis. Leukemia. 2010;24:1732–1741. doi: 10.1038/leu.2010.171. [DOI] [PMC free article] [PubMed] [Google Scholar]
- Glaser S, Lubitz S, Loveland KL, Ohbo K, Robb L, Schwenk F, Seibler J, Roellig D, Kranz A, Anastassiadis K, Stewart AF. The histone 3 lysine 4 methyltransferase, Mll2, is only required briefly in development and spermatogenesis. Epigenetics Chromatin. 2009;2:5. doi: 10.1186/1756-8935-2-5. [DOI] [PMC free article] [PubMed] [Google Scholar]
- Glaser S, Schaft J, Lubitz S, Vintersten K, van der Hoeven F, Tufteland KR, Aasland R, Anastassiadis K, Ang SL, Stewart AF. Multiple epigenetic maintenance factors implicated by the loss of Mll2 in mouse development. Development. 2006;133:1423–1432. doi: 10.1242/dev.02302. [DOI] [PubMed] [Google Scholar]
- Goo YH, Sohn YC, Kim DH, Kim SW, Kang MJ, Jung DJ, Kwak E, Barlev NA, Berger SL, Chow VT, et al. Activating signal cointegrator 2 belongs to a novel steady-state complex that contains a subset of trithorax group proteins. Mol Cell Biol. 2003;23:140–149. doi: 10.1128/MCB.23.1.140-149.2003. [DOI] [PMC free article] [PubMed] [Google Scholar]
- Gu B, Lee MG. Histone H3 lysine 4 methyltransferases and demethylases in self-renewal and differentiation of stem cells. Cell Biosci. 2013;3:39. doi: 10.1186/2045-3701-3-39. [DOI] [PMC free article] [PubMed] [Google Scholar]
- Guzman ML, Neering SJ, Upchurch D, Grimes B, Howard DS, Rizzieri DA, Luger SM, Jordan CT. Nuclear factor-kappaB is constitutively activated in primitive human acute myelogenous leukemia cells. Blood. 2001;98:2301–2307. doi: 10.1182/blood.v98.8.2301. [DOI] [PubMed] [Google Scholar]
- Herz HM, Garruss A, Shilatifard A. SET for life: biochemical activities and biological functions of SET domain-containing proteins. Trends Biochem Sci. 2013;38:621–639. doi: 10.1016/j.tibs.2013.09.004. [DOI] [PMC free article] [PubMed] [Google Scholar]
- Huang Y, Sitwala K, Bronstein J, Sanders D, Dandekar M, Collins C, Robertson G, MacDonald J, Cezard T, Bilenky M, et al. Identification and characterization of Hoxa9 binding sites in hematopoietic cells. Blood. 2012;119:388–398. doi: 10.1182/blood-2011-03-341081. [DOI] [PMC free article] [PubMed] [Google Scholar]
- Hughes CM, Rozenblatt-Rosen O, Milne TA, Copeland TD, Levine SS, Lee JC, Hayes DN, Shanmugam KS, Bhattacharjee A, Biondi CA, et al. Menin associates with a trithorax family histone methyltransferase complex and with the hoxc8 locus. Mol Cell. 2004;13:587–597. doi: 10.1016/s1097-2765(04)00081-4. [DOI] [PubMed] [Google Scholar]
- Jordan CT, Upchurch D, Szilvassy SJ, Guzman ML, Howard DS, Pettigrew AL, Meyerrose T, Rossi R, Grimes B, Rizzieri DA, et al. The interleukin-3 receptor alpha chain is a unique marker for human acute myelogenous leukemia stem cells. Leukemia. 2000;14:1777–1784. doi: 10.1038/sj.leu.2401903. [DOI] [PubMed] [Google Scholar]
- Jude CD, Climer L, Xu D, Artinger E, Fisher JK, Ernst P. Unique and Independent Roles for MLL in Adult Hematopoietic Stem Cells and Progenitors. Cell Stem Cell. 2007;1:324–337. doi: 10.1016/j.stem.2007.05.019. [DOI] [PMC free article] [PubMed] [Google Scholar]
- Kagoya Y, Yoshimi A, Kataoka K, Nakagawa M, Kumano K, Arai S, Kobayashi H, Saito T, Iwakura Y, Kurokawa M. Positive feedback between NF-kappaB and TNF-alpha promotes leukemia-initiating cell capacity. J Clin Invest. 2014;124:528–542. doi: 10.1172/JCI68101. [DOI] [PMC free article] [PubMed] [Google Scholar]
- Krivtsov AV, Twomey D, Feng Z, Stubbs MC, Wang Y, Faber J, Levine JE, Wang J, Hahn WC, Gilliland DG, et al. Transformation from committed progenitor to leukaemia stem cell initiated by MLL-AF9. Nature. 2006;442:818–822. doi: 10.1038/nature04980. [DOI] [PubMed] [Google Scholar]
- Kuo HP, Wang Z, Lee DF, Iwasaki M, Duque-Afonso J, Wong SH, Lin CH, Figueroa ME, Su J, Lemischka IR, Cleary ML. Epigenetic roles of MLL oncoproteins are dependent on NF-kappaB. Cancer Cell. 2013;24:423–437. doi: 10.1016/j.ccr.2013.08.019. [DOI] [PMC free article] [PubMed] [Google Scholar]
- Ladopoulos V, Hofemeister H, Hoogenkamp M, Riggs AD, Stewart AF, Bonifer C. The histone methyltransferase KMT2B is required for RNA polymerase II association and protection from DNA methylation at the MagohB CpG island promoter. Mol Cell Biol. 2013;33:1383–1393. doi: 10.1128/MCB.01721-12. [DOI] [PMC free article] [PubMed] [Google Scholar]
- Li Y, Choi PS, Casey SC, Felsher DW. Activation of Cre recombinase alone can induce complete tumor regression. PLoS One. 2014;9:e107589. doi: 10.1371/journal.pone.0107589. [DOI] [PMC free article] [PubMed] [Google Scholar]
- Liu K, Zhu M, Huang Y, Wei S, Xie J, Xiao Y. CD123 and its potential clinical application in leukemias. Life Sci. 2015;122:59–64. doi: 10.1016/j.lfs.2014.10.013. [DOI] [PubMed] [Google Scholar]
- McMahon KA, Hiew SY, Hadjur S, Veiga-Fernandes H, Menzel U, Price AJ, Kioussis D, Williams O, Brady HJ. Mll has a critical role in fetal and adult hematopoietic stem cell self-renewal. Cell Stem Cell. 2007;1:338–345. doi: 10.1016/j.stem.2007.07.002. [DOI] [PubMed] [Google Scholar]
- Miller PG, Al-Shahrour F, Hartwell KA, Chu LP, Jaras M, Puram RV, Puissant A, Callahan KP, Ashton J, McConkey ME, et al. In Vivo RNAi screening identifies a leukemia-specific dependence on integrin beta 3 signaling. Cancer Cell. 2013;24:45–58. doi: 10.1016/j.ccr.2013.05.004. [DOI] [PMC free article] [PubMed] [Google Scholar]
- Milne TA, Kim J, Wang GG, Stadler SC, Basrur V, Whitcomb SJ, Wang Z, Ruthenburg AJ, Elenitoba-Johnson KS, Roeder RG, Allis CD. Multiple interactions recruit MLL1 and MLL1 fusion proteins to the HOXA9 locus in leukemogenesis. Mol Cell. 2010;38:853–863. doi: 10.1016/j.molcel.2010.05.011. [DOI] [PMC free article] [PubMed] [Google Scholar]
- Mishra BP, Zaffuto KM, Artinger EL, Org T, Mikkola HK, Cheng C, Djabali M, Ernst P. The histone methyltransferase activity of MLL1 is dispensable for hematopoiesis and leukemogenesis. Cell Rep. 2014;7:1239–1247. doi: 10.1016/j.celrep.2014.04.015. [DOI] [PMC free article] [PubMed] [Google Scholar]
- Muntean AG, Hess JL. The pathogenesis of mixed-lineage leukemia. Annu Rev Pathol. 2012;7:283–301. doi: 10.1146/annurev-pathol-011811-132434. [DOI] [PMC free article] [PubMed] [Google Scholar]
- Nislow C, Ray E, Pillus L. SET1, a yeast member of the trithorax family, functions in transcriptional silencing and diverse cellular processes. Mol Biol Cell. 1997;8:2421–2436. doi: 10.1091/mbc.8.12.2421. [DOI] [PMC free article] [PubMed] [Google Scholar]
- Ohyashiki K, Ohyashiki JH, Sandberg AA. Cytogenetic characterization of putative human myeloblastic leukemia cell lines (ML-1, -2, and -3): origin of the cells. Cancer Res. 1986;46:3642–3647. [PubMed] [Google Scholar]
- Okada Y, Feng Q, Lin Y, Jiang Q, Li Y, Coffield VM, Su L, Xu G, Zhang Y. hDOT1L links histone methylation to leukemogenesis. Cell. 2005;121:167–178. doi: 10.1016/j.cell.2005.02.020. [DOI] [PubMed] [Google Scholar]
- Riedel SS, Haladyna JN, Bezzant M, Stevens B, Pollyea DA, Sinha AU, Armstrong SA, Wei Q, Pollock RM, Daigle SR, et al. MLL1 and DOT1L cooperate with meningioma-1 to induce acute myeloid leukemia. J Clin Invest. 2016;126:1438–1450. doi: 10.1172/JCI80825. [DOI] [PMC free article] [PubMed] [Google Scholar]
- Roguev A, Schaft D, Shevchenko A, Pijnappel WW, Wilm M, Aasland R, Stewart AF. The Saccharomyces cerevisiae Set1 complex includes an Ash2 homologue and methylates histone 3 lysine 4. EMBO J. 2001;20:7137–7148. doi: 10.1093/emboj/20.24.7137. [DOI] [PMC free article] [PubMed] [Google Scholar]
- Shi J, Wang E, Milazzo JP, Wang Z, Kinney JB, Vakoc CR. Discovery of cancer drug targets by CRISPR-Cas9 screening of protein domains. Nat Biotechnol. 2015;33:661–667. doi: 10.1038/nbt.3235. [DOI] [PMC free article] [PubMed] [Google Scholar]
- Shinsky SA, Monteith KE, Viggiano S, Cosgrove MS. Biochemical reconstitution and phylogenetic comparison of human SET1 family core complexes involved in histone methylation. J Biol Chem. 2015;290:6361–6375. doi: 10.1074/jbc.M114.627646. [DOI] [PMC free article] [PubMed] [Google Scholar]
- Slany RK. The molecular mechanics of mixed lineage leukemia. Oncogene. 2016 doi: 10.1038/onc.2016.30. [DOI] [PubMed] [Google Scholar]
- Somervaille TC, Cleary ML. Identification and characterization of leukemia stem cells in murine MLL-AF9 acute myeloid leukemia. Cancer Cell. 2006;10:257–268. doi: 10.1016/j.ccr.2006.08.020. [DOI] [PubMed] [Google Scholar]
- Tang G, Lu X, Wang SA, Roney EK, Zhang L, Hu S, Lu G, Medeiros LJ, Patel A. Homozygous inv(11)(q21q23) and MLL gene rearrangement in two patients with myeloid neoplasms. International journal of clinical and experimental pathology. 2014;7:3196–3201. [PMC free article] [PubMed] [Google Scholar]
- Thiel AT, Blessington P, Zou T, Feather D, Wu X, Yan J, Zhang H, Liu Z, Ernst P, Koretzky GA, Hua X. MLL-AF9-induced leukemogenesis requires coexpression of the wild-type Mll allele. Cancer Cell. 2010;17:148–159. doi: 10.1016/j.ccr.2009.12.034. [DOI] [PMC free article] [PubMed] [Google Scholar]
- Wu M, Wang PF, Lee JS, Martin-Brown S, Florens L, Washburn M, Shilatifard A. Molecular regulation of H3K4 trimethylation by Wdr82, a component of human Set1/COMPASS. Mol Cell Biol. 2008;28:7337–7344. doi: 10.1128/MCB.00976-08. [DOI] [PMC free article] [PubMed] [Google Scholar]
- Xu H, Valerio DG, Eisold ME, Sinha A, Koche RP, Hu W, Chen C-W, Chu SH, Brien GL, Hsieh JJ, et al. NUP98-Fusion Proteins Interact With the NSL and MLL1 Complexes To Drive Leukemogenesis. Cancer Cell. 2016;30 doi: 10.1016/j.ccell.2016.10.019. [DOI] [PMC free article] [PubMed] [Google Scholar]
- Xue L, Pulikkan JA, Valk PJ, Castilla LH. NrasG12D oncoprotein inhibits apoptosis of preleukemic cells expressing Cbfbeta-SMMHC via activation of MEK/ERK axis. Blood. 2014;124:426–436. doi: 10.1182/blood-2013-12-541730. [DOI] [PMC free article] [PubMed] [Google Scholar]
- Yagi H, Deguchi K, Aono A, Tani Y, Kishimoto T, Komori T. Growth disturbance in fetal liver hematopoiesis of Mll-mutant mice. Blood. 1998;92:108–117. [PubMed] [Google Scholar]
- Ye H, Adane B, Khan N, Sullivan T, Minhajuddin M, Gasparetto M, Stevens B, Pei S, Balys M, Ashton JM, et al. Leukemic Stem Cells Evade Chemotherapy by Metabolic Adaptation to an Adipose Tissue Niche. Cell Stem Cell. 2016;19:23–37. doi: 10.1016/j.stem.2016.06.001. [DOI] [PMC free article] [PubMed] [Google Scholar]
- Yokoyama A, Lin M, Naresh A, Kitabayashi I, Cleary ML. A higher-order complex containing AF4 and ENL family proteins with P-TEFb facilitates oncogenic and physiologic MLL-dependent transcription. Cancer Cell. 2010;17:198–212. doi: 10.1016/j.ccr.2009.12.040. [DOI] [PMC free article] [PubMed] [Google Scholar]
- Yokoyama A, Somervaille TC, Smith KS, Rozenblatt-Rosen O, Meyerson M, Cleary ML. The menin tumor suppressor protein is an essential oncogenic cofactor for MLL-associated leukemogenesis. Cell. 2005;123:207–218. doi: 10.1016/j.cell.2005.09.025. [DOI] [PubMed] [Google Scholar]
- Yokoyama A, Wang Z, Wysocka J, Sanyal M, Aufiero DJ, Kitabayashi I, Herr W, Cleary ML. Leukemia proto-oncoprotein MLL forms a SET1-like histone methyltransferase complex with menin to regulate Hox gene expression. Mol Cell Biol. 2004;24:5639–5649. doi: 10.1128/MCB.24.13.5639-5649.2004. [DOI] [PMC free article] [PubMed] [Google Scholar]
- Yu BD, Hess JL, Horning SE, Brown GA, Korsmeyer SJ. Altered Hox expression and segmental identity in Mll-mutant mice. Nature. 1995;378:505–508. doi: 10.1038/378505a0. [DOI] [PubMed] [Google Scholar]
- Zhu J, Nguyen MT, Nakamura E, Yang J, Mackem S. Cre-mediated recombination can induce apoptosis in vivo by activating the p53 DNA damage-induced pathway. Genesis. 2012;50:102–111. doi: 10.1002/dvg.20799. [DOI] [PMC free article] [PubMed] [Google Scholar]
- Zhu L, Li Q, Wong SH, Huang M, Klein BJ, Shen J, Ikenouye L, Onishi M, Schneidawind D, Buechele C, et al. ASH1L Links Histone H3 Lysine 36 Dimethylation to MLL Leukemia. Cancer Discov. 2016;6:770–783. doi: 10.1158/2159-8290.CD-16-0058. [DOI] [PMC free article] [PubMed] [Google Scholar]
- Zuber J, Rappaport AR, Luo W, Wang E, Chen C, Vaseva AV, Shi J, Weissmueller S, Fellmann C, Taylor MJ, et al. An integrated approach to dissecting oncogene addiction implicates a Myb-coordinated self-renewal program as essential for leukemia maintenance. Genes Dev. 2011;25:1628–1640. doi: 10.1101/gad.17269211. [DOI] [PMC free article] [PubMed] [Google Scholar]
Associated Data
This section collects any data citations, data availability statements, or supplementary materials included in this article.