

Abstract
Background
Epicardial adipose tissue (EAT) is recognized as a useful indicator for type 2 diabetes mellitus (T2DM) and obesity. However, studies on the association between vitamin D status and EAT thickness in type 2 diabetes (T2D) are limited. In this study, we aimed to evaluate the association of vitamin D (Calcifediol) status and EAT thickness (EATT) in Chinese non-obese patients with T2D.
Material/Methods
A cross-sectional study was performed among 167 non-obese T2D Chinese patients and 82 non-diabetic patients, who are age- and gender-matched during the winter months. EATT was evaluated by two-dimensional transthoracic echocardiography. Serum 25-hydroxyvitamin D [25(OH)D, Calcifediol] was examined in the diabetic patients and in the control group.
Results
The concentration of 25(OH)D was 32.00 nmol/l (19.30–53.70 nmol/l) among diabetic patients. Most (93.4%) of the diabetic patients had hypovitaminosis D. We confirmed a clear negative association between 25(OH)D level and EATT in non-obese T2D patients (p=0.01). EATT was significantly correlated with 25(OH)D level (p=0.001) and HOMA-IR (p=0.001). Results of multivariate logistic regression analysis demonstrated increased EATT, which was remarkably associated with 25(OH)D levels (p=0.039), systolic blood pressure (SBP) (p=0.013), HOMA-IR (p=0.030), and waist circumference (p<0.001) in T2D patients after adjusting for the confounding factors.
Conclusions
Increased EATT was found in Chinese non-obese T2D patients. 25(OH)D and HOMA-IR were independently associated with increased EATT after adjusting for multiple confounders.
MeSH Keywords: Adipose Tissue; Calcifediol; Diabetes Mellitus, Type 2
Background
The worldwide increase in the prevalence of type 2 diabetes mellitus (T2DM) has overloaded health-care systems in recent years [1]. Cardiovascular complications are the major cause of morbidity, mortality, and disability in the diabetic population. Overweight and obesity are prevalent in high-risk cardiovascular patients with T2DM [2]. It was reported that metabolically unhealthy normal weight (MUNW) individuals, in spite of their significantly lower BMI, have a cardiometabolic risk profile similar to that of metabolically healthy obese (MUO) individuals [3]. Moreover, growing evidence suggests that differentiating the distribution of excess fat is an important determinant of cardiovascular risk [4].
White adipose tissue (WAT), which stores energy, is separated into 2 primary fat depots: visceral fat and subcutaneous fat. The former plays a dominant role in the development of insulin resistance and inflammation, and confers a much higher risk than the latter. Epicardial adipose tissue (EAT) is defined as the visceral adipose tissue of the heart that is situated between the myocardium and visceral pericardium, and shares the coronary blood supply [5]. Furthermore, EAT is actively involved in the lipid and energy homeostasis, with a greater capacity for release and uptake of free fatty acids and a low rate of glucose utilization [6]. Owing to its unique anatomical and metabolic features, EAT is an important substitute indicator in the development and progression of cardiovascular disease, and is independent of traditional cardiometabolic risk factors [7].
Vitamin D is a crucial steroid hormone that is necessary for calcium, phosphorus, and bone metabolism, as well as muscle strength [8]. In the past 2 decades, vitamin D has been shown to have protective effects on non-musculoskeletal disorders such as autoimmune diseases, cancer, metabolic disease, and cardiovascular diseases [9]. Increasing attention should be paid to the potential role of vitamin D in inhibiting adipogenic transcription factors and preventing excess lipid accumulation, adipocyte hypertrophy, and subsequent inflammation [10,11]. Several clinical studies have shown that the EAT thickness (EATT) was inversely correlated with 25-hydroxyvitamin D [25(OH)D, Calcifediol] level, which is considered the best marker for whole-body vitamin D status [12,13]. However, it remains unclear whether circulating 25(OH)D levels are correlated with EATT in normal-weight type 2 diabetes (T2D) patients.
Therefore, we evaluated 25(OH)D level and EATT in a representative sample of normal-weight patients with T2DM and assessed the correlation between serum 25(OH)D concentration and EATT by two-dimensional transthoracic echocardiography.
Material and Methods
Subjects
A cross-sectional study was conducted among Chinese individuals in Wenzhou (latitude 28° north), a southeastern coastal city of China. A total of 167 non-obese (BMI ≤25 kg/m2) type 2 diabetic patients who consecutively attended our clinic during the winter months (November-March) were included in this study. We used the following exclusion criteria: (1) acute illness (diabetic ketoacidosis, diabetic hyperosmolar coma, and lactic acidosis), (2) advanced chronic liver or renal disease, (3) taking any medications known to affect vitamin D metabolism, and (4) abnormal thyroid or parathyroid hormone levels. Eighty-two non-diabetic volunteers who were matched for age and gender were recruited in the control group. Informed consent was obtained from each participant. The research followed the principles of the Declaration of Helsinki and was approved by the Sciences Ethics Committee of the First Affiliated Hospital of Wenzhou Medical University.
Physical and laboratory measurements
All the patients were evaluated using the following criteria: interviewed for medical histories, current medications, measurements of body mass index (BMI), waist circumference (WC) calculated by dividing weight in kilograms by height in meters squared, waist-hip ratio (WHR) calculated as waist measurement divided by hip measurement and also determined their resting blood pressure [systolic blood pressure (SBP) and diastolic blood pressure (DBP)]. After overnight fasting, venous blood was drawn and placed into tubes that were protected from sunlight. Plasma was separated and stored at −70°C within 30 min of collection. Laboratory assays were performed, which included fasting blood glucose (FBG), hemoglobin A1c (HbA1c), fasting insulin, total cholesterol (TCH), triglycerides (TG), high-density lipoprotein cholesterol (HDL-c), low-density lipoprotein cholesterol (LDL-c), blood uric acid (BUA), serum creatinine (SCr), and 25(OH)D. Serum 25(OH)D is the best marker of whole-body vitamin D status (14). Thus, 25(OH)D was measured using electrochemiluminescence immunoassay (Modular analytics E170, Roche Diagnosis). Vitamin D nutritional status was assessed as “sufficient” (≥75 nmol/l), “insufficient” [50 ≤25(OH)D <75 nmol/l], “deficient” [25 ≤25(OH)D <50 nmol/l] or “severely deficient” (≤25 nmol/l) [1]. Vitamin D intoxication occurs when serum levels of 25(OH)D are greater than 150 ng/ml (374 nmol/l) [14].
Measurement of echocardiographic epicardial adipose tissue
Two-dimensional transthoracic echocardiography was performed. Recording of 3 cycles of the two-dimensional parasternal long axis was performed. We enlarged each view for better visualization and accurate measurement of EATT. The measurement of EATT was done offline through the DICOM system and performed on the free wall of the right ventricle in the still image of a 2-D echocardiogram at the end of diastole on the parasternal long axis (Figure 1). We measured the thickest point of EAT in each cycle. The average value of the EATT was calculated.
Figure 1.
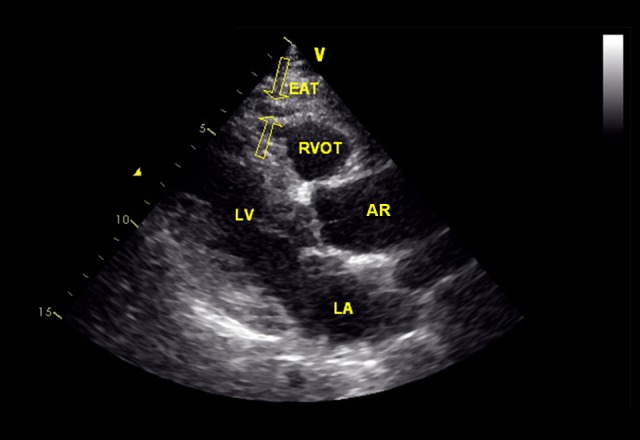
Measurement of epicardial adipose tissue (EAT) thickness by two-dimensional transthoracic echocardiography. Two opposite hollow arrows in this representative image point to EAT. RVOT – right ventricular outflow tract; LV – left ventricular; AR – aortic root; LA – left atrium.
Definition of diabetes, hypertension, and dyslipidemia
Diabetes was defined according to the American Diabetes Association criteria [15]. The homeostasis model assessment of insulin resistance (HOMA-IR) (mIU·mmol/l2)=fasting insulin (mIU/l)×fasting glucose (mmol/l)/22.5 [16]. Subjects were diagnosed with hypertension if their blood pressure was ≥140/≥90 mmHg or use of antihypertensive agents as recommended by the Joint National Committee (JNC) 8 [18]. Dyslipidemia was diagnosed according to the 2004 update of National Cholesterol Education Program guidelines [19].
Statistical analyses
Data are reported as mean ±SD for continuous variables and categorical variables percentages. Because of skewness and kurtosis of the distributions, TG, HDL-c, 25(OH)D, EATT, and HOMA-IR were described by median values with interquartile ranges (25th to 75th). Univariate analyses included one-way ANOVA, Kruskal-Wallis test, and χ2 test. Associations between the parameters were assessed by spearman correlation analysis. Multivariate linear regression analysis was used for multivariate analysis. P values <0.05 were considered to be statistically significant. Statistical evaluation was performed by using SPSS software version 13.0.
Results
Characteristics of the Study Population
A total of 167 patients who fulfilled the eligibility criteria were recruited in this study (mean age 43.67±10.86 years, 48.5% male), while volunteers were recruited as normal controls (mean age 42.44±10.21 years, 45.1% male). Table 1 displays the baseline characteristics of the participants. T2D patients demonstrated remarkably higher BMI (p=0.042), WC (p<0.001), WHR (p=0.044), SBP (p<0.001), DBP (p<0.001), FBG (p<0.001), fasting insulin (p=0.004), HOMA-IR (p<0.001), TCH (p=0.019), TG (p<0.001), LDL-c (p=0.046), HDL-c (p<0.001), BUA (p=0.011), 25(OH)D (p=0.190), and EATT (p<0.001), compared to the control group. There were no significant differences observed between the groups for age (p=0.394), gender (p=0.686) and SCr (p=0.682).
Table 1.
Clinical and biochemical characteristics of patients in the study.
| Diabetes | Control | p value | |
|---|---|---|---|
| N | 167 | 82 | |
| Age (years) | 43.66±10.86 | 42.44±10.21 | 0.394 |
| Gender (male/female) | 81/86 (48.50%) | 37/45 (45.10%) | 0.686 |
| BMI (kg/m2) | 22.58±2.16 | 21.99±2.13 | 0.042* |
| WC(cm) | 85.28±7.61 | 81.65±6.79 | <0.001*** |
| WHR (%) | 0.92±0.07 | 0.90±0.06 | 0.044* |
| SBP (mmHg) | 143.38±18.67 | 118.07±14.01 | <0.001*** |
| DBP (mmHg) | 82.34±10.36 | 73.32±11.03 | <0.001*** |
| Fasting glucose (mmol/l) | 7.29±2.14 | 4.98±0.85 | <0.001*** |
| Fasting insulin (mIU/l) | 77.68±40.39 | 62.15±37.00 | 0.004** |
| HOMA-IR | 2.94 (1.99–4.46) | 1.77 (1.08–2.52) | <0.001*** |
| TCH (mmol/l) | 4.87±1.01 | 4.54±1.02 | 0.019* |
| TG (mmol/l) | 1.7 (1.17–2.44) | 1.31 (0.80–1.91) | <0.001*** |
| HDL-c (mmol/l) | 1.10 (0.92–1.39) | 1.30 (1.13–1.50) | <0.001*** |
| LDL-c (mmol/l) | 3.09±0.91 | 2.86±0.72 | 0.046* |
| BUA (μmol/l) | 326.14±99.29 | 292.50±95.15 | 0.011* |
| SCr (μmol/l) | 58.99±15.61 | 58.03±15.77 | 0.682 |
| 25(OH)D (nmol/l) | 32.00 (19.30–53.70) | 39.2 (28.08–52.13) | 0.020* |
| EATT (mm) | 4.00 (3.00–5.00) | 2.00 (1.00–3.00) | <0.001*** |
BMI – body mass index; WC – waist circumference; WHR – waist-hip ratio; SBP – systolic blood pressure; DBP – diastolic blood pressure; HOMA-IR – homeostasis model assessment of insulin resistance; TCH – total cholesterol; TG – triglycerides; HDL-c – high-density lipoprotein cholesterol; LDL-c – low-density lipoprotein cholesterol; BUA – blood uric acid; SCr – serum creatinine; 25(OH)D – 25-hydroxyvitamin D; EATT – epicardial adipose tissue thickness. Continuous variables are presented as the mean value ±SD or median values with interquartile ranges (25th to 75th), while categorical variable is presented as percentages.
p<0.05;
p<0.01;
p<0.001.
For all 167 diabetic participants, the median of 25(OH)D was 32.00 nmol/l (range: 19.30–53.70 nmol/l). In diabetic patients, the percentages of vitamin D severe deficiency, deficiency, insufficiency, and sufficiency were 37.7%, 34.1%, 21.6%, and 6.6%, respectively. No patients had a concentration of greater than 374 nmol/l for 25(OH)D.
Demographic, clinical, and biochemical characteristics of diabetic patients classified according to plasma 25(OH)D level
After classification into 4 categories according to 25(OH)D levels, the anthropometric parameters such as WC (p=0.003), fasting insulin (p=0.006), BUA (p=0.031) as well as EATT (p=0.006) were significantly different among the 4 groups. There was no association between 25(OH)D and BMI (p=0.129), SBP (p=0.606), DBP (p=0.465), HbA1c (p=0.619), HOMA-IR (p=0.135), TCH (p=0.267), TG (p=0.447), LDL-c (p=0.974), and HDL-c (p=0.830) (Table 2).
Table 2.
Anthropometric and biochemical characteristics of the patients according to vitamin D nutritional status in non-obese patients of type 2 diabetes.
| Nutritional status of Vitamin D | p value | ||||
|---|---|---|---|---|---|
| 25(OH)D ≤25 nmol/l | 25(OH)D 25–50 nmol/l | 25(OH)D 50–75 nmol/l | 25(OH)D ≥75 nmol/l | ||
| Number | 63 | 57 | 36 | 11 | |
| Age (years) | 40.73±10.60 | 45.19±8.63 | 45.97±11.83 | 45.00±16.30 | 0.056 |
| BMI (kg/m2) | 22.94±2.42 | 22.56±1.93 | 22.34±2.01 | 21.36±1.84 | 0.129 |
| WC(cm) | 87.94±7.06 | 84.40±8.28 | 82.94±6.17 | 82.27±7.56 | 0.003** |
| WHR | 0.93±0.07 | 0.92±0.08 | 0.91±0.08 | 0.90±0.04 | 0.401 |
| SBP (mmHg) | 145.43±19.22 | 143.25±19.62 | 141.44±17.42 | 138.64±14.60 | 0.606 |
| DBP (mmHg) | 83.24±11.07 | 82.81±10.51 | 81.19±8.49 | 78.45±11.08 | 0.465 |
| HbA1c (%) | 9.59±2.34 | 9.17±2.30 | 9.05±2.11 | 9.07±1.98 | 0.619 |
| Fasting glucose (mmol/l) | 7.34±2.37 | 7.18±2.06 | 7.34±1.95 | 7.35±2.01 | 0.977 |
| Fasting insulin (mIU/l) | 89.97±42.84 | 70.55±31.10 | 75.22±46.26 | 52.31±28.62 | 0.006** |
| HOMA-IR | 3.20 (2.09–5.22) | 2.82 (1.72–4.14) | 2.98 (2.05–4.30) | 2.33 (1.42–2.93) | 0.135 |
| TCH (mmol/l) | 5.03±1.00 | 4.66±0.98 | 4.89±0.93 | 4.90±01.39 | 0.267 |
| TG (mmol/l) | 1.80 (1.31–2.58) | 1.58 (1.12–2.03) | 1.73 (1.14–2.33) | 1.94 (1.10–2.55) | 0.447 |
| HDL-c (mmol/l) | 1.04 (0.88–1.23) | 1.14 (0.95–1.40) | 1.10 (1.00–1.49) | 1.04 (1.00–1.58) | 0.083 |
| LDL-c (mmol/l) | 3.07±0.85 | 3.10±0.94 | 3.06±0.91 | 3.19±1.10 | 0.974 |
| BUA (μmol/l) | 355.33±90.32 | 308.28±107.91 | 308.50±88.99 | 309.1±107.31 | 0.031* |
| SCr (μmol/l) | 61.40±16.26 | 56.47±14.00 | 58.75±17.02 | 59.00±14.85 | 0.396 |
| EATT (mm) | 5 (4–6) | 4 (3–4) | 4 (2–5) | 4 (2–5) | 0.006** |
BMI – body mass index; WC – waist circumference; WHR – waist-hip ratio; SBP – systolic blood pressure; DBP – diastolic blood pressure; HbA1c – glycated hemoglobin A1C; HOMA-IR – homeostasis model assessment of insulin resistance; TCH – total cholesterol; TG – triglycerides; HDL-c – high-density lipoprotein cholesterol; LDL-c – low-density lipoprotein cholesterol; BUA – blood uric acid; SCr – serum creatinine; Ca – calcium; 25(OH)D – 25-hydroxyvitamin D; EATT – epicardial adipose tissue thickness. Data are presented as the mean value ±SD or median values with interquartile ranges (25th to 75th).
p<0.05;
p<0.01.
Correlation analysis between EAT thickness and clinical indicators
To determine the association between EATT and vital parameters, spearman correlation analysis was performed. As shown in Table 3, a positive correlation with EATT was observed with WC (p=0.001), SBP (p=0.010), DBP (p=0.020), HOMA-IR (p=0.001), and TG (p=0.029), while negative correlations were found with HDL-c (p=0.009) and 25(OH)D (p=0.001) (Table 3). No significant correlations were found between EAT and BMI (p=0.246), HbA1c (p=0.020), TCH (p=0.105), LDL-c (p=0.066), and BUA (p=0.059).
Table 3.
Correlation between epicardial adipose tissue thickness and characteristics in non-obese patients of type 2 diabetes.
| Epicardial adipose tissue thickness | ||
|---|---|---|
| r | p value | |
| BMI | 0.090 | 0.246 |
| WC | 0.295 | 0.001** |
| SBP | 0.198 | 0.010* |
| DBP | 0.171 | 0.020* |
| HbA1c | 0.043 | 0.583 |
| HOMA-IR | 0.263 | 0.001** |
| TCH | 0.126 | 0.105 |
| TG | 0.169 | 0.029* |
| HDL-c | −0.201 | 0.009** |
| LDL-c | 0.143 | 0.066 |
| BUA | 0.146 | 0.059 |
| 25(OH)D | −0.250 | 0.001** |
BMI – body mass index; WC – waist circumference; SBP – systolic blood pressure; DBP – diastolic blood pressure; HOMA-IR – homeostasis model assessment of insulin resistance; TCH – total cholesterol; TG – triglycerides; HDL-c – high-density lipoprotein cholesterol; LDL-c – low-density lipoprotein cholesterol; BUA – blood uric acid; 25(OH)D – 25-hydroxyvitamin D.
p<0.05;
p<0.01.
Multivariate analysis for EAT thickness
To explore the independent risk factors of EATT, multivariate linear regression analysis was performed to reveal the independent factors after adjustment for multiple potential confounders. As shown in Table 4, in the fully adjusted regression model, WC (p<0.001), SBP (p=0.013), HOMA-IR (p=0.030), and 25(OH)D (p=0.039) were independently associated with EATT. This regression model accounted for 23.1% of total variance in EATT.
Table 4.
Multiple linear regression analysis: independent predictors of epicardial adipose tissue thickness among 167 type 2 diabetic patients.
| Dependent variable | Independent variables | Standardized beta coefficients | p-value |
|---|---|---|---|
| EATT | WC | 0.054 | <0.001*** |
| SBP | 0.015 | 0.013* | |
| HOMA-IR | 0.389 | 0.030* | |
| 25(OH)D | −0.409 | 0.039* | |
| R2 model | 0.231 |
EATT – epicardial adipose tissue thickness; WC – waist circumference; SBP – systolic blood pressure; HOMA-IR – homeostasis model assessment of insulin resistance; 25(OH)D – 25-hydroxyvitamin D.
p<0.05;
p<0.001.
Discussion
In our study, the results revealed a significant increase in EATT in T2D patients in the absence of obesity as evaluated by BMI. More importantly, we demonstrated that vitamin D level was negatively associated with EATT in non-obese T2D patients. Moreover, the study showed that there was an overwhelming prevalence of vitamin D deficiency in the southeast of China, which was more severe in T2D patients.
Diabetic patients with normal or low BMI values are more susceptible to cardiovascular complications, possibly due to the excessive accumulation of EAT, which has been increasingly recognized as an indispensable indicator of central obesity. Several studies suggested that EAT plays a key role in the development of an undesirable cardiovascular risk profile, leading to myocardial injury, atrial fibrillation, and coronary artery disease [6]. Particularly, expansion of EAT with unfavorable secretory products in T2D severely affected the function of the underlying myocardium, mainly due to the release of activin A and angiopoietin-2 along with the increased macrophage and monocyte infiltration [19,20]. Our study also demonstrated that the EATT measured by two-dimensional transthoracic echocardiography was significantly higher in T2D patients than normal subjects with normal BMI (Table 1). Similarly, Lacobellis et al. reported the increased EATT in non-obese type 1 diabetics [21]. These results show that diabetic patients have increased EATT, regardless of high BMI.
In recent years, a plausible relationship between vitamin D and adipose tissue has been revealed [13]. In our study, the 25(OH)D concentration of non-obese subjects with T2D who were living in the city of Wenzhou was 32 (19.30–53.70) nmol/l. Notably, only 6.6% of diabetic patients had normal nutritional status of vitamin D (≥75), while 71.8% showed deficiency. Taking into consideration the seasonal and latitudinal effects on 25(OH)D concentrations, people still lack sufficient ultraviolet B radiation (UVB) to synthesize activated vitamin D for only 1 month of the year [14]. Wenzhou, which is a southeastern coastal city of China, is in temperate zones (23.5°–66.5°). It has been reported that vitamin D deficiency was independently correlated with T2D, due to increased insulin resistance and β-cell malfunction [22,23]. Although 25(OH)D deficiency is usually detected in T2D patients, especially in those who are obese and in which insulin resistance is the most common finding, nutritional status of hypovitaminosis D was widely observed in non-obese diabetes by our pilot study.
25(OH)D is associated with metabolic syndrome [24,25]. Under the classification of 25(OH)D status, the critical metabolic indicators included were WC, fasting insulin, HDL-c, BUA, and EATT. These indicators are inversely related to 25(OH)D in non-obese T2D patients in our study (Table 2). A growing body of evidence demonstrates that vitamin D deficiency is involved in EATT and inflammatory response in premenopausal women and patients with coronary artery disease or metabolic syndrome [12,13,26]. In our study, increased EATT, which indicates visceral obesity, was associated with decreased 25(OH)D levels by correlation analysis (Table 3). Moreover, multivariate linear regression analysis showed that low 25(OH)D concentration is an independent risk factor of EATT (Table 4). Cardiac hypertrophy and inflammation in EAT were induced by vitamin D deficiency in an animal model [27]. Mutt et al. found that 1,25-dihydroxyvitamin D(3) inhibited inflammatory response in adipocytes via the NF-κB pathway [28]. Besides the adipocyte itself, evidence shows that the low-grade systemic inflammation in obesity or diabetes was overwhelmingly induced by pro-inflammatory action by adipose tissue macrophages, such as overexpression of inflammatory cytokines and macrophage infiltration [29]. In addition to the well-established association with macrophages, vitamin D has been reported to be a key inhibitor of activation, migration, and adhesion of macrophages [30,31]. Vitamin D is a promising candidate and deserves to be further investigated regarding the change of EAT, related metabolic disorders, and inflammatory response in non-obese diabetic patients. Additionally, the relationship between vitamin D and insulin resistance has not been fully elucidated [22,32]. No significant association between insulin resistance and vitamin D in non-obese diabetic patients was found in our study (Table 2), but other studies demonstrated that vitamin D deficiency increased insulin resistance by decreasing adipose PPAR-γ expression in non-obese T2D rats [33].
Obesity-related health outcomes, which are probably induced by increased EATT, tend to occur at a lower BMI level in Chinese adults than in those people from Western countries [34]. It is known that EAT is the key component of visceral fat, but it is not correlated with subcutaneous fat [35]. Notably, WC is not considered as a specific indicator of visceral fat in severely obese patients due to the confounding factors of subcutaneous fat [36]. However, we found a significantly positive correlation between EATT and WC in non-obese diabetic patients. We speculate that EAT is a surrogate measure of visceral abdominal obesity in non-obese T2D patients. Many studies demonstrated that adipose inflammation plays an important part in insulin resistance [37]. Our study found that HOMA-IR as an indicator of insulin resistance was independently related to increased EATT in non-obese diabetic patients. Consistent with these findings, Manco and Blachnio-Zabielska also found that EAT was a significant marker of increased insulin resistance [38,39]. In view of these findings, targeting EAT was considered to be a potential therapeutic strategy for sustaining metabolic homeostasis.
There were several limitations in this study. First, a cross-sectional study cannot explain the causal relation between 25(OH)D and EATT in non-obese T2D patients. Second, inflammatory cytokines and adipokines were not measured; therefore, the specific effects of hypovitaminosis D on EATT were not elucidated. Third, the subjects were evaluated during winter season when people receive less UVB radiation for vitamin D synthesis as compared to other seasons. Despite these limitations, this is the first study to investigate the association of 25(OH)D levels with EATT as evaluated by two-dimensional transthoracic echocardiography in non-obese T2D individuals.
Conclusions
This cross-sectional study revealed that the level of 25(OH)D was lower in non-obese T2D patients compared to the subjects without diabetes. More importantly, we demonstrated for the first time that the significant increase in EATT was associated with vitamin D status in Chinese non-obese T2D patients BMI, as well as insulin resistance. EAT needs further study and might be a useful therapeutic target.
Footnotes
Source of support: This study was supported by the Public Welfare Science and Technology Program of Wenzhou City (Y20160306), Natural Science Funding of Zheijang Province (LY16H07006) and Clinical Medicine Research Found of Chinese Medical Association (13020110396)
References
- 1.da Rocha Fernandes J, Ogurtsova K, Linnenkamp U, et al. IDF Diabetes Atlas estimates of 2014 global health expenditures on diabetes. Diabetes Res Clin Pract. 2016;117:48–54. doi: 10.1016/j.diabres.2016.04.016. [DOI] [PubMed] [Google Scholar]
- 2.Masmiquel L, Leiter LA, Vidal J, et al. LEADER 5: Prevalence and cardiometabolic impact of obesity in cardiovascular high-risk patients with type 2 diabetes mellitus: Baseline global data from the LEADER trial. Cardiovasc Diabetol. 2016;15:29. doi: 10.1186/s12933-016-0341-5. [DOI] [PMC free article] [PubMed] [Google Scholar]
- 3.Badoud F, Perreault M, Zulyniak MA, Mutch DM. Molecular insights into the role of white adipose tissue in metabolically unhealthy normal weight and metabolically healthy obese individuals. FASEB J. 2015;29(3):748–58. doi: 10.1096/fj.14-263913. [DOI] [PubMed] [Google Scholar]
- 4.Lim S, Meigs JB. Ectopic fat and cardiometabolic and vascular risk. Int J Cardiol. 2013;169(3):166–76. doi: 10.1016/j.ijcard.2013.08.077. [DOI] [PubMed] [Google Scholar]
- 5.Iacobellis G, Bianco AC. Epicardial adipose tissue: emerging physiological, pathophysiological and clinical features. Trends Endocrinol Metab. 2011;22(11):450–57. doi: 10.1016/j.tem.2011.07.003. [DOI] [PMC free article] [PubMed] [Google Scholar]
- 6.Iacobellis G. Local and systemic effects of the multifaceted epicardial adipose tissue depot. Nat Rev Endocrinol. 2015;11(6):363–71. doi: 10.1038/nrendo.2015.58. [DOI] [PubMed] [Google Scholar]
- 7.Iacobellis G. Epicardial fat: A new cardiovascular therapeutic target. Curr Opin Pharmacol. 2016;27:13–18. doi: 10.1016/j.coph.2016.01.004. [DOI] [PubMed] [Google Scholar]
- 8.Arabi A, El Rassi R, El-Hajj Fuleihan G. Hypovitaminosis D in developing countries-prevalence, risk factors and outcomes. Nat Rev Endocrinol. 2010;6(10):550–61. doi: 10.1038/nrendo.2010.146. [DOI] [PubMed] [Google Scholar]
- 9.Wimalawansa SJ. Non-musculoskeletal benefits of vitamin D. J Steroid Biochem Mol Biol. 2016 doi: 10.1016/j.jsbmb.2016.09.016. [Epub ahead of print] [DOI] [PubMed] [Google Scholar]
- 10.Ding C, Gao D, Wilding J, et al. Vitamin D signalling in adipose tissue. Br J Nutr. 2012;108(11):1915–23. doi: 10.1017/S0007114512003285. [DOI] [PubMed] [Google Scholar]
- 11.Esteghamati A, Aryan Z, Esteghamati A, Nakhjavani M. Differences in vitamin D concentration between metabolically healthy and unhealthy obese adults: Associations with inflammatory and cardiometabolic markers in 4391 subjects. Diabetes Metab. 2014;40(5):347–55. doi: 10.1016/j.diabet.2014.02.007. [DOI] [PubMed] [Google Scholar]
- 12.Gurses KM, Tokgozoglu L, Yalcin MU, et al. Epicardial fat thickness is increased in vitamin D deficient premenopausal women and does not decrease after short-term replacement. J Atheroscler Thromb. 2015;22(6):582–89. doi: 10.5551/jat.28381. [DOI] [PubMed] [Google Scholar]
- 13.Kirac Utku I, Okuturlar Y, Demir E, et al. Relationship between epicardial adipose tissue thickness and vitamin D in patients with metabolic syndrome. Int J Clin Exp Med. 2015;8(4):5707–14. [PMC free article] [PubMed] [Google Scholar]
- 14.Holick MF. Vitamin D deficiency. N Engl J Med. 2007;357(3):266–81. doi: 10.1056/NEJMra070553. [DOI] [PubMed] [Google Scholar]
- 15.Report of the Expert Committee on the Diagnosis and Classification of Diabetes Mellitus. Diabetes Care. 1997;20(7):1183–97. doi: 10.2337/diacare.20.7.1183. [DOI] [PubMed] [Google Scholar]
- 16.Matthews DR, Hosker JP, Rudenski AS, et al. Homeostasis model assessment: Insulin resistance and beta-cell function from fasting plasma glucose and insulin concentrations in man. Diabetologia. 1985;28(7):412–19. doi: 10.1007/BF00280883. [DOI] [PubMed] [Google Scholar]
- 17.James PA, Oparil S, Carter BL, et al. 2014 evidence-based guideline for the management of high blood pressure in adults: Report from the panel members appointed to the Eighth Joint National Committee (JNC 8) JAMA. 2014;311(5):507–20. doi: 10.1001/jama.2013.284427. [DOI] [PubMed] [Google Scholar]
- 18.Expert Panel on Detection, Evaluation, and Treatment of High Blood Cholesterol in Adults. Executive Summary of The Third Report of The National Cholesterol Education Program (NCEP) Expert Panel on Detection, Evaluation, And Treatment of High Blood Cholesterol In Adults (Adult Treatment Panel III) JAMA. 2001;285(19):2486–97. doi: 10.1001/jama.285.19.2486. [DOI] [PubMed] [Google Scholar]
- 19.Greulich S, Maxhera B, Vandenplas G, et al. Secretory products from epicardial adipose tissue of patients with type 2 diabetes mellitus induce cardiomyocyte dysfunction. Circulation. 2012;126(19):2324–34. doi: 10.1161/CIRCULATIONAHA.111.039586. [DOI] [PubMed] [Google Scholar]
- 20.Blumensatt M, Fahlbusch P, Hilgers R, et al. Secretory products from epicardial adipose tissue from patients with type 2 diabetes impair mitochondrial beta-oxidation in cardiomyocytes via activation of the cardiac renin-angiotensin system and induction of miR-208a. Basic Res Cardiol. 2017;112(1):2. doi: 10.1007/s00395-016-0591-0. [DOI] [PubMed] [Google Scholar]
- 21.Iacobellis G, Diaz S, Mendez A, Goldberg R. Increased epicardial fat and plasma leptin in type 1 diabetes independently of obesity. Nutr Metab Cardiovasc Dis. 2014;24(7):725–29. doi: 10.1016/j.numecd.2013.11.001. [DOI] [PubMed] [Google Scholar]
- 22.Zhang J, Ye J, Guo G, et al. Vitamin D status is negatively correlated with insulin resistance in Chinese type 2 diabetes. Int J Endocrinol. 2016;2016:1794894. doi: 10.1155/2016/1794894. [DOI] [PMC free article] [PubMed] [Google Scholar]
- 23.Calvo-Romero JM, Ramiro-Lozano JM. Vitamin D levels in patients with type 2 diabetes mellitus. J Investig Med. 2015;63(8):921–23. doi: 10.1097/JIM.0000000000000234. [DOI] [PubMed] [Google Scholar]
- 24.Vitezova A, Zillikens MC, van Herpt TT, et al. Vitamin D status and metabolic syndrome in the elderly: The Rotterdam Study. Eur J Endocrinol. 2015;172(3):327–35. doi: 10.1530/EJE-14-0580. [DOI] [PubMed] [Google Scholar]
- 25.Gagnon C, Lu ZX, Magliano DJ, et al. Low serum 25-hydroxyvitamin D is associated with increased risk of the development of the metabolic syndrome at five years: Results from a national, population-based prospective study (The Australian Diabetes, Obesity and Lifestyle Study: AusDiab) J Clin Endocrinol Metab. 2012;97(6):1953–61. doi: 10.1210/jc.2011-3187. [DOI] [PubMed] [Google Scholar]
- 26.Dozio E, Briganti S, Vianello E, et al. Epicardial adipose tissue inflammation is related to vitamin D deficiency in patients affected by coronary artery disease. Nutr Metab Cardiovasc Dis. 2015;25(3):267–73. doi: 10.1016/j.numecd.2014.08.012. [DOI] [PubMed] [Google Scholar]
- 27.Gupta GK, Agrawal T, DelCore MG, et al. Vitamin D deficiency induces cardiac hypertrophy and inflammation in epicardial adipose tissue in hypercholesterolemic swine. Exp Mol Pathol. 2012;93(1):82–90. doi: 10.1016/j.yexmp.2012.04.006. [DOI] [PMC free article] [PubMed] [Google Scholar]
- 28.Mutt SJ, Karhu T, Lehtonen S, et al. Inhibition of cytokine secretion from adipocytes by 1,25-dihydroxyvitamin D(3) via the NF-kappaB pathway. FASEB J. 2012;26(11):4400–7. doi: 10.1096/fj.12-210880. [DOI] [PubMed] [Google Scholar]
- 29.Maurizi G, Della Guardia L, Maurizi A, Poloni A. Adipocytes properties and crosstalk with immune system in obesity-related inflammation. J Cell Physiol. 2017 doi: 10.1002/jcp.25855. [Epub ahead of print] [DOI] [PubMed] [Google Scholar]
- 30.Riek AE, Oh J, Darwech I, et al. 25(OH) vitamin D suppresses macrophage adhesion and migration by downregulation of ER stress and scavenger receptor A1 in type 2 diabetes. J Steroid Biochem Mol Biol. 2014;144(Pt A):172–79. doi: 10.1016/j.jsbmb.2013.10.016. [DOI] [PMC free article] [PubMed] [Google Scholar]
- 31.Karkeni E, Marcotorchino J, Tourniaire F, et al. Vitamin D limits chemokine expression in adipocytes and macrophage migration in vitro and in male mice. Endocrinology. 2015;156(5):1782–93. doi: 10.1210/en.2014-1647. [DOI] [PubMed] [Google Scholar]
- 32.Bril F, Maximos M, Portillo-Sanchez P, Biernacki D, et al. Relationship of vitamin D with insulin resistance and disease severity in non-alcoholic steatohepatitis. J Hepatol. 2015;62(2):405–11. doi: 10.1016/j.jhep.2014.08.040. [DOI] [PubMed] [Google Scholar]
- 33.Park S, Kim da S, Kang S. Vitamin D deficiency impairs glucose-stimulated insulin secretion and increases insulin resistance by reducing PPAR-gamma expression in nonobese type 2 diabetic rats. J Nutr Biochem. 2016;27:257–65. doi: 10.1016/j.jnutbio.2015.09.013. [DOI] [PubMed] [Google Scholar]
- 34.Wildman RP, Gu D, Reynolds K, et al. Appropriate body mass index and waist circumference cutoffs for categorization of overweight and central adiposity among Chinese adults. Am J Clin Nutr. 2004;80(5):1129–36. doi: 10.1093/ajcn/80.5.1129. [DOI] [PubMed] [Google Scholar]
- 35.Sram M, Vrselja Z, Leksan I, et al. Epicardial adipose tissue is nonlinearly related to anthropometric measures and subcutaneous adipose tissue. Int J Endocrinol. 2015;2015:456293. doi: 10.1155/2015/456293. [DOI] [PMC free article] [PubMed] [Google Scholar]
- 36.Ross R, Leger L, Morris D, et al. Quantification of adipose tissue by MRI: Relationship with anthropometric variables. J Appl Physiol (1985) 1992;72(2):787–95. doi: 10.1152/jappl.1992.72.2.787. [DOI] [PubMed] [Google Scholar]
- 37.Samuel VT, Shulman GI. The pathogenesis of insulin resistance: Integrating signaling pathways and substrate flux. J Clin Invest. 2016;126(1):12–22. doi: 10.1172/JCI77812. [DOI] [PMC free article] [PubMed] [Google Scholar]
- 38.Manco M, Morandi A, Marigliano M, et al. Epicardial fat, abdominal adiposity and insulin resistance in obese pre-pubertal and early pubertal children. Atherosclerosis. 2013;226(2):490–95. doi: 10.1016/j.atherosclerosis.2012.11.023. [DOI] [PubMed] [Google Scholar]
- 39.Blachnio-Zabielska AU, Baranowski M, Hirnle T, et al. Increased bioactive lipids content in human subcutaneous and epicardial fat tissue correlates with insulin resistance. Lipids. 2012;47(12):1131–41. doi: 10.1007/s11745-012-3722-x. [DOI] [PMC free article] [PubMed] [Google Scholar]