Abstract
This contribution reports on grafting of bioactive polymers such as poly(sodium styrene sulfonate) (polyNaSS) onto titanium (Ti) surfaces. This grafting process uses a modified dopamine as an anchor molecule to link polyNaSS to the Ti surface. The grafting process combines reversible addition-fragmentation chain transfer polymerization, postpolymerization modification, and thiol-ene chemistry. The first step in the process is to synthetize architecture controlled polyNaSS with a thiol end group. The second step is the adhesion of the dopamine acrylamide (DA) anchor onto the Ti surfaces. The last step is grafting polyNaSS to the DA-modified Ti surfaces. The modified dopamine anchor group with its bioadhesive properties is essential to link bioactive polymers to the Ti surface. The polymers are characterized by conventional methods (nuclear magnetic resonance, size exclusion chromatography, and attenuated total reflection-Fourier-transformed infrared), and the grafting is characterized by x-ray photoelectron spectroscopy, time-of-flight secondary ion mass spectrometry, and quartz crystal microbalance with dissipation monitoring. To illustrate the biocompatibility of the grafted Ti-DA-polyNaSS surfaces, their interactions with proteins (albumin and fibronectin) and cells are investigated. Both albumin and fibronectin are readily adsorbed onto Ti-DA-polyNaSS surfaces. The biocompatibility of modified Ti-DA-polyNaSS and control ungrafted Ti surfaces is tested using human bone cells (Saos-2) in cell culture for cell adhesion, proliferation, differentiation, and mineralization. This study presents a new, simple way to graft bioactive polymers onto Ti surfaces using a catechol intermediary with the aim of demonstrating the biocompatibility of these size controlled polyNaSS grafted surfaces.
I. INTRODUCTION
During the second half of the 20th century, titanium (Ti) and its alloys began to be widely used in the biomedical industry, particularly as hard tissue replacements. For decades, these materials have successfully been employed in the orthopedic and dental fields. They have excellent physical and chemical properties such as good corrosion resistance and “acceptable” biocompatibility and mechanical properties close to human bone.1,2 However, unmodified Ti based materials can slowly induce the formation of a fibrous layer, even after several years of implantation, compromising the interface with the living tissue and leading to progressive loss of osseointegration and aseptic loosening of implants.3,4 The inability of Ti to establish strong chemical bonding with the biological surrounding tissues is at the origin of this problem.5 To overcome this challenge, different strategies have been proposed to modify the Ti surface, including mechanical, thermal, and electrochemical methods.6–9 More recently, Ti surface modification by grafting biomolecules and/or bioactive polymers has become a popular alternative approach.10
Previous studies have shown that anionic polymers such as poly(sodium styrene sulfonate) (polyNaSS), poly(methacrylic acid), and poly(methacryloyl phosphate) can favor osteoblast cell adhesion and differentiation.11,12 The distribution of the ionic groups along the molecular chains creates active sites which can interact with the extracellular proteins such as fibronectin that have been implicated in cell responses.13,14 Recently, the grafting of polyNaSS was successfully achieved using radicals (under heating15–18 or UV irradiation19,20) or atom transfer radical polymerization [ATRP (Refs. 21–23)]. Radicals from Ti peroxides are able to initiate the radical polymerization of the sodium styrene sulfonate (NaSS) monomer.15–20 This method is known to give a large size distribution of synthesized polymers. ATRP produces grafted polymers with a narrower polydispersity but requires the surface to be functionalized with a surface initiator. In this paper, we demonstrate a new method to graft polymers onto Ti surfaces with a predetermined molecular weight and a narrow polydispersity.
The success of controlled radical polymerization (CRP) relies on the robustness of radical chemistry and the capacity to control the polymer structure (predetermined molecular weight, narrow molecular weight distribution, and well-defined end groups and architecture) under mild conditions. There are numerous CRP methods, with three of the most commonly used being nitroxide mediated polymerization (NMP), ATRP, and reversible addition fragmentation transfer (RAFT) polymerization. RAFT polymerization presents some advantages over ATRP polymerization. Both techniques allow the polymerization of a large array of monomers; however, the RAFT process does not require the use of a potentially toxic metal catalyst (copper). NMP does not use metal complexes, but it does use expensive nitroxide or alkoxyamines and requires high temperatures. Few research studies have reported using RAFT polymerization for preparing brush polymers for grafting onto Ti surfaces. Also, despite the importance and wide use of RAFT polymerization,24–26 few RAFT studies have used ionic monomers. We present in this report the synthesis of anionic polymers (polyNaSS) by RAFT polymerization for grafting onto Ti surfaces.
Several techniques for covalently tethering well-defined polymers onto surfaces have been developed, including the covalent attachment of end-functionalized polymers incorporating an appropriate anchor (“grafting to”) and the in situ polymerization initiated from the surface (“grafting from”).27 To date, the most common methodologies for the covalent attachment of target molecules onto Ti surfaces have involved the formation of monolayers with organofunctional silanes,28,29 phosphonic acids,30–32 and phosphonates.33 Then, a target molecule was covalently attached to the surface. However, these strategies usually require multiple steps to generate appropriate organofunctional anchors. Recently, the catechol unit, because of its strong adhesive properties, has become an important biomimetic ligand for surface immobilization.34 Inspired by the unique properties of the adhesive proteins secreted by marine organisms, the incorporation of the catecholic functionality into macromolecules has aroused much interest.34–36 Messersmith et al.37 have reported the first example of anchoring a catecholic initiator onto stainless steel surfaces, for subsequent surface-initiated ATRP. To date, the catecholic units have been conjugated with various polymerization initiators or “clickable” moieties.38–40 For example, Woisel et al.39,40 report a simple and versatile approach for Ti surface modification based on catechol surface modification that enables target molecules to be attached using the copper-catalyzed, azide-alkyne cycloaddition reaction.
In this context, we propose a new and efficient chemical strategy to functionalize Ti surfaces. It is a simple and versatile strategy based on catechol surface modification that was developed to enable bioactive ionic polymers bearing thiol end groups to be attached using a thiol-ene click reaction. First, a bioactive polymer was synthetized by RAFT polymerization to give a thiol end group. Then, the bioactive polymer was covalently attached via the “thiol-ene click” reaction onto Ti surfaces modified with the dopamine derivative bearing an alkene group. This technique is an efficient way to produce dense polymer brushes of narrow dispersity, controlled architecture, and well-defined thicknesses and compositions.
In this article, the control Ti, catechol-modified Ti, and poly(NaSS)-grafted Ti surfaces were characterized using x-ray photoelectron spectroscopy (XPS), time-of-flight secondary ion mass spectrometry (ToF-SIMS), and quartz crystal microbalance with dissipation monitoring (QCM-D). Preliminary studies were carried out to test the biological responses to the new anchoring chemistry to ensure that it was at least equivalent to the untreated Ti control and demonstrate that the new chemistry was biologically acceptable to living cells (biocompatible).
II. EXPERIMENTAL METHODS
A. Materials
All chemical products were obtained from commercial suppliers and were used as received unless stated otherwise. Distilled water with a resistivity of 18.2 MΩ cm (at 25 °C) was obtained from a Millipore Milli-Q Plus water purification system fitted with a 0.22 μm filter. NaSS was purified by recrystallization in a mixture of ethanol/water (90/10 v/v). The purified NaSS was then dried under atmospheric pressure at 50 °C overnight and then stored at 4 °C. Bovine serum albumin (BSA, Sigma) and human fibronectin (Fn, Sigma) were used at concentrations mimicking their proportion (Fn/BSA) in human plasmas (10% of the physiologic concentration). BSA was used at 4000 μg/ml in a phosphate-buffered saline solution (PBS, Sigma), while Fn was used at 20 μg/ml in PBS.
One-centimeter diameter titanium (Grade 2) disks were obtained from GoodFellow. The two faces of the disks were polished consecutively with 500 and 1200 grit SiC papers. After polishing, the surfaces were cleaned with acetone overnight under stirring. On the following day, the surfaces were successively cleaned once in an acetone bath and three times in a water (H2O) bath with sonication for 15 min. Then, the disks were put in Kroll's reagent (2% hydrofluoric acid, Sigma; 10% HNO3, Acros and 88% H2O) for 1 min with stirring followed by 15 min of sonication treatments in five consecutive water baths.
Detailed descriptions of synthesis procedures used to prepare the dopamine acrylamide (DA) anchor group, the polyNaSS via RAFT polymerization, and thiolation of polyNaSS are provided in the supplementary material.55 Experimental details for the nuclear magnetic resonance (NMR) and size exclusion chromatography (SEC) methods used to characterize the synthesized polyNaSS samples are also provided in the supplementary material.
B. Analytical methods
1. ATR-FTIR
The Fourier-transformed infrared (FTIR) spectra, recorded in the attenuated total reflection (ATR) mode, were obtained using a Perkin Elmer Spectrum Two Spectrometer. A diamond crystal (4000–500 cm−1) was applied to the sample surfaces, and at least 512 scans with a resolution of 4 cm−1 were summed for each sample.
2. XPS
XPS data were acquired on a Surface Science Instruments S-probe spectrometer. This instrument has a monochromatized Al Kα x-ray source and a low energy electron flood gun for charge neutralization of nonconducting samples. The samples were mechanically fastened to the sample holder and run as conductors. The x-ray spot size for these acquisitions was approximately 800 μm. The pressure in the analytical chamber during spectral acquisition was less than 5 × 10⁻⁹ Torr. The analyzer pass energy for the survey and detail scans was 150 eV. The photoelectron take-off angle (the angle between the sample normal and the input axis of the energy analyzer) was 0°, which corresponds to a sampling depth of ∼10 nm. service physics hawk data analysis 7 software was used to calculate surface atomic concentrations using peak areas above a linear background from the survey and detail scans and elemental sensitivity factors.
Three spots were analyzed from each replicate. Either two (Ti and Ti-DA-polyNaSS) or four (Ti-DA) replicates were analyzed. Each analysis spot included a survey spectrum and detailed spectra of Na1s and S2p.
3. ToF-SIMS
ToF-SIMS data were acquired on an IONTOF ToF-SIMS 5 spectrometer using a 25 keV Bi3+ primary cluster ion source in the pulsed mode. Spectra were acquired for both positive and negative secondary ions over a mass range of m/z= 0–800. The ion source was operated at a current of 0.12 pA. Secondary ions of a given polarity were extracted and detected using a reflectron time-of-flight mass analyzer. Spectra were acquired using an analysis area of 100 × 100 μm. The total primary ion dose for each spectrum was 9.2 × 10¹¹ ions/cm2. Positive ion spectra were mass calibrated using the CH3+, C2H3+, and C3H5+ peaks. The negative ion spectra were mass calibrated using the CH−, C2H−, and C4H− peaks. Calibration errors were below 20 ppm. The mass resolution (m/Δm) for a typical spectrum was ∼5000 for m/z = 27 (pos) and ∼4000 for m/z = 25 (neg). For each replicate, five positive and five negative spectra were acquired from random locations across the surface. Two replicates of each sample type (Ti, Ti-DA, and Ti-DA-polyNaSS) were analyzed.
4. QCM-D
QCM-D experiments were performed on Ti-coated sensors (QSX-310) using an E1 QCM-D system from Q-sense (Sweden) equipped with a temperature controlled measuring chamber and a peristaltic pump. All experiments were carried out under flow conditions using the peristaltic pump (0.2 ml/min) at a controlled temperature (37 °C). The concentration of the polymer solutions was fixed at 5 mg/ml in all the QCM-D experiments, and the polymers were dissolved in distilled water. The variations in frequency (Δf) and dissipation (ΔD) were recorded at five overtone frequencies (third, fifth, seventh, ninth, and 11th) as well as the fundamental frequency (5 MHz) of the Ti-coated sensor. For clarity, only the data from the fifth overtone (25 MHz) are displayed in Sec. III. Data were recorded until a plateau is reached for each step of the adsorption, adhesion or grafting, and rinsing process (i.e., when stable, equilibrium frequency and dissipation signals were reached). Physisorbed molecules or polymers were removed by intermediate rinsing steps with Milli-Q water or PBS (for proteins).
C. Biological assays
All control and polyNaSS grafted Ti wafers used for biological assays were sterilized by exposure to a UV germicidal lamp for 15 min, and then, wafers were flipped over and sterilized for another 15 min. The wafers were then placed individually into wells of tissue culture polystyrene (TCPS) 12-well plates and treated for 16 h with a sterile solution of serum-free culture medium Dulbecco's Modified Eagle's medium (DMEM)/Hams F12 containing penicillin (100 U ml−1), streptomycin (100 μg ml−1), and amphotericin B (2.50 μg ml−1) at 4 °C. The TCPS control plates were treated identically.
All cell-based assays were conducted using a human bone-derived cell line Saos-2 recognized to have the capacity to differentiate into mature bonelike cells producing alkaline phosphatase (ALP) and a bonelike mineralized matrix when cultured under the appropriate mineralizing/differentiating conditions.41,42 In this study, Saos-2 cells were used for all assays, were routinely cultured in a standard medium comprised of DMEM/Hams-F12 medium supplemented with 10% (v/v) fetal bovine serum (FBS), l-glutamine, penicillin, and streptomycin, and incubated at 37 °C in humidified air containing 5% CO2. Cell culture reagents were all sourced from Gibco (purchased from Life Technologies, Australia) unless otherwise mentioned. The control and polyNaSS grafted wafers were assayed for initial Saos-2 cell adhesion at 24 and 48 h, Saos-2 cell proliferation after 7 days, and Saos-2 cell differentiation after 25 days. Further details about the biological assay procedures are provided in the supplementary material.
III. RESULTS AND DISCUSSION
A. Preparation of a Tthiolated polyNaSS macromonomer
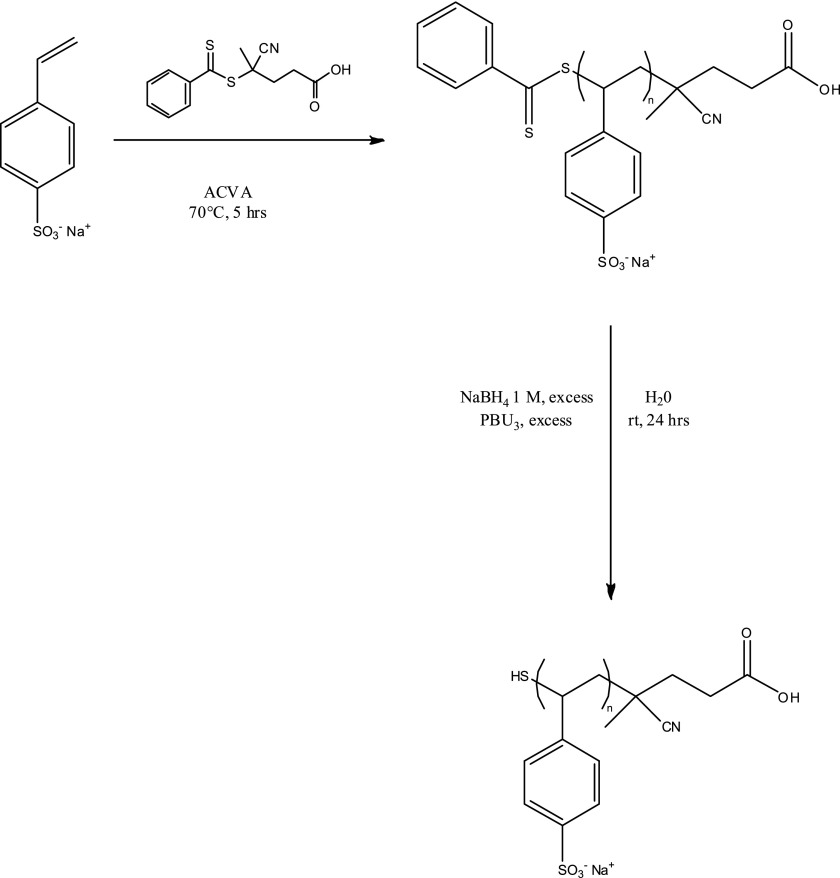
The thiolated polyNaSS (polyNaSS-SH) macromonomers used in this study were produced following a two-step strategy (Scheme 1). The first step involved the RAFT polymerization of NaSS in solution at 70 °C using 4,4′-azobis(4-cyanovaleric acid) as an initiator, 4-cyano-4-(phenylcarbonothioylthio)pentanoic acid as a chain transfer agent and water as the reagent (see supplementary materials for synthesis details).
Scheme 1.
Preparation of thiolated poly(sodium styrene sulfonate).
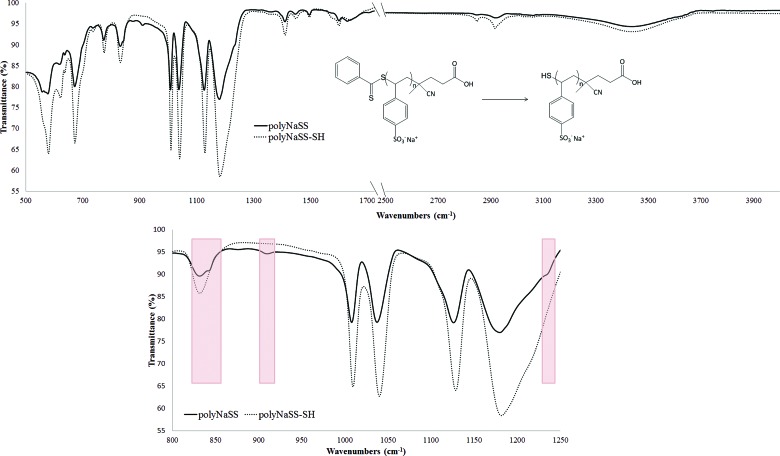
Using this chain agent transfer allowed the synthesis of polyNaSS macromolecules with well-defined molar masses and narrow dispersity values (Table I). The polymers resulting from the first synthesis step were characterized using 1H NMR and SEC. The thiol group was generated at the ω-chain end of the polymers in a second step, by reducing the dithiobenzoate moieties with an excess (>20 equiv relative to the number of polymer chains) of sodium borohydride (NaBH4) in water for two days.43–45 Comparison of the infrared spectra before and after the reduction showed the disappearance of the dithioester group (842–930 and ∼1230 cm−1) and the reduction to the thiol group (Fig. 1). To minimize the formation of disulfide bonds between the polymer chains, a reducing agent (PBu3) was included in the reaction mixture. The thiol macromonomers thus produced had molar masses and dispersity values nearly identical to their precursor polyNaSS (Table I). In addition, the comparison of the size-exclusion chromatograms before and after cleavage of the chain transfer agent did not exhibit any detectable disulfide bond formation (see supplementary material). For this study, four different polyNaSS-SH macromolecules spanning three molecular weights were prepared [∼5 (2×), ∼10, and ∼35 kDa].
Table I.
Conversion, number average molecular weights, and dispersity values before and after postpolymerization modification.
| Conv.a (%) | Mn,beforeb (g mol−1) | Đbeforeb | Mn,afterb (g mol−1) | Đafterb | |
|---|---|---|---|---|---|
| 1H NMR | SEC | ||||
| PolyNaSS170c | 0.92 | 35 200 | 1.17 | 35 600 | 1.25 |
| PolyNaSS48c | 0.88 | 10 000 | 1.15 | 10 500 | 1.21 |
| PolyNaSS25c | 0.88 | 5050 | 1.10 | 5100 | 1.18 |
| PolyNaSS25c | 0.85 | 5200 | 1.25 | 5220 | 1.25 |
After 5 h of polymerization at 70 °C as determined by 1H NMR.
Number average molecular weight and dispersity obtained from conventional calibration with polystyrene sodium sulfonate standards.
Number average degree of polymerization approximated based on the respective number average molecular weight.
Fig. 1.
Infrared spectra of the polyNaSS (black line) before and the polyNaSS-SH (gray line) after the reduction step.
B. Grafting of polyNaSS-SH onto the DA functionalized Ti surfaces
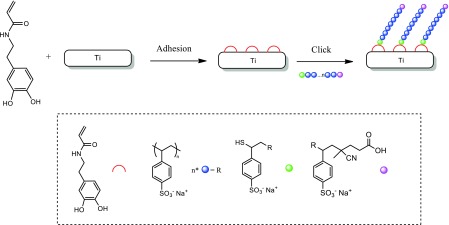
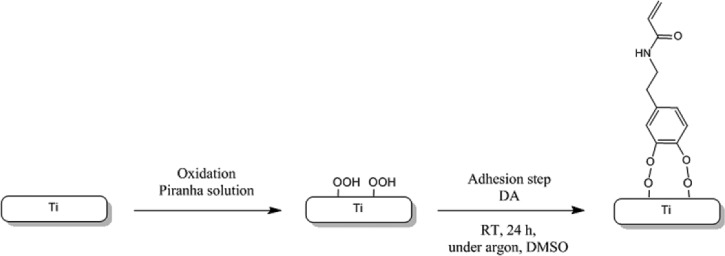
The polyNaSS-SH macromolecules were grafted onto the Ti surfaces using DA as an anchor molecule. Thus, the grafting process has two steps: (1) adhesion of DA onto the Ti surface and (2) attachment of poly(NaSS)-SH to the DA layer (Scheme 2). In the first step, the cleaned Ti surfaces were oxidized with a Piranha solution to create surface titanium hydroxide (Ti-OH) and peroxides (Ti-OOH) within the titanium oxide layer for reaction with the two hydroxide groups of DA (Scheme 3).
Scheme 2.
Grafting of polyNaSS-SH onto the Ti surface via the DA anchor molecule.
Scheme 3.
Adhesion of DA onto the Ti surface.
Since the auto-oxidation of the DA to dopaquinone greatly reduces its adhesion onto Ti surfaces, the solution pH must be controlled so that the Ti surface can be effectively coated with DA (Ti-DA). XPS, a method for measuring the elements and chemical species present in the surface region of a sample,46 was used to characterize the attachment of the DA anchor. The XPS results in Table II show that after DA attachment, the Ti and O surface concentrations decreased, while C and N surface concentrations increased, consistent with the successful adhesion of the DA anchor to the titanium surface. The Ti signal decreases due to attenuation of the substrate signals by the adhered DA onto the surface. The carbon and nitrogen signals increase due to their presence on the adhered DA surface (note that carbon is detected on the control Ti surface due to the adsorption of adventitious hydrocarbons from air exposure during shipping of the sample to the University of Washington for XPS analysis). Although oxygen is present in both the oxide layer on the titanium surface and in the DA molecules, it has a higher concentration in the titanium oxide layer, and therefore, the O signal decreases upon the DA adhesion. Small amounts of F (∼2 at. %) and S (∼1 at. %) were detected on some spots of the Ti and Ti-DA samples, respectively.
Table II.
XPS determined surface atomic composition of the cleaned Ti, Ti-DA, and ∼5 kDa Ti-DA-polyNaSS samples. The number of spots analyzed (n) is also indicated. nd = not detected.
| XPS (at. %) | |||||||
|---|---|---|---|---|---|---|---|
| Samples | C | O | Ti | N | S | Na | Others |
| Ti (n = 6) | 30.4 ± 1.6 | 48.7 ± 1.8 | 19.2 ± 0.4 | 0.6 ± 0.1 | nd | nd | F |
| Ti-DA (n = 12) | 43.5 ± 3.6 | 40.4 ± 2.4 | 13.6 ± 1.3 | 2.0 ± 0.8 | 0.5 + 0.5 | nd | - |
| Ti-DA-polyNaSS-SH (∼5 kDa, n = 6) | 57.3 ± 4.6 | 29.3 ± 3.3 | 7.3 ± 2.5 | 0.5 ± 0.3 | 2.8 ± 1.4 | 2.2 ± 0.4 | F |
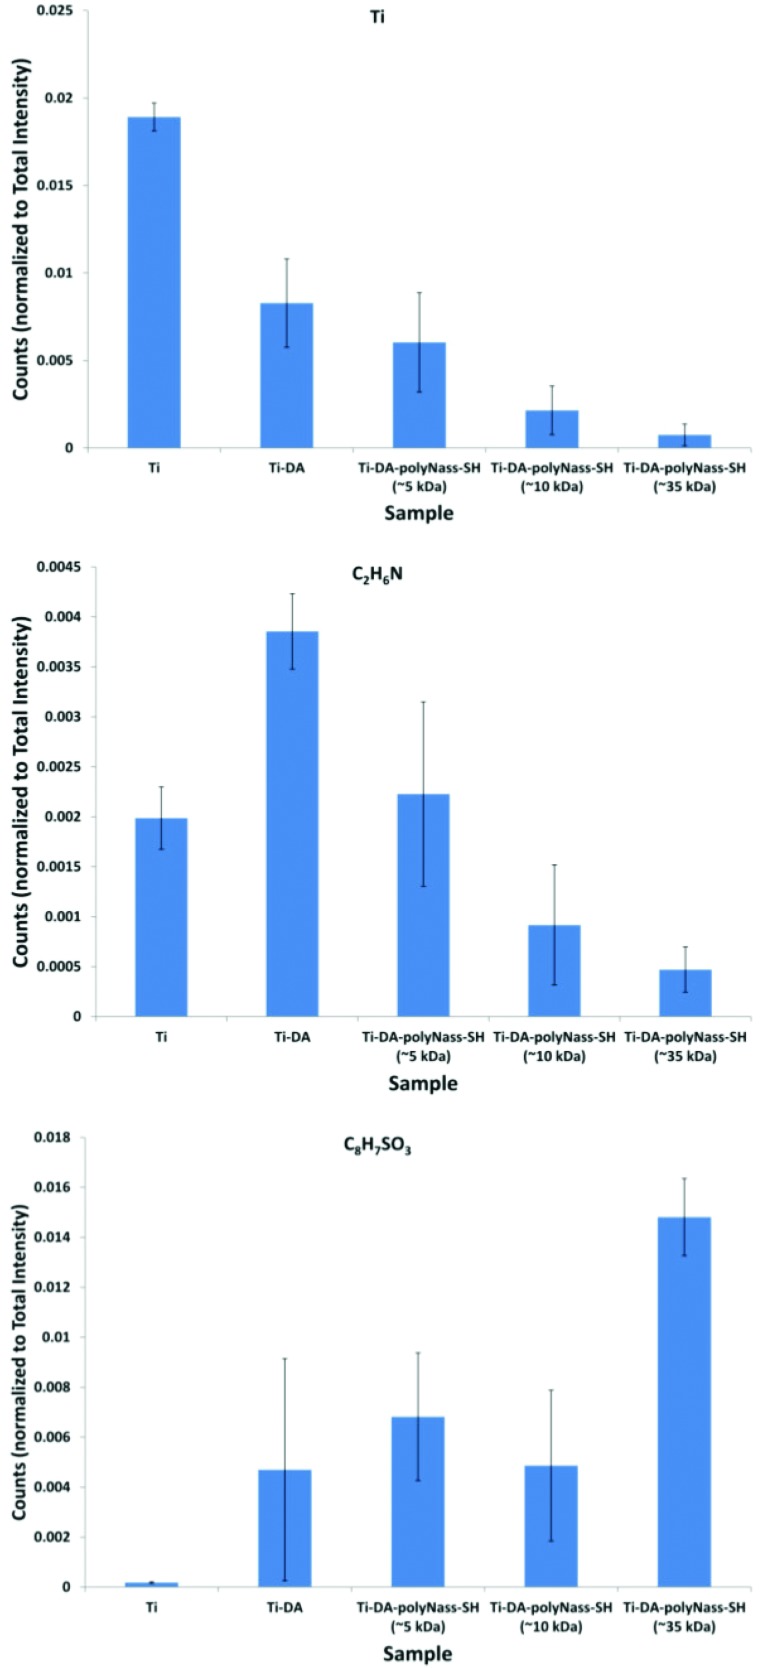
To provide additional insight into the molecular structure of the adhered DA, ToF-SIMS analysis was done. ToF-SIMS when operated in the static mode provides a mass spectrum of outer ∼2 nm of a surface.47 This method analyses positive and negative secondary ions sputtered from the sample surface region by a high-energy primary ion beam. The intensity of nitrogen and oxygen containing positive secondary ions with compositions consistent with the DA molecular structure [e.g., m/z = 30.03 (CH4N), m/z = 42.03 (C2H4N), m/z = 44.05 (C2H6N), m/z = 56.05 (C3H6N), m/z= 70.04 (C4H6O), and m/z = 95.05 (C6H7O)] was detected with higher intensity on the Ti-DA samples compared to the control Ti samples (see Fig. 2, middle). Likewise, the intensity of nitrogen and oxygen negative secondary ions with compositions consistent with the DA molecular structure [e.g., m/z = 26.00 (CN) and m/z = 42 (CNO)] was detected with higher intensity on the Ti-DA samples compared to the control Ti samples. Positive secondary ions characteristic of the titanium oxide substrate [e.g., m/z = 47.94 (Ti), m/z= 63.94 (TiO), and m/z = 64.95 (TiOH)] were detected at higher intensity on the control Ti samples compared to the Ti-DA samples (see Fig. 2, top). These changes in characteristic ToF-SIMS peak intensities are consistent with the XPS results, supporting the adhesion of DA onto the titanium surface. In addition, ToF-SIMS detected low to trace levels of peaks due to poly(dimethylsiloxane) (PDMS) on the samples. PDMS is a common surface contaminant and ToF-SIMS can detect its presence at significantly lower concentrations than XPS (XPS detection limit ∼0.1 at. % Si), and so, it is not surprising for ToF-SIMS to detect low to trace levels of PDMS when XPS did not detect its presence.
Fig. 2.
Changes in the intensity of Ti, C2H6N (DA), and C8H7SO3 (polyNaSS) ToF-SIMS fragments from the Ti, Ti-DA, and Ti-DA-polyNaSS-SH samples.
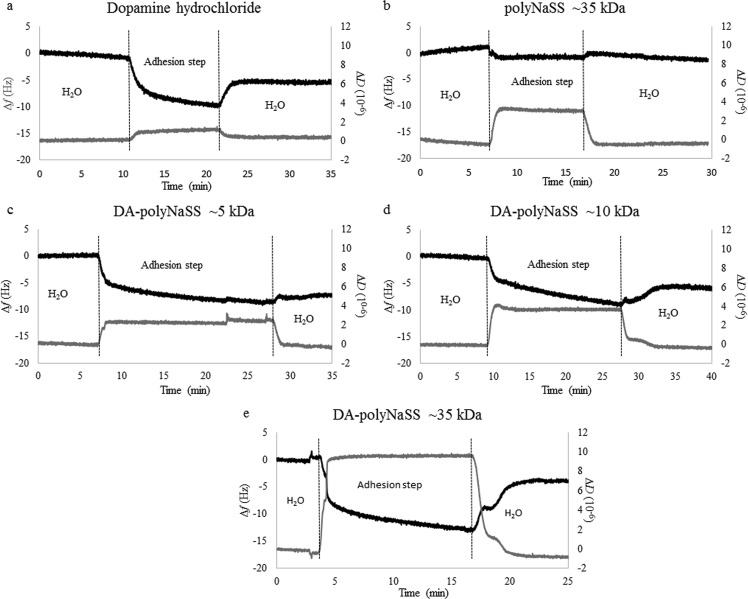
QCM-D also showed that DA was attached to the Ti surface. The QCM technique is well suited for in situ real time studies. The base is a quartz crystal that oscillates at a constant frequency when power is applied. As the mass of the crystal changes, so does the resonance frequency of the oscillation. Tracking the mass changes at a nanogram sensitivity allows the complete grafting reaction at surfaces to be followed. In combination with a switching system for changing the solutions, the use of a flow-cell QCM permits us to investigate the reversibility of the adsorption process by switching back and forth between an adsorbate-free and adsorbate-containing solution. Figure 3(a) shows the frequency and dissipation shifts observed when the Ti sensor is first exposed to the DA solution and then rinsed. Upon exposure to the DA solution, a rapid decrease in the frequency and an increase in the dissipation were observed. Upon rinsing, the frequency increased and the dissipation returned back to its value prior to adsorption. These results are consistent with a fraction of the DA molecules tightly adhered to the Ti surface (a frequency decrease of −4.5 Hz from before adsorption to after rinsing coupled with similar dissipation before adsorption and after rinsing). During the adsorption process, some weakly bound DA molecules are also likely to be present given the larger decrease in frequency and an increase in dissipation. The total amount of DA bound to the Ti surface calculated from the frequency change was 80 ng/cm2. Thus, the QCM-D, XPS, and ToF-SIMS results all show that DA was successfully attached to the Ti surface.
Fig. 3.
QCM-D analysis (the black line is the frequency change, Δf, and the gray line is the dissipation change, ΔD) of DA adhesion and polymer grafting onto Ti surfaces: (a) Dopamine acrylamide, (b) ∼35 kDa polyNaSS, (c) ∼5 kDa polyNaSS-SH, (d) ∼10 kDa polyNaSS-SH, and (e) ∼35 kDa polyNaSS-SH.
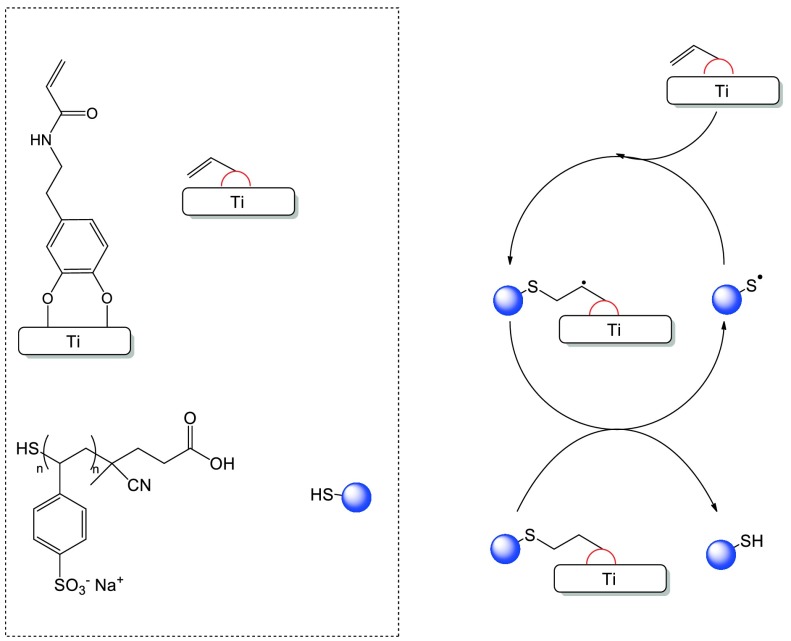
PolyNaSS-SH was coupled to the Ti-DA surface (Ti-DA-polyNaSS) via the thiol-ene reaction following the general procedure shown in Scheme 4. The thiol-ene reaction proceeds with the radical mediated addition of a thiol to the ene moiety via the alternation between thiol radical propagation across the ene functional group and the chain-transfer reaction. This mechanism involves abstraction of a hydrogen from the thiol by the carbon-centered radical.
Scheme 4.
Simplified mechanism for the preparation of the Ti-DA-polyNaSS sample by thiol-ene photopolymerization.
The Ti-DA-polyNaSS samples were generated at room temperature via 365 nm UV irradiation of a aqueous solution containing polyNaSS-SH, Ti-DA, and a photoinitiator (2,2′azobis(2-methylpropionamidine) dihydrochloride).
The thiol-ene polymerization between Ti-DA and polyNaSS-SH was monitored by XPS, ToF-SIMS, and QCM-D. The XPS results for the ∼5 kDa polyNaSS-SH in Table II show that after the thiol-ene reaction, the Ti, O, and N surface concentrations decreased while C, S and Na surface concentrations increased, consistent with the successful attachment of the polyNaSS-SH to the Ti-DA surface. Further evidence for the attachment of intact polyNaSS is that the XPS Na/S atomic ratio is within the experimental error of the expected value of 1. The Ti and N signals decrease due to the attenuation of the substrate signals by the polyNaSS-SH surface overlayer. The C, S, and Na signals increase due to their presence in the polyNaSS-SH surface overlayer. Although oxygen is present in both the Ti-DA surface and polyNaSS-SH, it has a higher concentration in Ti-DA, and therefore, the O signal decreases upon attachment of the polyNaSS-SH macromolecules. The standard deviations in Table II for the three major elements detected by XPS (C, O, and Ti) all increase in the order of Ti < Ti-DA < Ti-DA-polyNaSS-SH, indicating that the Ti surfaces functionalized with DA and polyNaSS-SH have greater spot-to-spot variations in composition compared to the starting titanium surface. This could be due the presence of some patchiness in the functionalized samples. Small amounts of F (∼1 at. %) on some spots of the Ti-DA-polyNaSS samples were detected.
After the coupling of polyNaSS-SH onto the Ti-DA surface, ToF-SIMS detected the increase in fragments characteristic of polyNaSS-SH (see Fig. 2, bottom). These included sodium containing positive secondary ions such as m/z = 22.99 (Na), m/z = 45.98 (Na2), m/z = 46.99 (Na2H), m/z = 77.97 (Na2O2), m/z = 89.96 (CO2Na2), m/z = 94.96 (Na2SOH), and m/z = 103.98 (C2H2O2Na2). The characteristic negative secondary ion peaks included sulfur containing fragments such as m/z = 31.97 (S), m/z = 55.97 (C2S), m/z= 86.96 (NaSO2), m/z = 102.95 (NaSO3), m/z = 155.99 (C6H4SO3), and m/z = 183.02 (C8H7SO3). In particular, the peak at m/z = 183.02 represents the mass of the NaSS monomer unit minus sodium (M-Na). Secondary ions characteristic of the titanium oxide surface (Ti, TiO, TiOH, etc.) were still detected from the Ti-DA-polyNaSS sample but at lower intensities compared to the Ti and Ti-DA samples. Given the ∼2 nm sampling depth of ToF-SIMS, this suggests that the polyNaSS layer does not completely cover the surface in the Ti-DA-polyNaSS samples. This is consistent with the XPS results that show an increased spot-to-spot variation in the composition of the Ti-DA-polyNaSS samples. Like the Ti and Ti-DA surfaces, trace levels of PDMS peaks were also detected by ToF-SIMS on the Ti-DA-polyNaSS surfaces.
The QCM-D results in Fig. 3 show the importance of the thiol group for grafting polyNaSS-SH onto the Ti-DA surface. Only small changes in the frequency and dissipation were observed when the Ti-DA surface was exposed to ∼35 kDa polyNaSS without a thiol end group [Fig. 3(b)], with most of these changes reversed during the rinsing step. In contrast, when the three polyNaSS-SH polymers were exposed to the Ti-DA surface [Figs. 3(c)–3(e)], QCM-D showed larger variations in frequency and dissipation, consistent with higher grafting efficiencies of the polyNaSS-SH polymers. In particular, after rinsing about 2×, more ∼35 kDa polyNaSS-SH was grafted to the Ti-DA surface than the ∼35 kDa polyNaSS (Table III).
Table III.
QCM-D results for attaching DA to the Ti surface and grafting polyNaSS and polyNaSS-SH macromolecules onto the Ti-DA surface.
| Samples | Δf (Hz) after grafting | Δf (Hz) after rinsing | Δm (ng cm−2) | nmol cm−2 | Molecules cm−2 |
|---|---|---|---|---|---|
| PolyNaSS-SH ∼5 kDa | −9.2 | −7.2 | 127 | 0.025 | 1.5 × 10¹³ |
| PolyNaSS-SH ∼10 kDa | −9.0 | −5.7 | 101 | 0.010 | 6.1 × 10¹² |
| PolyNaSS-SH ∼35 kDa | −13.8 | −4.4 | 78 | 0.0022 | 1.3 × 10¹² |
| PolyNaSS ∼35 kDa | −1.9 | −2.3 | 41 | 0.0011 | 7.0 × 10¹¹ |
| DA | −10.2 | −4.5 | 80 | 0.527 | 3.2 × 10¹⁴ |
Comparing the three polyNaSS-SH macromolecules, it was found that ∼35 kDa polyNaSS-SH had the largest changes in frequency and dissipation during the grafting step, but most of the frequency change was reversed during the rinsing step. The ∼5 and ∼10 kDa polyNaSS-SH macromolecules had smaller changes in frequency and dissipation during the grafting step. The ∼5 kDa polyNaSS-SH had the smallest change in frequency during the rinsing step. For all the poly(NaSS) macromolecules, any changes in dissipation that were observed during the grafting step were reversed during the rinsing step. The dissipation returning to its low value prior to grafting is consistent with the polymer remaining strongly attached to the surface after rinsing. The fact that the slight dissipation increases during the grafting step indicates that the film becomes more viscoelastic during this step, which suggests that some of the polyNaSS-SH macromolecules are only weakly interacting with the surface (most probably multilayer adsorption). These weakly interacting polyNaSS-SH macromolecules are then removed during the rinsing step. The ratio of Δf after rinsing to Δf after grafting, which is an estimate of the fraction of polyNaSS-SH that is tightly bound and grafted, decreases with the increasing molecular weight (∼5 kDa polyNaSS-SH = 0.78, ∼10 kDa polyNaSS-SH = 0.63, and ∼35 kDa polyNaSS-SH = 0.32). This shows the challenges encountered when grafting large molecular weight macromolecules onto surfaces. The Sauerbrey equation has been used to convert the frequency variation into a mass variation, given that the dissipation is relatively low (low ΔD/Δf ratio), and so, the model of laterally homogeneous films can be taken here: , where C = 17.7 ng cm−2 Hz and Δfn is the frequency variation for the nth overtone.
As expected, the smallest molecule (DA) has the highest molecular surface coverage; as measured by QCM-D, the dissipation is relatively low [see Fig. 2(a)] and the surface concentration relatively high in nmol/cm2 or molecules/cm2 (see Table III). The QCM-D results show that a significantly higher number of ∼5 kDa polyNaSS-SH macromolecules are grafted onto the Ti-DA surface compared to the other polymers, likely because of fewer steric effects from sulfonate groups along the macromolecular chain when grafting the smaller ∼5 kDa polyNaSS-SH. For example, dividing the molecular coverage of DA by the molecular coverage of all polymers shows that the number of DA molecules relative to the number of grafted macromolecules increases as 21 (∼5 kDa polyNaSS-SH) <53 (∼10 kDa polyNaSS-SH) <246 (∼35 kDa polyNaSS-SH) <457 (∼35 kDa polyNaSS). Although there are coverage variations that depend on the molecular weight, the results show that it is possible to graft architecture-controlled polymers of different molecular weights onto the Ti-DA surface.
C. In vitro biological response
1. Protein adsorption
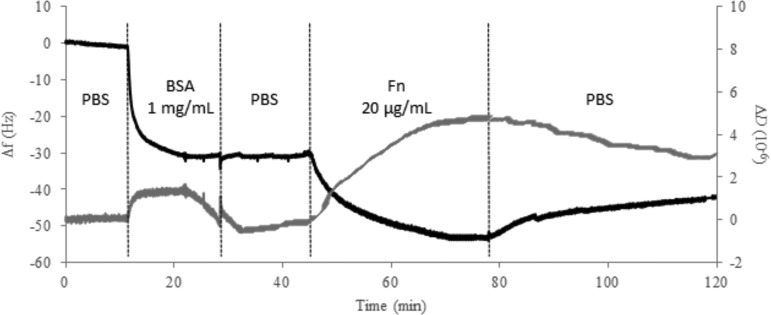
QCM-D was used to investigate the adsorption of BSA onto grafted ∼10 kDa polyNaSS-SH as well as the interactions of Fn with the BSA adsorbed, grafted film (Fig. 4). BSA is a blood protein that is used to block nonspecific protein adsorption on a wide range of surfaces and is typically one of the first proteins to adsorb onto a material when that material is placed in the biological environment. In the biological environment, large molecular weight blood proteins such as Fn, vitronectin, and fibrinogen, also called binding proteins, are described to arrive later and displace proteins that were initially adsorbed via the Vroman effect.48 In situ real-time BSA and Fn adsorption measurements such as the QCM-D allows are well adapted to follow protein adsorption on biocompatible metal surfaces such as Ti oxide surfaces.49–54
Fig. 4.
QCM-D frequency (Δf) and dissipation (ΔD) changes (fifth harmonic) with the time during the exposure to and rinsing of BSA (4000 μg/ml in PBS) and Fn (20 μg/ml in PBS) solutions with the ∼10 kDa polyNaSS-SH grafted Ti sensor at 37 °C and 0.2 ml/min.
The large change in frequency (∼30 Hz) observed upon exposure of the ∼10 kDa polyNaSS-SH grafted surface to the BSA solution corresponds to the adsorption of 531 ng/cm2 of BSA. The frequency does not change further upon rinsing, and the dissipation returned to its value prior to BSA adsorption. This shows that the adsorbed BSA layer forms a densely packed layer and it is not desorbed or altered by the buffer rinsing step. Upon exposure of the BSA adsorbed surface to the Fn solution, an additional decrease in the frequency (∼22 Hz) was observed, resulting in a further increase in the mass of the adsorbed protein film. There is also a significant increase in the dissipation upon exposure to the Fn solution, indicating an increase in the viscoelastic properties of the adsorbed protein film. Upon rinsing, some of the frequency and dissipation changes were reversed, indicating that some weakly bound proteins were removed during the rinsing step. However, the total amount of remaining adsorbed proteins was higher (708 ng/cm2) and the dissipation remained significantly higher than its value after BSA adsorption and rinsing. The increase in the adsorbed protein mass upon exposure to the Fn solution could be due to either adsorption of Fn onto BSA films or displacement of some fraction of the adsorbed BSA molecules with Fn molecules. Since QCM-D detects changes in mass, either process could be consistent with the observed frequency changes. However, from the Vroman effect, Fn is known to displace BSA, and it has been observed that Ti surfaces modified with a bioactive polymer have a higher affinity for Fn (Ka = 106) compared to BSA (Ka = 105).49 Thus, it is likely that the dominant process occurring is the displacement of adsorbed BSA by Fn. The higher dissipation values observed after Fn adsorption and rinsing would be consistent with a more upright orientation of the long Fn molecules, resulting in a more viscoelastic protein layer.
2. Initial cell adhesion (spreading and morphology)
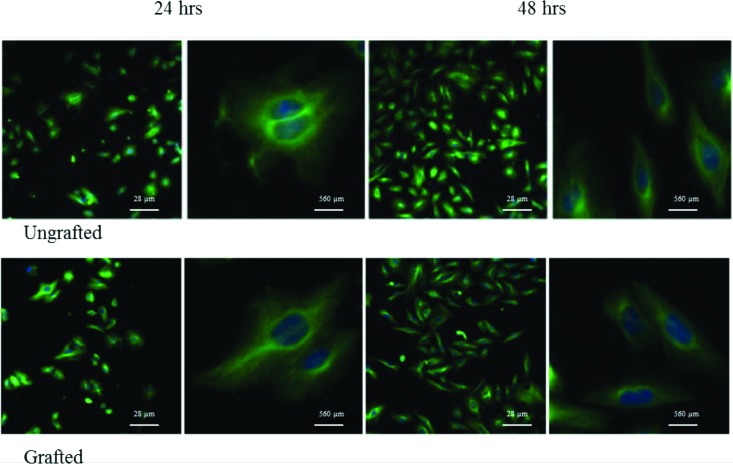
The initial adhesion of cells on ungrafted Ti and Ti-DA-polyNaSS surfaces was examined after 24 and 48 h of culturing by staining the cell cytoskeleton with tubulin antibody and the nuclei with 4′,6-diamidino-2-phenylindole (DAPI) to visualize the cells (Fig. 5). On both the grafted and ungrafted surfaces, the cells had attached and were well spread by 24 h. At this time point, they were polygonal in shape with cytoplasmic protrusions extending in all directions. By 48 h, the adherent cells became elongated on both surfaces.
Fig. 5.
Representative confocal images of Saos-2 cells cultured for 24 and 48 h on ungrafted and DA-polyNaSS grafted titanium surfaces (tubulin stained cells with DAPI).
3. Cell proliferation
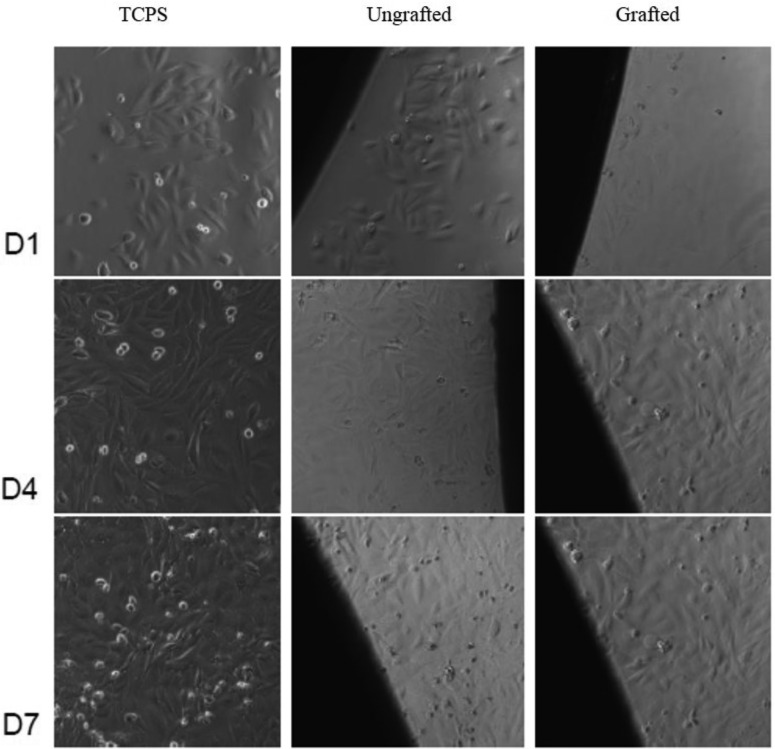
Cell proliferation on the Ti-DA-polyNaSS and ungrafted Ti surfaces was measured using MTT [(3-(4,5-dimethylthiazol-2-yl)-2,5-diphenyltetrazolium bromide)tetrazolium)] assay conducted over 7 days with time points at days 1, 4, and 7. Images were taken at each time point to check if the cells that had attached to the surface of wells around each wafer were affected by the presence of wafers (ie cytotoxicity check). An additional wafer for each surface was set up and stained with cell tracker green (CTG) on day 7 to check the cell morphology and distribution/coverage of cells on surfaces. The first outcome in this assay showed that cells attached to the TCPS wells around the wafers looked similar to the control TCPS wells, which indicated that there was no evidence of cytotoxicity in response to the presence of the wafers (Fig. 6).
Fig. 6.
Representative phase contrast images taken at days 1, 4, and 7 showed that cells were attached and spread onto the TCPS surface around each wafer and that the morphology of those cells was similar to the TCPS control surface (no wafer present) at each time point in the proliferation assay, which demonstrated that neither the grafted (Ti-DA-polyNaSS) nor ungrafted (Ti) wafers were cytotoxic to cells over the 7 day period of exposure (phase contrast images).
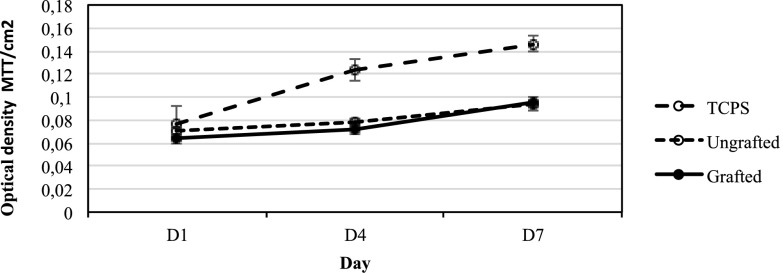
Cell proliferation data over 7 days (Fig. 7) showed that the cells on both the grafted and ungrafted Ti surfaces supported steady proliferation over the 7 day period of the assay to equivalent levels on both surfaces. Both were less than the TCPS control, which is not unexpected since TCPS is purposefully designed to enhance cell adhesion and proliferation. This outcome was consistent with expectations based on data from the initial cell adhesion assay (as shown in Fig. 5) and served to further confirm that neither surface was cytotoxic (as shown in Fig. 6).
Fig. 7.
Proliferation of cells on grafted (Ti-DA-polyNaSS) and ungrafted (Ti) surfaces measured by MTT assay conducted at time points of 1, 4, and 7 days [data are based on triplicate samples of each wafer included at each of the three time points ± standard deviation mean (SDM)].
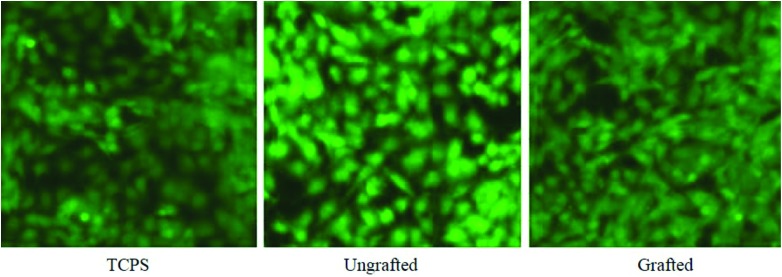
On day 7 of the proliferation assay, an extra sample of each surface with adherent cells was stained with CTG, a fluorescent tag for living cells, to enable visualization of the cell cover on the opaque surfaces. Images of CTG stained cells attached to wafers on day 7 confirmed substantial levels of cell attachment and growth on all the grafted and ungrafted surfaces, which was similar to the appearance of cells in TCPS control wells (Fig. 8).
Fig. 8.
Representative fluorescence images of adherent cells on control TCPS, ungrafted (Ti), and grafted (Ti-DA-polyNaSS) Ti surfaces on day 7 of the proliferation assay (CTG stained cells at 20× magnification).
4. Cell differentiation and mineralization at day 25
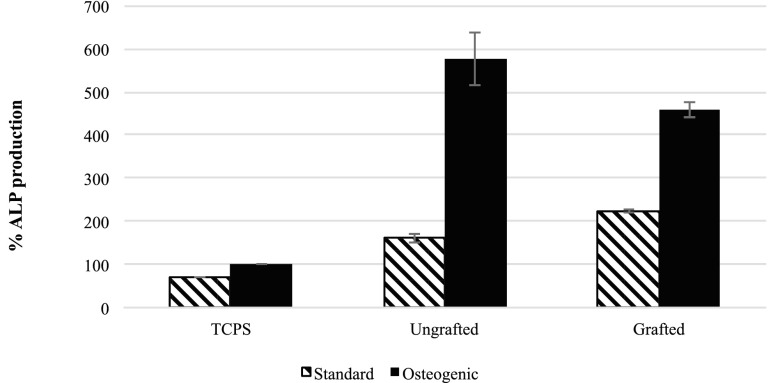
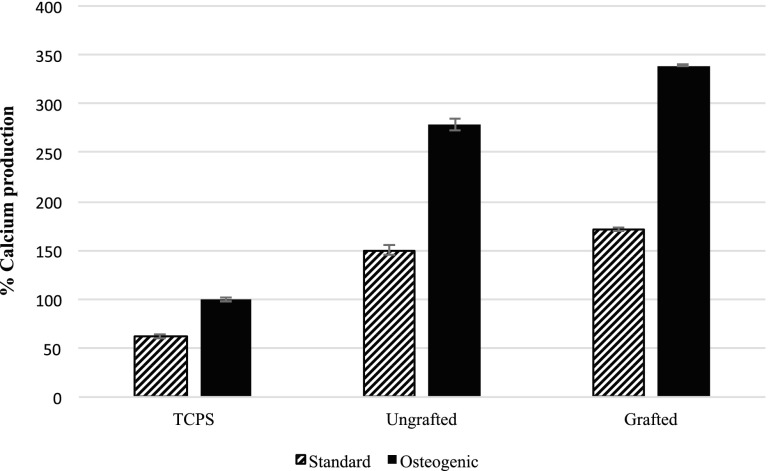
Differentiation of cells was evaluated using assays41,42 to measure calcium and ALP in cells adherent to each surface that had been maintained in two different culture regimes (standard and osteogenic) for 25 days. In parallel, an MTT assay was conducted on day 25 to evaluate cell numbers on each of the surfaces that enabled ALP and calcium data to be adjusted for the number of cells that were attached to each surface. Outcomes of ALP and calcium assays (Figs. 8 and 9) showed that culturing cells under osteogenic conditions promoted the production of both ALP and calcium by the cells compared to that produced by cells maintained on standard culture conditions over the 25 day period of the assay. Cells on the ungrafted surfaces produced more ALP than those on the grafted surfaces in osteogenic conditions, showing that they were in an earlier stage of differentiation than the cells on the grafted surfaces (Fig. 9). Cells on the grafted surfaces produced more calcium than those on ungrafted surfaces under osteogenic conditions (Fig. 10), revealing that they were in the more highly differentiated state and were in the process of mineralizing their matrix.
Fig. 9.
ALP produced by cells adherent to the control TCPS, grafted (Ti-DA-polyNaSS), and ungrafted Ti surfaces (data represent the mean of triplicate samples of each surface corrected for the cell number as measured using MTT assay run in parallel over 25 days and normalized to production by cells on control TCPS under osteogenic conditions ± SDM).
Fig. 10.
Calcium produced by cells adherent to the grafted (Ti-DA-polyNaSS) and ungrafted Ti surfaces (data represent the mean of triplicate samples of each surface corrected for the cell number as measured using MTT assay run in parallel over 25 days and normalized to production by cells on control TCPS under osteogenic conditions ± SDM).
IV. CONCLUSIONS
We have described a new approach to graft bioactive polymers with a well-defined molecular weight onto Ti surfaces. This approach uses a catechol molecule, which plays the role of an anchor molecule and acts as a linker between the polymer and the Ti surface. This strategy can be divided into two main steps: (1) adhesion of the anchor molecule (DA) onto Ti surfaces and (2) grafting of architecture controlled polymers (polyNaSS-SH) onto the DA coated Ti surfaces via click chemistry. Each step was characterized to confirm the presence of DA and polyNaSS on the Ti surfaces before the preliminary assessment of the biological response. The polyNaSS grafted surfaces adsorbed a densely packed layer of BSA, a fraction of which was then displaced by Fn. In vitro biological assays conducted with a human bone cell line showed that the grafted Ti surfaces are not cytotoxic and exhibit biocompatibility at least as equivalent to the untreated Ti control.
ACKNOWLEDGMENTS
The authors specially thank Gerry Hammer (NESAC/BIO) for his help with the XPS analysis and Dan Graham (NESAC/BIO) for his help with the ToF-SIMS analysis. The XPS and ToF-SIM experiments done at NESAC/BIO were supported by NIBIB Grant No. EB-002027. This research was supported by the French Ministry of National Education, Higher Education and Research.
References
- 1. Leyens C. and Peters M., Titanium and Titanium Alloys: Fundamentals and Applications, edited by Leyens C. and Peters M. ( Wiley-VCH, Weinheim, 2003), Vol. 1. [Google Scholar]
- 2. Long M. and Rack H. J., Biomaterials 19, 1621 (1998). 10.1016/S0142-9612(97)00146-4 [DOI] [PubMed] [Google Scholar]
- 3. Esposito M., Hirsch J. M., Lekholm U., and Thomsen P., Eur. J. Oral Sci. 106, 527 (1998). 10.1046/j.0909-8836..t01-2-.x [DOI] [PubMed] [Google Scholar]
- 4. Roos-Jansaker A. M., Renvert S., and Egelberg J., J. Clin. Periodontol. 30, 467 (2003). 10.1034/j.1600-051X.2003.00296.x [DOI] [PubMed] [Google Scholar]
- 5. Kasemo B. and Lausamaa J., Int. J. Oral Maxillofac. Implants 3, 247 (1988). [PubMed] [Google Scholar]
- 6. Michiardi A., Hélary G., Nguyen P. C. T., Gamble L. J., Anagnostou F., Castner D. G., and Migonney V., Acta Biomater. 6, 667 (2010). 10.1016/j.actbio.2009.08.043 [DOI] [PMC free article] [PubMed] [Google Scholar]
- 7. Klabunde Windler M., Titanium in Medicine: Material Science, Surface Science, Engineering, Biological Responses and Medical Applications, edited by Brunette D. M., Tengvall T. P., Textor M., and Thomsen P. ( Springer-verlag, Berlin, 2001), p. 703. [Google Scholar]
- 8. Schwartz Z., Avaltroni M. J., Danahy M. P., Silverman B. M., Hanson E. L., Schwarzbauerb J. E., Midwoodb K. S., and Gawalt E. S., Mater. Sci. Eng. C 23, 395 (2003). 10.1016/S0928-4931(02)00310-7 [DOI] [Google Scholar]
- 9. Puelo A. and Nanci A., Biomaterials 20, 2311 (1999). 10.1016/S0142-9612(99)00160-X [DOI] [PubMed] [Google Scholar]
- 10. Liu X., Chu P. K., and Ding C., Mater. Sci. Eng. 47, 49 (2004). 10.1016/j.mser.2004.11.001 [DOI] [Google Scholar]
- 11. El Khadali F., Hélary G., Pavon-Djavid G., and Migonney V., Biomacromolecules 3, 51 (2002). 10.1021/bm015563x [DOI] [PubMed] [Google Scholar]
- 12. Anagnostou F., Debet F., Pavon-Djavid G., Goudaby Z., Hélary G., and Migonney V., Biomaterials 27, 3912 (2006). 10.1016/j.biomaterials.2006.03.004 [DOI] [PubMed] [Google Scholar]
- 13. Felgueiras H., Evans M., and Migonney V., Acta Biomater. 28, 225 (2015). 10.1016/j.actbio.2015.09.030 [DOI] [PubMed] [Google Scholar]
- 14. Felgueiras H. and Migonney V., IRBM 37, 165 (2016). 10.1016/j.irbm.2016.03.006 [DOI] [Google Scholar]
- 15. Migonney V., Hélary G., and Noirclere F., WO patent 2007/141460 A3 (7 June 2006).
- 16. Hélary G., Noirclere F., Mayingi J., and Migonney V., Acta Biomater. 5, 124 (2009). 10.1016/j.actbio.2008.07.037 [DOI] [PubMed] [Google Scholar]
- 17. Hélary G., Noirclere F., Mayingi J., Bacroix B., and Migonney V., J. Mater. Sci. Mater. Med. 21, 655 (2010). 10.1007/s10856-009-3892-0 [DOI] [PubMed] [Google Scholar]
- 18. Kerner S., Migonney V., Pavon-Djavid G., Hélary G., Sedel L., and Anagnoustou F., J. Mater. Sci. Mater. Med. 21, 707 (2010). 10.1007/s10856-009-3928-5 [DOI] [PubMed] [Google Scholar]
- 19. Falentin-Daudré C., Migonney V., Chouirfa H., and Baumann J. S., WO patent PCT/EP2016/068909 (7 August 2015).
- 20. Chouirfa H., Migonney V., and Falentin-Daudré C., RSC Adv. 6, 13766 (2016). 10.1039/C5RA24497H [DOI] [Google Scholar]
- 21. Foster R. N., Harrison E. T., and Castner D. G., Langmuir 32, 3207 (2016). 10.1021/acs.langmuir.5b04743 [DOI] [PMC free article] [PubMed] [Google Scholar]
- 22. Foster R. N., Johansson P. K., Tom N., Koelsh P., and Castner D. G., J. Vac. Sci. Technol., A 33, 05E131 (2015). 10.1116/1.4929506 [DOI] [PMC free article] [PubMed] [Google Scholar]
- 23. Foster R. N., Keefe A. J., Jiang S., and Castner D. G., J. Vac. Sci. Technol., A 31, 06F103 (2013). 10.1116/1.4819833 [DOI] [PMC free article] [PubMed] [Google Scholar]
- 24. Sciannamea V., Jerome R., and Detrembleur C., Chem. Rev. 108, 1104 (2008). 10.1021/cr0680540 [DOI] [PubMed] [Google Scholar]
- 25. Matyjaszewski K. and Xia J., Chem. Rev. 101, 2921 (2001). 10.1021/cr940534g [DOI] [PubMed] [Google Scholar]
- 26. Chiefari J. et al. , Macromolecules 31, 5559 (1998). 10.1021/ma9804951 [DOI] [Google Scholar]
- 27. Minko S., Polymer Surfaces and Interfaces, edited by Stamm M. ( Springer, Berlin, 2008), Vol. 215, pp. 215–234. [Google Scholar]
- 28. Porté-Durieu M. C., Biomaterials 25, 4837 (2004). 10.1016/j.biomaterials.2003.11.037 [DOI] [PubMed] [Google Scholar]
- 29. Jia X., Jiang X., Liu R., and Yin J., Macromol. Chem. Phys. 210, 1876 (2009). 10.1002/macp.200900291 [DOI] [Google Scholar]
- 30. Viornery C., Chevolot Y., Léonard D., Aronsson B. O., Péchy P., Mathieu H. J., Descouts P., and Grätzel M., Langmuir 18, 2582 (2002). 10.1021/la010908i [DOI] [Google Scholar]
- 31. Adden N., Gamble L. J., Castner D. G., Hoffmann A., Gross G., and Menzel H., Langmuir 22, 8197 (2006). 10.1021/la060754c [DOI] [PMC free article] [PubMed] [Google Scholar]
- 32. Zoulalian V., Monge S., Zürcher S., Textor M., Robin J. J., and Tosatti S., J. Phys. Chem. B 110, 25603 (2006). 10.1021/jp066811s [DOI] [PubMed] [Google Scholar]
- 33. White M. A., Maliakal A., Turro N. J., and Koberstein J., Macromol. Rapid Commun. 29, 1544 (2008). 10.1002/marc.200800346 [DOI] [Google Scholar]
- 34. Faure E., Falentin-Daudré C., Jérôme C., Lykawa J., Fournier D., Woisel P., and Detrembleur C., Prog. Polym. Sci. 38, 236 (2013). 10.1016/j.progpolymsci.2012.06.004 [DOI] [Google Scholar]
- 35. Sedo J., Saiz-Poseu J., Busqué F., and Ruiz-Molina D., Adv. Mater. 25, 653 (2013). 10.1002/adma.201202343 [DOI] [PubMed] [Google Scholar]
- 36. Ye Q., Zhou F., and Liu W., Chem. Soc. Rev. 40, 4244 (2011). 10.1039/c1cs15026j [DOI] [PubMed] [Google Scholar]
- 37. Fan X., Lin L., Dalsin J. L., and Messersmith P. B., J. Am. Chem. Soc. 127, 15843 (2005). 10.1021/ja0532638 [DOI] [PubMed] [Google Scholar]
- 38. Liu J., Yang W., Zareie H. M., Gooding J. J., and Davis T. P., Macromolecules 42, 2931 (2009). 10.1021/ma802256g [DOI] [Google Scholar]
- 39. Watson M. A., Lyskawa J., Zobrist C., Fournier D., Jimenez M., Traisnel M., Gengembre L., and Woisel P. A., Langmuir 26, 15920 (2010). 10.1021/la102688m [DOI] [PubMed] [Google Scholar]
- 40. Barras A., Lyskawa J., Szunerits S., Woisel P., and Boukherroub R., Langmuir 27, 12451 (2011). 10.1021/la202571d [DOI] [PubMed] [Google Scholar]
- 41. Prideaux M., Wijenayaka A. R., and Kumarasinghe D. D., Calcif. Tissue Int. 95, 183 (2014). 10.1007/s00223-014-9879-y [DOI] [PubMed] [Google Scholar]
- 42. Czekanska E. M., Stoddart M. J., Ralphs J. R., Richards R. G., and Hayes J. S., J. Biomed. Mater. Res. A 102, 2636 (2014). 10.1002/jbm.a.34937 [DOI] [PubMed] [Google Scholar]
- 43. Scales C. W., Convertine A. J., and McCormick C. L., Biomacromolecules 7, 1389 (2006). 10.1021/bm060192b [DOI] [PubMed] [Google Scholar]
- 44. Chong Y. K., Moad G., Rizzardo E., and Thang S. H., Macromolecules 40, 4446 (2007). 10.1021/ma062919u [DOI] [Google Scholar]
- 45. Willcock H. and O'Reilly R., Polym. Chem. 1, 149 (2010). 10.1039/B9PY00340A [DOI] [Google Scholar]
- 46. Ratner B. D. and Castner D. G., “ Electron spectroscopy for chemical analysis,” in Surface Analysis—The Principal Techniques, 2nd ed., edited by Vickerman J. C. and Gilmore ( Wiley, Chichester, 2009), pp. 47–112. [Google Scholar]
- 47. Belu A., Graham D. J., and Castner D. G., Biomaterials 24, 3635 (2003). 10.1016/S0142-9612(03)00159-5 [DOI] [PubMed] [Google Scholar]
- 48. Norde W., Horbett T. A., and Brash J. L., “ Proteins at interfaces III: Introductory overview,” in Proteins at Interfaces III State of the Art, ACS Symposium Series Vol. 1120 ( American Chemical Society, Washington D.C., 2012), pp. 1–34. [Google Scholar]
- 49. Felgueiras H. P., Murthy N. S., Sommerfeld S. D., Bras M. M., Migonney V., and Kohn J., ACS Appl. Mater. Interfaces 8, 13207 (2016). 10.1021/acsami.5b12600 [DOI] [PMC free article] [PubMed] [Google Scholar]
- 50. Ithurbide A., Frateur I., Galtayries A., and Marcus P., Electrochim. Acta 53, 1336 (2007). 10.1016/j.electacta.2007.04.109 [DOI] [Google Scholar]
- 51. Payet V., Brunner S., Galtayries A., Frateur I., and Marcus P., Surf. Interface Anal. 40, 215 (2008). 10.1002/sia.2655 [DOI] [Google Scholar]
- 52. Payet V., Dini T., Brunner S., Galtayries A., Frateur I., and Marcus P., Surf. Interface Anal. 42, 457 (2010). 10.1002/sia.3298 [DOI] [Google Scholar]
- 53. Isaac J., Galtayries A., Kizuki T., Kokubo T., Berdal A., and Sautier J.-M., Eur. Cells Mater. J. 20, 178 (2010). 10.22203/eCM.v020a15 [DOI] [PubMed] [Google Scholar]
- 54. Lefaix H., Galtayries A., Prima F., and Marcus P., Colloids Surf., A 439, 207 (2013). 10.1016/j.colsurfa.2013.04.009 [DOI] [Google Scholar]
- 55.See supplementary material at http://dx.doi.org/10.1116/1.4985608E-BJIOBN-12-345702 for detailed experimental data (organic synthesis, polymer synthesis, and coupling reaction), NMR spectra, size exclusion chromatography traces, and biological assay conditions.
Associated Data
This section collects any data citations, data availability statements, or supplementary materials included in this article.
Data Citations
- See supplementary material at http://dx.doi.org/10.1116/1.4985608E-BJIOBN-12-345702 for detailed experimental data (organic synthesis, polymer synthesis, and coupling reaction), NMR spectra, size exclusion chromatography traces, and biological assay conditions.


