

Abstract
Purpose
Central vein point-of-care ultrasonography must be reproducible to detect intravascular volume changes. We sought to determine which measurement step – image acquisition or interpretation – could be more compromising for reproducibility.
Methods
Three investigators each acquired inferior vena cava (IVC) and internal jugular (IJV) vein ultrasonographic sequences (US) from a convenience sample of 21 hospitalized general medicine participants and then interpreted each US three separate times. We partitioned the random errors of acquisition and interpretation, attributing wider dispersions of each to larger reductions in reproducibility.
Results
We analyzed 351 interpretations of 39 IVC and 432 interpretations of 48 IJV US. Reproducibility of the maximum (standard error of measurement [SEM] 3.3 mm [95% CI 2.7 to 4.2 mm]) and minimum (4.8 mm [3.9 to 6.3 mm]) IVC diameter measurements were worse than that of the mediolateral (2.5 mm [2.0 to 3.2 mm]) and anteroposterior (2.5 mm [2.0 to 3.1 mm]) IJV diameters. The dispersions of random measurement errors were wider among acquisitions than interpretations.
Conclusions
Among our investigators, central vein diameter measurements obtained by point-of-care ultrasonography are not sufficiently reproducible to distinguish clinically meaningful intravascular volume changes from measurement errors. Reproducibility could be most effectively improved by reducing the random measurement errors of acquisition.
Keywords: ultrasonography, multilevel analysis, reproducibility of results, blood volume assessment, point-of-care systems
Introduction
For common acute medical conditions, such as shock and heart failure, hospital-based providers spend considerable time iteratively tailoring treatments to ongoing changes in intravascular volume.1 Unfortunately, conventional methods of assessing intravascular volume are notoriously unreliable,2 and patients are often under- or overtreated.3 Ultrasound examination (US) of the central veins can track intravascular volume,4 but iterative referral US — where a sonographer repeatedly acquires images for immediate interpretation by a physician — are not really compatible with the every-day practice. In contrast, iterative point-of-care US — where the same clinician who is directing therapy (often a hospitalist or intensivist) also acquires and interprets images at each patient’s bedside in real time — is a more realistic approach.5
In order to detect clinically meaningful changes in intravascular volume, central vein measurements obtained by point-of-care US must be reproducible, i.e., measurement errors must be small enough so that repeated measurements, independently obtained on stable patients, closely agree. When clinically meaningful changes cannot be detected because measurement errors are too large, the different steps in the measurement process can be separated so that their contributions to these errors can be quantified.6 For central vein measurements obtained by point-of-care US, the steps of image acquisition and interpretation — although seemingly conjoined when performed contemporaneously — can be deliberately separated to examine how each affects reproducibility.
We aimed to first determine the reproducibility of 4 diameter measurements commonly used in central vein point-of-care US. For each of these measurements, we then separately analyzed the measurement errors of acquisition and interpretation to determine which step had a greater effect on reproducibility.
Materials and Methods
Setting and Participants
After approval by our Committee on the Protection of Human Subjects, we conducted this observational cross-sectional study at a 76-bed rural Veterans Affairs Hospital in White River Junction, Vermont, in October 2015. Study investigators identified a convenience sample of spontaneously-breathing adult general medicine patients who were present in their hospital rooms when investigators were available. They excluded patients who could not comfortably lie supine, who were experiencing abdominal or neck pain, or who had undergone abdominal or neck surgery within the prior month. Given that we collected no identifying information, participants provided only verbal informed consent. Our three study investigators were preparing for future research in central vein US. One was board-certified in internal medicine; the other two were clinical research associates. All three underwent a point-of-care US training program that focused on central veins.7
Ultrasound Acquisition Protocol
Each participant was examined by the three investigators in random order. The first investigator positioned the participant supine and encouraged relaxed, regular breathing. To shorten the intervals between acquisitions of the same type and to minimize participant repositioning, all three investigators acquired US of the inferior vena cava (IVC) before proceeding further. The participant’s head was then positioned in the midline and without pillows to avoid head flexion, extension, or rotation, which may inadvertently compress the internal jugular vein (IJV).8 Throughout acquisitions of images of both veins by all three investigators, participants were asked not to change their position or the incline of their bed.9 The other investigators remained outside the participant’s hospital room while awaiting their respective turn and did not discuss acquisitions until all were complete.
Two-dimensional (B-mode) gray scale 10-second video sequences were acquired with the M-TurboTM ultrasound system (Fujifilm Sonosite Inc., Bothwell, Washington). The IVC was scanned in its longitudinal axis from the subcostal window with a 1 to 5 MHz phased-array 21 mm transducer. Visualization of the IVC was confirmed by its entry into the right atrium, by the inlet of a hepatic vein, and by identification of the aorta lying more posteriorly and medially.
The right IJV was scanned in its transverse axis with a 6 to 13 MHz linear 25 mm transducer. The IJV was distinguished from the common carotid artery by applying a short burst of gentle pressure to compress (or ‘wink’) the vein. The examiner positioned the transducer lateral to the cricoid cartilage where valves are absent and vein compliance is not directly affected by the negative intrathoracic pressure of the chest cavity.10 The transducer was held perpendicular to the surface of the neck with as little pressure as possible.
Ultrasound Interpretation Protocol
Video sequences were transferred as MPEG-4 files to a desktop computer and all identifying information was removed to ensure that investigators were blinded to the participant and to whom acquired the US. All interpretable US of both veins were pooled, randomly ordered, and separately interpreted by each examiner three times. Because each pooled set took several days to complete, repeated interpretations of the same US did not occur on the same day.
Video sequences were replayed on Windows Media Player Version 12 (Microsoft Corporation, Redmond, WA). Investigators scaled the dimensions obtained from the computer monitor back to participants’ actual dimensions as follows: First a hand-held ruler with digital readout (CapriTM Tools, Pamona, CA) was held directly to the monitor to measure the distance between depth markers, which was divided by the displayed length to obtain the scale ratio of actual to on-screen length. Luminal diameters (from inner edge to inner edge) were then measured by holding the ruler to the computer monitor and multiplied by the scale ratio to convert on-screen to actual vein diameters (in mm).
Examiners measured the IVC 3 to 4 cm distal (caudal) from the right atrium junction or 1 to 2 cm distal from the hepatic vein inlet, where it is more compliant than proximally11 and is often more easily detectable than distally. While focused on this location, the video sequence was advanced frame by frame until the frames capturing the maximal (Fig. 1A) and minimum (Fig. 1B) diameter were identified. These frames displayed the IVC at end-expiration and -inspiration, respectively, during spontaneous breathing. Both diameters were measured perpendicular to the anterior wall.
Figure 1.
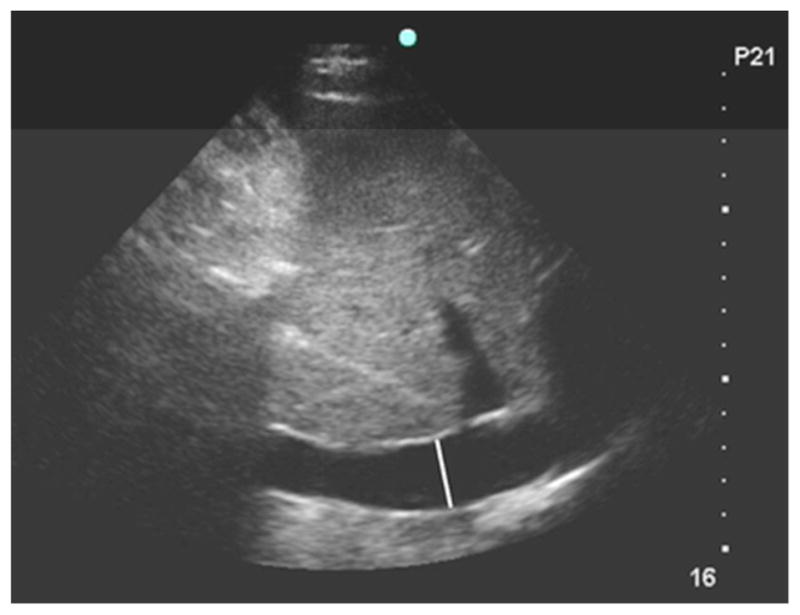
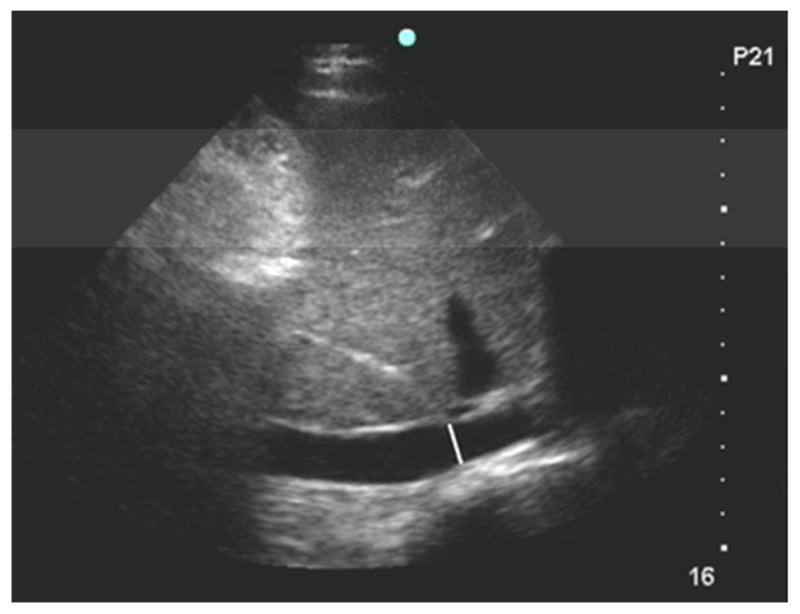
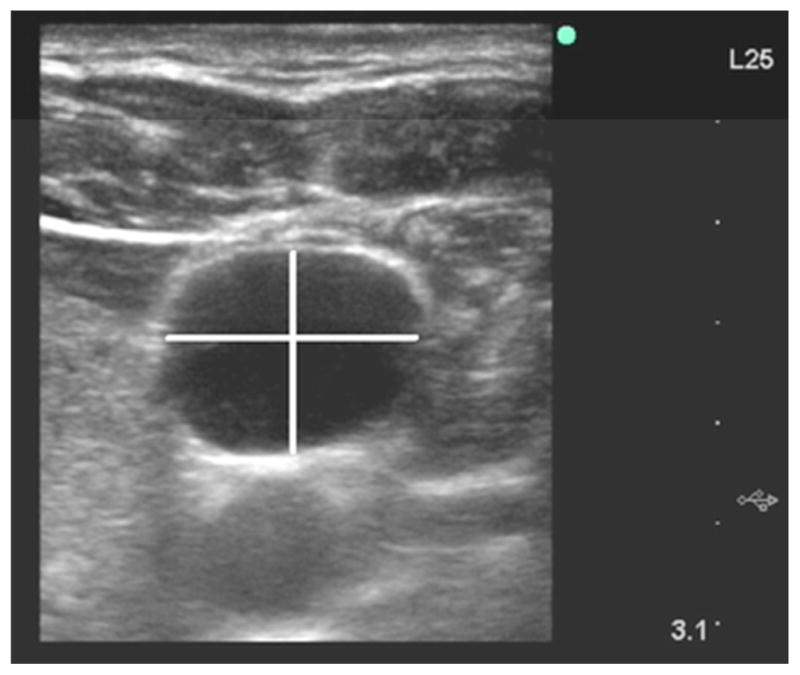
Figure 1A. Ultrasound of inferior vena cava at end-expiration. The white line is the maximum luminal diameter 3.5 cm distal to the right atrium junction and perpendicular to the anterior wall.
Figure 1B. Ultrasound of the inferior vena cava at end-inspiration. The white line is the minimum luminal diameter 3.5 cm distal to the right atrium junction and perpendicular to the anterior wall.
Figure 1C. Ultrasound of the right internal jugular vein at end-expiration. The horizontal white line is the largest mediolateral diameter. The vertical white line is the anteroposterior diameter; it is centered on the mediolateral diameter and is perpendicular to it.
For the IJV, investigators identified the frame where the lumen was at its largest cross-sectional area, corresponding to end-expiration during spontaneous breathing; both the mediolateral and anteroposterior diameters were measured from this frame (Fig. 1C). To standardize measurement of eccentrically-shaped veins, and to account for transducers that were not placed perpendicular to the true circumference of the neck due to abundant skin folds or adiposity, the largest mediolateral diameter was measured first. The anteroposterior diameter was then measured perpendicular to the mediolateral diameter at its midway point.
Outcomes
We derived our outcomes from the modeled variances of vein diameter measurements. Total measurement variance was the sum of between- and within-participant measurement variances,6 after adjusting for the effect of our investigators as acquirers and interpreters (see Analysis below). Because these adjustments effectively remove investigators’ systematic errors, within-participant variance reflects random errors.
Reproducibility was the agreement between measurements obtained from different US of the same stable participants. We quantified it as the standard error of measurement (SEM), calculated as the square root of the within-participant variance.12 We converted the SEM into the minimal detectable change by multiplying by 2 factors. Because vein diameters are normally distributed,13 we first multiplied by the z-score for the central 95% of the area under the standard normal curve (1.96).14 Second, because our acquisitions were independent of each other, we multiplied by the square root of 2, a factor required when comparing 2 independent measurements that each have their own uncertainties.
We separated within-participant variance into components attributable to acquisition and interpretation and represented each as a proportion. The intraclass correlation coefficient (ICC) is the proportion of total random variance attributable to participants. Because we did not include the systematic differences due to investigators in this variance, ours is a so-called consistency ICC.15 After subtracting the ICC from 1.0, what remained was the proportion of total measurement variance attributable to our investigators’ random measurement errors.
Statistical Analysis
For each diameter measurement, we constructed a separate mixed-effects multilevel model with random-effects representing each level of our hierarchical data structure: participants at level 3, acquisitions at level 2, and interpretations at level 1 (Fig. 2). Fixed-effects accounted for investigators acting as acquirers at level 2 and interpreters at level 1. While these fixed-effects were investigator-specific, random-effects were weighted-averages (so-called random-intercepts) representing the acquisitions or interpretations of all three investigators. For model estimation, we used the runmlwin16 command from within Stata, version 14 (StataCorp, College Station, TX) to run Markov chain Monte Carlo procedures in MLwiN software, version 2.35 (Centre for Multilevel Modeling, Bristol, UK). When non-informative priors are used, these procedures are numerically equivalent to those based on maximum likelihood.17
Figure 2. Multi-level Data Structure and Sources of Modeled Variances.

This diagram represents the relationships between various groupings in our dataset and how we conceptualized the variabilities in measurement errors across these groupings. We removed examiner-specific systematic measurement errors of acquisitions and interpretations in our models by using fixed-effects; the remaining random measurement errors were weighted averages of all three examiners (so-called random intercepts). Circles represent participants while hexagons, squares, and pentagons represent examiner-specific ultrasounds at level 2 or examiner-specific interpretations at level 1. Solid-line connectors represent nested (or hierarchical) relationships. Dotted-line rectangles enclose the sources of random measurement error due to acquisition and interpretation, and the sum of both sources equals the total random measurement error.
Results
Participants
Each of the 21 enrolled participants was assigned a letter from A to U. All 3 examiners were unable to adequately visualize the IVC for 5 patients (L, M, Q, S, and U; Fig. 3a), and the right IJV for 3 participants (L, M, and T; Fig. 3b). We excluded 9 IVC US among 7 unique participants (A, D, F, J, H, P, and T) because of overall poor quality (n = 4), inadequate visualization of the measurement target locations (n = 4), or because the aorta but not the IVC was recorded (n = 1) (Fig. 3c). We excluded 6 IJV US among 6 unique participants (A, C, D, E, H, and S) because all (n = 4) or a portion (n = 1) of the vein was missed or because 2 veins were visualized (n = 1) (Fig. 3d). Thus, we obtained a set of complete 39 IVC US from 16 participants (mean 2.4 US per participant, interquartile range [IQR] 2 to 3; Fig. 3e) and 48 interpretable IJV US from 18 participants (mean 2.7 US per participant, IQR 2 to 3) (Fig. 3f). Because each investigator interpreted each US 3 times (Fig. 3g), in total we analyzed 351 IVC and 432 IJV US. Participants’ adjusted mean IVC maximum and minimum diameters suggested an average intermediate central venous pressure,18 but participant heterogeneity was high, with ICCs suggesting that 50% or more of total measurement variance was attributable to the participants themselves (Table 1).
Figure 3.
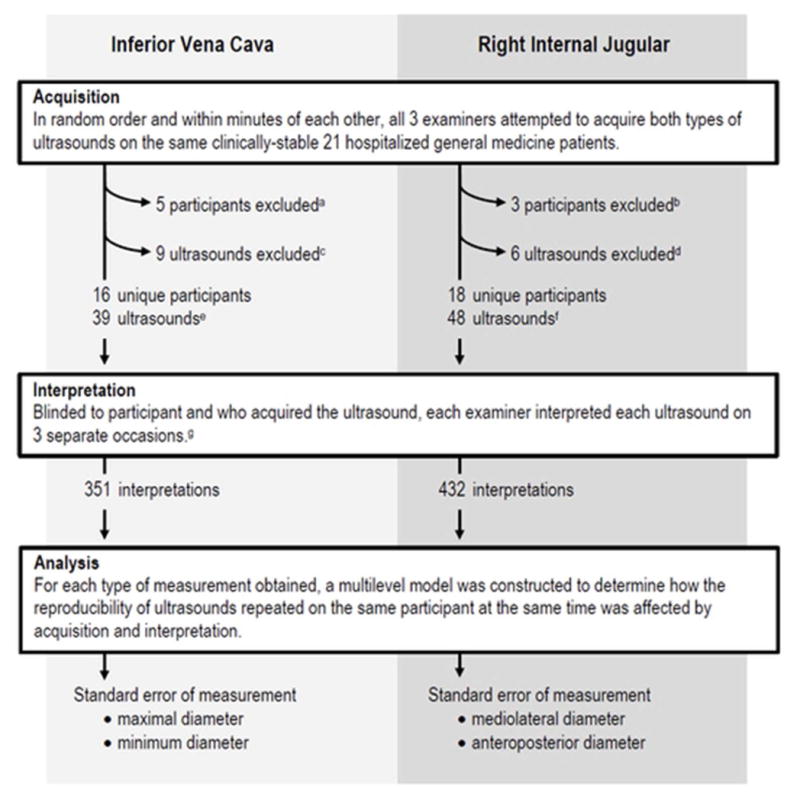
Flow diagram of inferior vena cava and right internal jugular ultrasound examinations (see text for details).
Table 1.
Summary of ultrasound measurements
| Inferior Vena Cava | Right Internal Jugular | |||
|---|---|---|---|---|
|
| ||||
| Maximum | Minimum | Mediolateral | Anteroposterior | |
| Adjusted mean (95% CI),* mm | 16.0 (13.2 to 18.7) | 10.4 (7.0 to 13.8) | 14.5 (12.0 to 17.0) | 11.5 (9.6 to 13.4) |
| Intraclass correlation coefficient | 0.64 (0.38 to 0.84) | 0.50 (0.15 to 0.75) | 0.76 (0.56 to 0.89) | 0.62 (0.37 to 0.82) |
| Standard error of measurement (95% CI), mm | 3.3 (2.7 to 4.2) | 4.8 (3.9 to 6.3) | 2.5 (2.0 to 3.2) | 2.5 (2.0 to 3.1) |
| Minimal detectable change (95% CI),† mm | 9.1 (7.6 to 11.6) | 13.3 (10.9 to 17.5) | 6.9 (5.5 to 8.9) | 6.8 (5.5 to 8.7) |
| Reported changes in intravascular volume found in the literature | ||||
| Blood donation of 1 unit (500 cc), mean (95% CI), mm | −5.5 (−4.3 to −6.3) | −5.2 (−4.2 to −5.9) | −1.7 (−0.7 to −2.7) | −1.3 (−0.3 to −2.3) |
| Treatment throughout hospitalization for acute heart failure, mean (95% CI), mm | −3.2 (−1.8 to −4.2) | −3.0 (−1.9 to −4.5) | NR | NR |
| Intravenous infusion (10 cc/kg) of crystalloid, mean (95% CI), mm | +2.6 (+0.8 to +4.5) | +4.3 (+2.4 to +6.3) | NR | NR |
CI = confidence interval. NR = not reported.
Means were adjusted for repeated acquisitions and interpretations by 3 different examiners. See details and reference in text.
Note that minimal detectable changes were statistically significantly different than corresponding reported changes: 95% confidence intervals did not overlap.
Reproducibility
Although the mean IVC and IJV diameters were similar, the reproducibility was better for IJV. For example, the SEM for the mediolateral (2.5 mm, 95% CI 2.0 to 3.2 mm) and anteroposterior (2.5mm, 95% CI 2.0 to 3.1 mm) diameters of the IJV were almost half of the SEM of the minimum diameter of the IVC (4.8 mm, 95% CI 3.9 to 6.4 mm).
Acquisition Versus Interpretation
The proportions of within-participant measurement variances attributable to investigators’ acquisitions were generally higher than the variances attributable to interpretations (Table 2). These differences in proportions were larger for IJV diameters. For example, the proportion of within-participant variance attributable to acquisition was higher than to interpretation by 75% (95% CI 62 to 86%) for the mediolateral diameter and by 61% (95% CI 43 to 78%) for the anteroposterior diameter.
Table 2.
Modeled measurement variances of vein diameter measurements
| Vein | Diameter | Source of Variance* | Average Modeled Variance† (95% CI), mm2 | Proportion of Total Within-Participant Variance‡ (95% CI) |
|---|---|---|---|---|
| Inferior Vena Cava | Maximum | Between-participant | 21.8 (8.1 to 50.0) | NA |
| Within-participant | 10.9 (7.4 to 17.4) | 100% | ||
| Acquisition | 6.8 (3.4 to 13.2) | 61% (45 to 77%) | ||
| Interpretation | 4.1 (3.5 to 4.8) | 39% (23 to 55%) | ||
| Difference | 2.7 (−0.8 to 9.2) | 21% (−11 to 53%) | ||
| Inferior Vena Cava | Minimum | Between-participant | 25.5 (5.9 to 61.5) | NA |
| Within-participant | 23.4 (15.4 to 39.7) | 100% | ||
| Acquisition | 15.9 (7.9 to 32.0) | 66% (50 to 81%) | ||
| Interpretation | 7.6 (6.5 to 8.9) | 34% (19 to 50%) | ||
| Difference | 8.3 (0.2 to 24.5) | 32% (1 to 62%) | ||
| Internal Jugular | Mediolateral | Between-participant | 21.8 (9.7 to 45.3) | NA |
| Within-participant | 6.4 (4.0 to 10.4) | 100% | ||
| Acquisition | 5.6 (3.3 to 9.6) | 88% (81 to 93%) | ||
| Interpretation | 0.7 (0.6 to 0.9) | 12% (7 to 19%) | ||
| Difference | 4.9 (2.5 to 8.9) | 75% (62 to 86%) | ||
| Internal Jugular | Anteroposterior | Between-participant | 11.3 (4.4 to 24.5) | NA |
| Within-participant | 6.2 (4.0 to 9.9) | 100% | ||
| Acquisition | 5.0 (2.9 to 8.8) | 81% (71 to 89%) | ||
| Interpretation | 1.1 (1.0 to 1.3) | 19% (11 to 29%) | ||
| Difference | 3.9 (1.7 to 7.6) | 61% (43 to 78%) |
CI = Confidence interval.
Between-participant variance reflects the underlying heterogeneity in the diameters of our participants’ veins. Within-participant variance represents the dispersion of random measurement errors; these variances can be separated into variances of acquisition and interpretation. Variances of acquisition represent the dispersion among the measurement means of ultrasounds from the same participants. Variance of interpretation represents the variability among measurements from the same ultrasound.
The square root of the between-participant variance is the standard error of measurement, reported in Table 1.
Acquisition variance minus interpretation variance may not equal the listed difference due to rounding.
Discussion
We found that the reproducibility of central vein US diameter measurement was lower during image acquisition than interpretation: when averaged across participants, random measurement errors of acquisition were more dispersed than errors of image interpretation (Table 2). This finding is important, because reproducibility affects clinicians’ ability to distinguish the ‘signal’ of meaningful intravascular volume change from the ‘noise’ of measurement error. For example, diameter changes observed from hemorrhage,13,19 acute heart failure treatment,20,21 and crystalloid infusions22 are listed in Table 1. Here the largest published diameter changes are listed because they are the most conservative to compare with minimal detectable changes. To facilitate comparison, we back-calculated 95% confidence intervals when unreported, using P values and assuming the t distribution. IVC changes for acute heart failure were averaged across both arms of the Evaluation Study of Congestive Heart Failure and Pulmonary Artery Catheterization Effectiveness Trial;20 although the corresponding weight loss for combined arms was not reported, there was no statistically significant difference between the intervention (4 kg) and control (3.2 kg).21 Both vein changes from crystalloid infusions were measured in 14 volunteers with no history of cardiac disease or hypertension.22 In all three clinical scenarios, observed changes are smaller than our investigators’ minimal detectable changes. Put differently, our investigators could not be expected to distinguish these clinically meaningful changes from measurement errors.23
Our findings provide direction for improvement, as the greatest potential gain in reproducibility will come from reducing random errors of acquisition. Generalizing these conclusions to other examiners must be cautious, given the limitations of our study design. Nevertheless, our findings provide the first published evidence that, in order to realize the promise of central vein point-of-care US to noninvasively track intravascular volume, the reproducibility of acquisition and interpretation of ultrasound images ought to be evaluated separately.
Despite the recent emphasis on the quality of acquisitions in point-of-care ultrasound,24 few studies have evaluated how acquisitions and interpretations separately affect reproducibility. Doing so requires deliberate study methods, since acquisition and interpretation are naturally performed contemporaneously in point-of-care ultrasound. First, acquisitions need to be independent of each other but also close in time. Second, interpretations need to be independent of acquisitions and independent of prior interpretations. Thus, interpreters need to be blinded and presented with the same US only after enough time has passed to prevent recall.25 Finally, the analysis must account for the nesting (or grouping) of interpretations within acquisitions.
Most other investigators have analyzed the reproducibility of point-of-care ultrasound as a single conjoined skill, solely focusing on the IVC with relative indices of reproducibility. Saul et al26 reported product moment correlation coefficients of 0.68 (without confidence intervals) for both the IVC maximum and minimum diameters measured by two emergency medicine ultrasound fellows, and De Lorenzo et al27 reported the same value of 0.68 (95% CI 0.35 to 0.76) for the maximum diameter measured by 14 emergency department nurses. Akkaya et al28 reported ICCs of 0.60 (95% CI 0.45 to 0.72) and 0.56 (0.41 to 0.67) for maximum and minimum IVC diameters measured by 6 emergency medicine residents; whereas Fields et al29 reported higher values of 0.77 (95% CI 0.62 to 0.87) and 0.81 (95% CI 0.69 to 0.89) for the same diameters measured by a group consisting of one emergency medicine ultrasound fellow and four emergency room physicians.
Comparisons between these relative indices and our own (Table 1) are difficult given differences in both investigators and patients. For example, both types of relative indices of reproducibility — product moment correlation coefficients and ICCs — will increase with patient heterogeneity. In the case of central vein US, heterogeneity is induced by characteristics that are hard to measure — such as variations in body habitus and adiposity. We reported patients’ heterogeneity as between-participant measurement variance (Table 2). As similar quantifications of heterogeneity are not available from these other reports, we do not know whether the apparent differences between them were simply due to differences in the variabilities of the underlying population samples.
Unlike relative indices, such as the product moment coefficients and ICCs, the SEM is an absolute index of reproducibility that does not incorporate patients’ heterogeneity.14 The SEM is calculated from the total within-participant measurement random variance — theoretically what remains after the measurement variance induced by the patients themselves has been removed.12 SEM is thus unaffected by patients’ heterogeneity and instead represents only measurement error. Despite this advantage, we found no reports of central vein point-of-care US that used it or other absolute indices of reproducibility.
Our study has the following limitations. First, we enrolled a small convenience sample of participants from one Veteran’s Administration hospital and collected no descriptive demographic data. Generalizing our findings to other patients, particularly those who are not spontaneously breathing, is therefore limited. Second, we did not present derived measurements, such as the collapsibility index of the IVC or the aspect ratio of the IJV. Yet, we expect from both statistical theory and empiric findings29 that derived measurements will have higher variability and thus lower reproducibility than the raw measurements used to calculate them. Third, we left our vein diameter measurements continuous to retain statistical power instead of grouping them into ordinal categories, as clinicians often do. Grouping measurements, however, generally does not improve reproducibility, especially when typical measurements lie close to defined cut points, as in our IVC measurements.18 Fourth, we artificially made acquisitions independent of interpretations in order to separately quantify their respective contributions to measurement errors. This introduced some processes (such as remote diameter measurements) that may have increased overall measurement error. Nonetheless, we would expect interpretations to be aided by the acquisitions preceding them, which would further decrease random errors of interpretations relative to acquisitions. Last, we averaged random measurement errors across three examiners without exploring variations among them. Although our three investigators underwent a similar training program, we did not ensure that our investigators adhered to our standardized acquisition and interpretation protocols. A different set of investigators with different training or levels of experience might perform differently.
Larger investigations with more participants will be needed to determine what patient characteristics adversely affect reproducibility so that investigators can find ways to mitigate them. Such patient characteristics will likely be both anthropomorphic (such as obesity) and behavioral (such as variable inspiratory pressures caused by variable patterns of breathing). How many investigators to include in future studies will depend on whether or not the investigators’ characteristics or the investigators themselves are of interest. To study how the investigators’ level of experience, for example, may affect reproducibility would probably require 20 or more investigators.30 In contrast, to evaluate specific investigators after a training program, only two investigators (with one serving as an expert) would be required. In either case, deconstructing the individual actions of investigators (such as how much pressure they apply with the transducer), as well as the idiosyncratic combination of specific participants and investigators (such as how an investigator with short arms adjusts to an obese participant), will provide insights to improve and revise training. Our findings suggest that, at least among our investigators, such revisions are needed because changes in central vein measurements often reflect measurement error and not true changes. Given ongoing interest in finding a noninvasive point-of-care technology to track intravascular volume over time,31 such revisions are justified.
This future work can be facilitated by using methods similar to ours that allow acquisition and interpretation to be analyzed separately. Future work should also extend our methods to include contemporaneous acquisitions and interpretations. Not only will this provide a more realistic estimate of reproducibility, it will also afford a direct comparison with acquisitions and interpretations conducted independently of each other — as they effectively are with referral US. If contemporaneous acquisitions and interpretations improve reproducibility, US providers may reconsider the value of referrals, particularly when, as for central vein diameter measurements, iterative US can only be practically conducted at the point-of-care.
In conclusion, we found that the reproducibility of 4 central vein point-of-care ultrasound measurements among three investigators was too low to confidently detect clinically meaningful changes in volume status. We also found that acquisition impacts reproducibility more than interpretation, suggesting that acquisition ought to be targeted first for improvement.
Acknowledgments
Funding: Department of Veterans Affairs, Veterans Health Administration, Office of Research and Development and Dartmouth SYNERGY, National Institutes of Health, National Center for Translational Science (UL1TR001086)
Footnotes
Conflict of Interest: We have no relevant affiliations pertaining to the subject matter or materials to disclose.
Disclaimer: The contents of this publication do not represent the views of the U.S. Department of Veterans Affairs or the United States Government
References
- 1.Low D, Vlasschaert M, Novak K, et al. An argument for using additional bedside tools, such as bedside ultrasound, for volume status assessment in hospitalized medical patients: a needs assessment survey. J Hosp Med. 2014;9:727. doi: 10.1002/jhm.2256. [DOI] [PubMed] [Google Scholar]
- 2.McGee SR. Physical examination of venous pressure: a critical review. Am Heart J. 1998;136:10. doi: 10.1016/s0002-8703(98)70175-9. [DOI] [PubMed] [Google Scholar]
- 3.Cohn JN. Jugular venous pressure monitoring: a lost art? J Card Fail. 1997;3:71. doi: 10.1016/s1071-9164(97)90037-3. [DOI] [PubMed] [Google Scholar]
- 4.Katzarski KS, Nisell J, Randmaa I, et al. A critical evaluation of ultrasound measurement of inferior vena cava diameter in assessing dry weight in normotensive and hypertensive hemodialysis patients. Am J Kidney Dis. 1997;30:459. doi: 10.1016/s0272-6386(97)90302-4. [DOI] [PubMed] [Google Scholar]
- 5.Soni N, Lucas BP. Diagnostic point-of-care ultrasound for hospitalists. J Hosp Med. 2015;10:120. doi: 10.1002/jhm.2285. [DOI] [PubMed] [Google Scholar]
- 6.Molenberghs G, Laenen A. Estimating reliability and generalizability from hierarchical biomedical data. J Biopharm Stat. 2007;17:595. doi: 10.1080/10543400701329448. [DOI] [PubMed] [Google Scholar]
- 7.Lucas BP, Candotti C, Margeta B, et al. Diagnostic accuracy of hospitalst-performed hand-carried ultrasound echocardiography after a brief training program. J Hosp Med. 2009;4:340. doi: 10.1002/jhm.438. [DOI] [PubMed] [Google Scholar]
- 8.Armstrong PJ, Sutherland R, Scott DH. The effect of position and different manoeuvers on internal jugular vein diameter size. Acta Anaesthesiol Scand. 1994;38:229. doi: 10.1111/j.1399-6576.1994.tb03879.x. [DOI] [PubMed] [Google Scholar]
- 9.Nakao S, Come PC, McKay RG, et al. Effects of positional changes on inferior vena caval size and dynamics and correlations with right-sided cardiac pressure. Am J Cardiol. 1987;59:125. doi: 10.1016/s0002-9149(87)80084-x. [DOI] [PubMed] [Google Scholar]
- 10.Lipton B. Estimation of central venous pressure by ultrasound of the internal jugular vein. Am J Emerg Med. 2000;18:432. doi: 10.1053/ajem.2000.7335. [DOI] [PubMed] [Google Scholar]
- 11.Wallace DJ, Allison M, Stone MB. Inferior vena cava percentage collapse during respiration is affected by the sampling location: an ultrasound study in healthy volunteers. Acad Emerg Med. 2010;17:96. doi: 10.1111/j.1553-2712.2009.00627.x. [DOI] [PubMed] [Google Scholar]
- 12.de Vet HCW, Terwee CB, Knol DL, et al. When to use agreement versus reliability measures. J Clin Epidemiol. 2006;59:1033. doi: 10.1016/j.jclinepi.2005.10.015. [DOI] [PubMed] [Google Scholar]
- 13.Lyon M, Blaivas M, Brannam L. Sonographic measurement of the inferior vena cava as a marker of blood loss. Am J Emerg Med. 2005;23:45. doi: 10.1016/j.ajem.2004.01.004. [DOI] [PubMed] [Google Scholar]
- 14.Hopkins WG. Measures of reliability in sports medicine and science. Sports Med. 2000;30:1. doi: 10.2165/00007256-200030010-00001. [DOI] [PubMed] [Google Scholar]
- 15.McGraw KO, Wong SP. Forming inferences about some intraclass correlation coefficients. Psychol Methods. 1996;1:30. [Google Scholar]
- 16.Leckie G, Charlton C. runmlwin—A Program to Run the MLwiN Multilevel Modelling Software from within Stata. J Stat Softw. 2013;52:1. [Google Scholar]
- 17.Goldstein H. Multilevel statistical models. 4. Bristol, UK: Wiley; 2011. [Google Scholar]
- 18.Rudski LG, Lai WW, Afilalo J, et al. Guidelines for the echocardiographic assessment of the right heart in adults: a report from the American Society of Echocardiography. J Am Soc Echocardiogr. 2010;23:685. doi: 10.1016/j.echo.2010.05.010. [DOI] [PubMed] [Google Scholar]
- 19.Akilli NB, Cander B, Dundar ZD, et al. A new parameter for the diagnosis of hemorrhagic shock: jugular index. J Crit Care. 2012;27:530, e13. doi: 10.1016/j.jcrc.2012.01.011. [DOI] [PubMed] [Google Scholar]
- 20.Ramasubbu K, Deswal A, Chan W, et al. Echocardiographic changes during treatment of acute decompensated heart failure: insights from the ESCAPE trial. J Cardiac Fail. 2012;18:792. doi: 10.1016/j.cardfail.2012.08.358. [DOI] [PubMed] [Google Scholar]
- 21.Binanay C, Califf RM, Hasselblad V, et al. Evaluation study of congestive heart failure and pulmonary artery catheterization effectiveness: the ESCAPE trial. JAMA. 2005;294:1625. doi: 10.1001/jama.294.13.1625. [DOI] [PubMed] [Google Scholar]
- 22.Weekes AJ, Lewis MR, Kahler Z, et al. The effect of weight-based volume loading on the inferior vena cava in fasting subjects: a prospective randomized double-blinded trial. Acad Emerg Med. 2012;19:901. doi: 10.1111/j.1553-2712.2012.01416.x. [DOI] [PubMed] [Google Scholar]
- 23.Beckerman H, Roebroeck ME, Lankhorst GJ, et al. Smallest real difference, a link between reproducibility and responsiveness. Qual Life Res. 2001;10:571. doi: 10.1023/a:1013138911638. [DOI] [PubMed] [Google Scholar]
- 24.Bahner DP, Adkins EJ, Nagel R, et al. Brightness mode quality ultrasound imaging examination technique (B-QUIET): quantifying quality in ultrasound imaging. J Ultrasound Med. 2011;30:1649. doi: 10.7863/jum.2011.30.12.1649. [DOI] [PubMed] [Google Scholar]
- 25.Allen MJ, Yen WM. Introduction to Measurement Theory. Prospect Heights, Illinois: Waveland Press; 2002. [Google Scholar]
- 26.Saul T, Lewiss RE, Langsfeld A, et al. Inter-rater reliability of sonographic measurements of the inferior vena cava. J Emerg Med. 2012;42:600. doi: 10.1016/j.jemermed.2011.05.095. [DOI] [PubMed] [Google Scholar]
- 27.De Lorenzo RA, Holbrook-Emmons Ultrasound measurement of inferior vena cava diameters by emergency department nurses. Adv Emerg Nurs J. 2014;36:271. doi: 10.1097/TME.0000000000000025. [DOI] [PubMed] [Google Scholar]
- 28.Akkaya A, Yesilaras M, Aksay E, et al. The interrater reliability of ultrasound imaging of the inferior vena cava performed by emergency residents. Am J Emerg Med. 2013;31:1509. doi: 10.1016/j.ajem.2013.07.006. [DOI] [PubMed] [Google Scholar]
- 29.Fields JM, Lee PA, Jenq KY, et al. The interrater reliability of inferior vena cava ultrasound by bedside clinician sonographers in emergency department patients. Acad Emerg Med. 2011;18:98. doi: 10.1111/j.1553-2712.2010.00952.x. [DOI] [PubMed] [Google Scholar]
- 30.Rabe-Hesketh S, Skrondal A. Multilevel and longitudinal modeling using Stata. Volume 1: Continuous responses. 3. College Station, TX: Stata Press; 2012. [Google Scholar]
- 31.Peacock WF, Soto KM. Current techniques of fluid status assessment. In: Ronco C, Costanzo MR, Bellomo R, Maisel AS, editors. Fluid Overload: Diagnosis and Management. Contributions in Nephrology. Basel, Switzerland: Karger; 2010. [DOI] [PubMed] [Google Scholar]