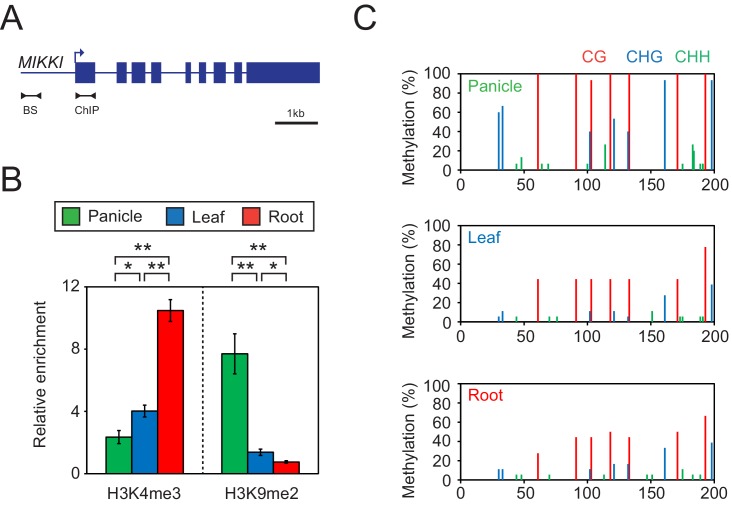
Figure 5. Tissue-specific epigenetic signatures of the MIKKI locus.
(A) MIKKI structure showing primer positions. BS, bisulfite sequencing; ChIP, chromatin immunoprecipitation. (B) H3K4me3 and H3K9me2 levels determined by ChIP-qPCR assay. The amount of immunoprecipitated DNA was normalized to the input levels with eEF1α as the internal control region. Error bars represent mean ± sd of three biological replicates performed in technical triplicate. The asterisks indicate significant statistical differences determined by Student’s t-test. **p<0.005; *p<0.05. (C) DNA methylation levels shown as percent methylation in three different sequence contexts.
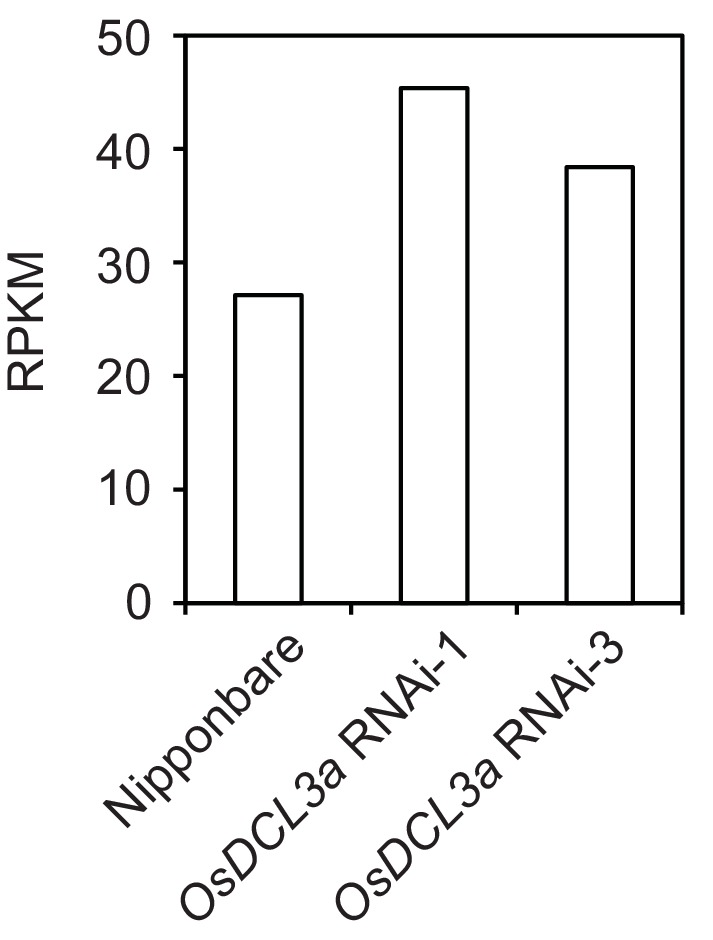
Figure 5—figure supplement 1. MIKKI RNA levels in osdcl3a RNAi knock-down lines.


