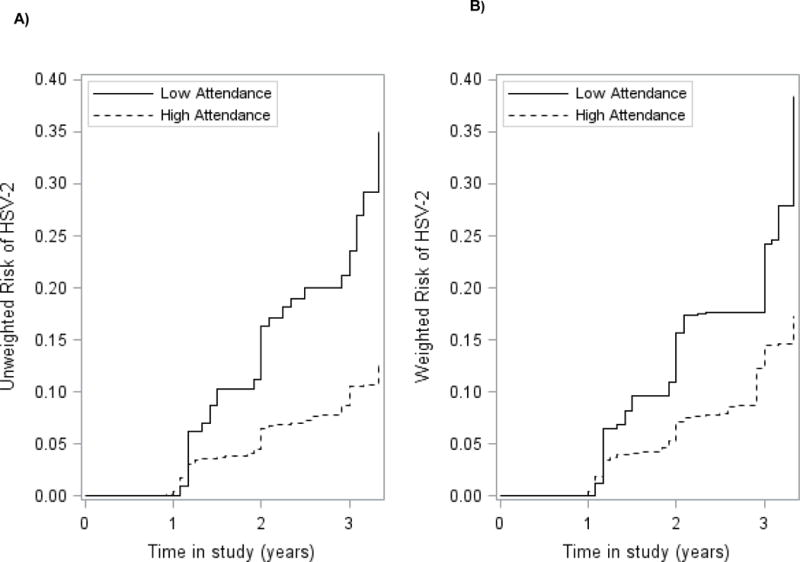
FIGURE 2.

Cumulative incidence curves for the association between school attendance and incident HSV-2 infection for 2238 young HIV and HSV-2 negative women aged 13–23 participating in HPTN068 (2011–2015). A) Unweighted; B) Weighted. Treatment weighted curves accounted for the following covariates: Age, CCT intervention, HIV, parental involvement, partner age, pregnancy, SES. Solid lines represent patients with low attendance (<80%). Dashed lines represent young women with high attendance (>=80%).
