
Figure 6.
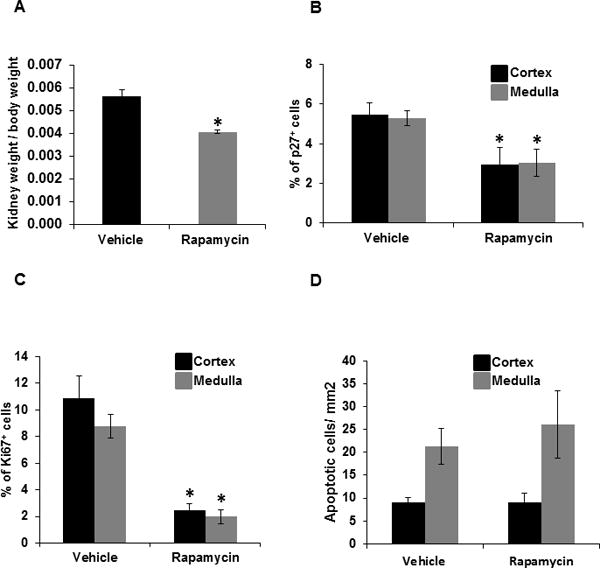
A, hypertrophic index was determined by measuring the ratio of right kidney weight (gm) and total body weight (gm) of the SS rats treated with vehicle (n=7) or rapamycin (n=9) maintained on the 4.0% NaCl diet. B, graph represents the percentage of p27+ cells (hypertrophy), C, percentage of Ki67+ cells (cell proliferation) D, quantification of apoptotic cells/mm2 (TUNEL assay) in the renal cortex and outer medulla of SS rats treated with vehicle (n=6) or rapamycin (n=6) maintained on the 4.0% NaCl diet. Blue and brown column on bar graph represent cortex and outer medulla, respectively. * p<0.05 Vs vehicle.