

Summary
Comparative genomics is providing new opportunities to address the diversity and distributions of genes encoding the biosynthesis of specialized metabolites. An analysis of 119 genome sequences representing three closely related species of the marine actinomycete genus Salinispora reveals extraordinary biosynthetic diversity in the form of 176 distinct biosynthetic gene clusters (BGCs) of which only 24 have been linked to their products. Remarkably, more than half of the BGCs were observed in only one or two strains, suggesting they were acquired relatively recently in the evolutionary history of the genus. These acquired gene clusters are concentrated in specific genomic islands, which represent hot spots for BGC acquisition. While most BGCs are stable in terms of their chromosomal position, others migrated to different locations or were exchanged with unrelated gene clusters suggesting a plug and play type model of evolution that provides a mechanism to test the relative fitness effects of specialized metabolites. Transcriptome analyses were used to address the relationships between BGC abundance, chromosomal position, and product discovery. The results indicate that recently acquired BGCs can be functional and that complex evolutionary processes shape the micro-diversity of specialized metabolism observed in closely related environmental bacteria.
Introduction
Microorganisms produce small organic compounds called secondary or specialized metabolites. These compounds have been the source of or inspiration for many of today's most important medicines (Berdy, 2005; Newman and Cragg, 2012) and represent a fundamental mechanism by which microorganisms interact with each other and the environment. While the ecological functions of most specialized metabolites remain unknown, they mediate important processes such as quorum sensing (Waters and Bassler, 2005), metal acquisition (Sandy and Butler, 2009), and allelopathy (Wietz et al., 2013). Once considered non-essential for survival, it is now known that specialized metabolites are involved in fundamental physiological processes such as electron transport, raising questions about their “secondary” nature (Price-Whelan et al., 2006).
Advances in our understanding of the molecular genetics of natural product biosynthesis, coupled with increased access to genome sequence data, are providing unique opportunities to identify the biosynthetic gene clusters (BGCs) that encode the production of specialized metabolites (Fischbach and Walsh, 2006; Hertweck, 2009). In addition to encoding the enzymes needed for biosynthesis, these gene collectives can also include regulatory elements, transporters, and mechanisms of resistance (Cimermancic et al., 2014). BGCs account for >10% of some bacterial genomes (Nett et al., 2009; Cimermancic et al., 2014), indicating the fundamental importance of this type of metabolism for certain bacteria. The analysis of bacterial genome sequences has led to the surprising observation that even well studied strains can maintain many more BGCs than the compounds discovered from them would suggest (Bentley et al., 2002; Udwary et al., 2007). BGCs that have not been linked to their products have been termed “orphan” (Gross, 2007) and are often thought to be transcriptionally inactive or “silent” under normal laboratory conditions (Seyedsayamdost, 2014; Abdelmohsen et al., 2015). Efforts to identify the products of these orphan BGCs is driving a resurgence of interest in natural product research (Winter et al., 2011; Kim et al., 2015) and the development of techniques such as genome mining (Challis, 2008; Ziemert et al., 2016), which take a sequence first approach to natural product discovery. With the increasing availability of online tools (Boddy, 2013; Weber, 2014) and data repositories (Medema et al., 2015), BGCs can now be readily identified from sequence data without specific expertise in this form of metabolism.
The BGCs encoding specialized metabolites are said to be among the most rapidly evolving genetic elements known (Fischbach et al., 2008). Access to genome sequences from large numbers of closely related strains creates opportunities to compare similar BGCs in different strains and begin to infer the evolutionary processes that create chemical diversity in nature (Freel et al., 2011). There is substantial evidence that BGCs are horizontally exchanged among bacteria (Egan et al., 1998; Metsa-Ketela et al., 2002; Ziemert et al., 2014), although the frequency at which this occurs and the mechanisms driving these events remain poorly understood. Nonetheless, horizontal gene transfer is widely recognized as a driving force in bacterial evolution (Ochman et al., 2000) and the acquisition of a gene cluster encoding the production of a specialized metabolite provides immediate opportunities to test the effects of the encoded compound on fitness.
The marine actinomycete genus Salinispora has proven to be a useful model to address questions related to specialized metabolism and BGC evolution (Jensen et al., 2015; Jensen, 2016). The genus is currently comprised of three named species: S. tropica, S. arenicola, and S. pacifica (Maldonado et al. 2005; Ahmed et al. 2013), which share 99% 16S rRNA sequence identity. They are broadly distributed in ocean sediments and the source of salinosporamide A, a potent proteasome inhibitor that has completed a series of phase I clinical trials for the treatment of cancer (Harrison et al., 2016). Evidence that most BGCs were observed infrequently among Salinispora strains was used to infer relatively recent acquisition in the evolutionary history of the genus (Ziemert et al., 2014). These BGCs were concentrated in genomic islands (Penn et al., 2009), flexible regions of the genome enriched in acquired genes that generally encode adaptive traits (Juhas et al., 2009). While the integration of BCGs into GIs minimizes the risk of disrupting important cellular pathways (Dobrindt et al., 2004), it remains unknown if recently acquired BGCs are drawn to certain genomic islands or if their frequency of occurrence in the population or location on the chromosome affects the likelihood they will be expressed. Furthermore, population genomics provides opportunities to address BGC chromosomal stability, exchange events, and the possibility that some BGCs are degraded over time in addition to simply being gained or lost. To address these questions, we analyzed 119 high quality Salinispora genome sequences for BGCs associated with specialized metabolism. The goals were to assess BGC diversity and distributions in the context of species-level “pan-chromosomes” (Chan et al., 2015) and to gain new insight into the dynamic nature of BGC evolution.
Results and Discussion
BGC diversity, distributions, and product discovery
High quality draft genome sequences generated from 119 strains of the marine actinomycete genus Salinispora were analyzed for BGCs associated with specialized metabolism (Table S1). These strains were largely cultured from marine sediment samples collected from global locations over a 25-year time frame and represent a subset of a larger culture collection that has yielded a wide range of structurally diverse specialized metabolites (Jensen et al., 2015). The average number of BGCs identified per genome was significantly greater in S. arenicola (25) than in the other two species (Fig. S1, ANOVA, p=0.00), providing genetic support for the observation that this species preferentially invests in interference competition (Patin et al., 2015). Further distinguishing the species, we confirmed that S. tropica strains consistently maintain four BGCs predicted to encode siderophores (des, sid1, sid3, and sid4) relative to two on average in S. arenicola (Roberts et al., 2012). The specialized metabolites discovered to date from the genus are enriched in compounds of PKS, NRPS, and PKS/NRPS hybrid origins (78%) relative to their occurrence in the genomes (48-60%) (Fig. S1), indicating a bias towards the isolation of compounds produced by these biosynthetic mechanisms.
Despite sharing 99% 16S rRNA gene sequence identity, we observed extensive diversity in the 119 genomes in the form of 176 distinct BGCs. Of these, it was possible to link 14 to the small molecules they encode based on prior experimental evidence and 10 more based on bioinformatic analysis (Table 1). Thus, as has been observed in other actinomycete genomes, a majority of the BGCs detected (80% in this case) have not been linked their products. Despite extensive chemical analysis of this genus (Jensen et al., 2015), only three additional compounds have been isolated yet not connected to their BGCs (Asolkar et al., 2009; Bose et al., 2014; Schulze et al., 2015) indicating that a large majority of the biosynthetic potential of the strains sequenced has yet to be realized. Salinispora spp. devote a large percentage of their genomes to specialized metabolism (>10%) (Udwary et al., 2007) supporting the importance of these small molecules to their biology.
Table 1.
Compounds and their associated BGCs detected in Salinispora strains (numbering as defined in Fig. 1). In the case of BE-43547, the biosynthetic gene cluster (BGC) was detected in Salinispora but the compound originally reported from another taxon. Compounds for which the BGCs are unknown are listed as not identified (NI). The method by which compounds and BGCs were linked are reported as bioinformatic (B), gene inactivation (G), or heterologous expression (H). Note: The pseudopeptide ketomemicin C and its associated BGC was recently identified following heterologous expression from S. tropica strain CNB-440 (Ogasawara et al., 2016) but not included in these analyses.
| No. | Compound | BGC | Linkage | Reference |
|---|---|---|---|---|
| 16 | Arenicolide | PKS28 | B | (Williams, Miller et al. 2007) |
| 20 | Arenimycin | arn | B | (Kersten, Ziemert, et al. 2013) |
| 24 | BE-43547 (APD-CLD) | PKS58 | B | (Villadsen et al. 2017) |
| 8 | Cyanosporaside | cya | G | (Lane et al. 2013) |
| 19 | Cyclomarin/cyclomarazine | cym | G | (Schultz et al. 2008) |
| 3 | Desferrioxamine | des | G | (Roberts et al. 2012) |
| 17 | Enterocin | enc | H | (Bonet et al. 2014) |
| 12 | Ikarugamycin | ika | B | (Greunke, Glöckle et al. 2017) |
| 8 | Lomaiviticin | lom | G | (Kersten, Lane, et al. 2013) |
| 2 | Lymphostin | lym | G | (Miyanaga et al. 2011) |
| 14 | Pacificanone/salinipyrone | spr | G | (Awakawa et al. 2015) |
| 23 | Retimycin | rtm | B | (Duncan et al. 2015) |
| 5 | Rifamycin/saliniketal | rif | G | (Wilson et al. 2010) |
| 11 | Salinichelin | slc | B | (Bruns et al., submitted) |
| 9 | Salinilactam | slm | B | (Udwary et al. 2007) |
| 22 | Saliniquinone | PKS65 | B | Unpublished prediction |
| 10 | Salinosporamide | sal | G | (Eustáquio et al. 2011) |
| 1 | Sioxanthin | sio | G | (Richter et al. 2014) |
| 13 | Sporolide | spo | H | (McGlinchey et al. 2008) |
| 4 | Staurosporine | sta | B | (Freel et al. 2011) |
| 21 | Tambromycin | tbr | B | (Goering et al. 2016) |
| 6 | Isopimara-8,15-dien-19-ol | terp1 | H | (Xu et al. 2014) |
| 15 | Thiolactomycin | tlm | H | (Tang et al. 2015) |
| 18 | Tirandalydigin | tdy | B | (Castro-Falcón et al. 2016) |
| 25 | Mevinolin | NI | - | (Bose, Hodson et al. 2014) |
| 26 | Salinipostin | NI | - | (Schulze, Navarro et al. 2015) |
| 27 | Arenamide | NI | - | (Asolkar, Freel et al. 2009) |
We next assessed the relative abundance of each BGC in the three Salinispora species (Fig. S2). Surprisingly, only four BGCs are conserved at the genus level (Fig. 1A). Of these, only the sio BGC has been linked to its biosynthetic product, the carotenoid pigment sioxanthin, which gives these bacteria their characteristic orange pigmentation (Richter et al., 2015). At the species level, S. arenicola possesses a relatively large number of BGCs that were observed among all strains including six that were not observed in the other two species. This level of conservation among 62 stains isolated from global locations over 25 years provides evidence they are maintained due to strong selective pressures. The products of the BGCs conserved in all S. arenicola strains encompass diverse biosynthetic types and include potent antibiotics (rifamycins), cytotoxins (staurosporines), and a diterpene of unknown function discovered via heterologous expression (Fig. 1B) (Jensen et al., 2015).
Figure 1.

Salinispora specialized metabolism. A) Outer three circular bar graphs show the relative abundance of each BGC in the three Salinispora species arranged counter-clockwise in decreasing order by genus (scale = 0-100% of strains, lines at 25% intervals, SA = S. arenicola, SP = S. pacifica, ST = S. tropica). Bar colors indicate BGC type (see legend). Only the first four BGCs occur in all 176 stains. B) Inner circle shows the BGCs for which the products are confirmed (black) or predicted (grey) with the corresponding chemical structures numbered and named: 1 sioxanthin, 2 lymphostin, 3 desferrioxamine B, 4 staurosporine, 5 rifamycin S, 6 diterpene, 7 lomaiviticin A, 8 cyanosporaside A, 9 salinilactam, 10 salinosporamide A, 11 salinichelin A, 12 ikarugamycin, 13 sporolide A, 14 rosamicin A, 15 thiolactomycin, 16 arenicolide B, 17 enterocin, 18 tirandalydigin, 19 cyclomarin D, 20 arenimycin A, 21 tambromycin, 22 saliniquinone A, 23 retimycin A, 24 BE43547A1. C) Species phylogeny based on 876 concatenated genes (Millán-Aguiñaga et al., 2017). D) Location from which the strain was isolated (see legend). E) Histogram shows number of BGCs per strain (scale = 10-30). F) Plot linking strains on the right with BGCs on left. Colored links show “singletons” with the corresponding species (orange = S. tropica, blue = S. pacifica, green = S. arenicola).
While relatively few BGCs are fixed at the genus or species level, 54% were observed in only one or two strains. More specifically, 61 BGCs were observed in one strain (singletons) while an additional 34 were observed in only two of the 119 strains (Fig. 1, Fig. S3). It can be inferred that these 95 BGCs were acquired by horizontal gene transfer relatively recently in the evolutionary history of the genus thus providing support for the concept that BGCs represent highly mobile genetic elements (Fischbach et al., 2008). The singletons are broadly distributed throughout the phylogeny (Fig. 1C, F) indicating that BGC acquisition is not limited to any specific clades and thus appears to be a common feature of the genus. The remarkable BGC diversity observed among a group of closely related strains represents a major component of the flexible genome and creates a theoretical mechanism by which bacteria can respond to new selective pressures or exploit new environments (Jensen, 2016; Rodriguez-Valera et al., 2016).
The numbers of shared BGCs did not decrease with increasing geographic distance at either the genus or species levels (Fig. S4, Table S2), as would be expected if there were biogeographic barriers to dispersal. Nonetheless, there are examples of clade-specific BGCs that were only observed at a single location (Fig. S2), suggesting that endemism plays a role in BGC distributions. There is also evidence that BGCs such as PKS9 were acquired independently by different strains, in this case on three occasions by five stains from Fiji (Fig. S5). While these observations are likely affected by sample size, they provide evidence of the complex evolutionary histories of BGCs relative to the strains in which they reside.
Islands of innovation
We next asked if there was conservation in the chromosomal positions of BGCs and if this varied depending upon their frequency of occurrence among the strains. To address these questions, we generated pseudo-chromosomes for each strain by mapping sequence contigs onto the closed genomes of a closely related strain and then mapping the position of each BGC onto the assembly. The positions of ca. 75% of the BGCs could be assigned using this approach. We then generated a single pan-chromosome for each species and determined the positional conservation for each BGC (Fig. 2A-C). Surprisingly, the 21 genomic islands originally identified in a comparison of two Salinispora genome sequences (Penn et al., 2009) were highly conserved among all 119 strains. Depending upon species, these genomic islands housed 72%-89% of the mapped BGCs. While BGCs are commonly observed in genomic islands (Dobrindt et al., 2004), we asked if acquisition events are targeted to specific genomic islands. In S. pacifica, the pan-chromosome clearly reveals that GI10 and GI15 are enriched in BGCs, with 54% of those observed in only one or two strains located in these two islands. Similarly, in S. arenicola, GI5, GI15 and GI20 account for 83% of the mapped BGCs observed in only one or two strains. These islands appear to be specialized sites for BGC entry and are located in regions comparable to the chromosomal arms identified in Streptomyces linear genomes, which are enriched in BGCs (Bentley et al., 2002; Nett et al., 2009). While the mechanisms directing BGCs to specific GIs remain unknown, these regions contain 79% of the mobile genetic elements that could be mapped onto the pseudo-chromosomes. In particular, GI10 and GI15 are enriched in transposases in all three species, which mirrors the abundance of BGCs in these GIs (Fig. S6). These findings contrast with the location of BGCs in the fungal genus Penicillium were they are mainly encoded in the core genome (Nielsen et al., 2017).
Figure 2.
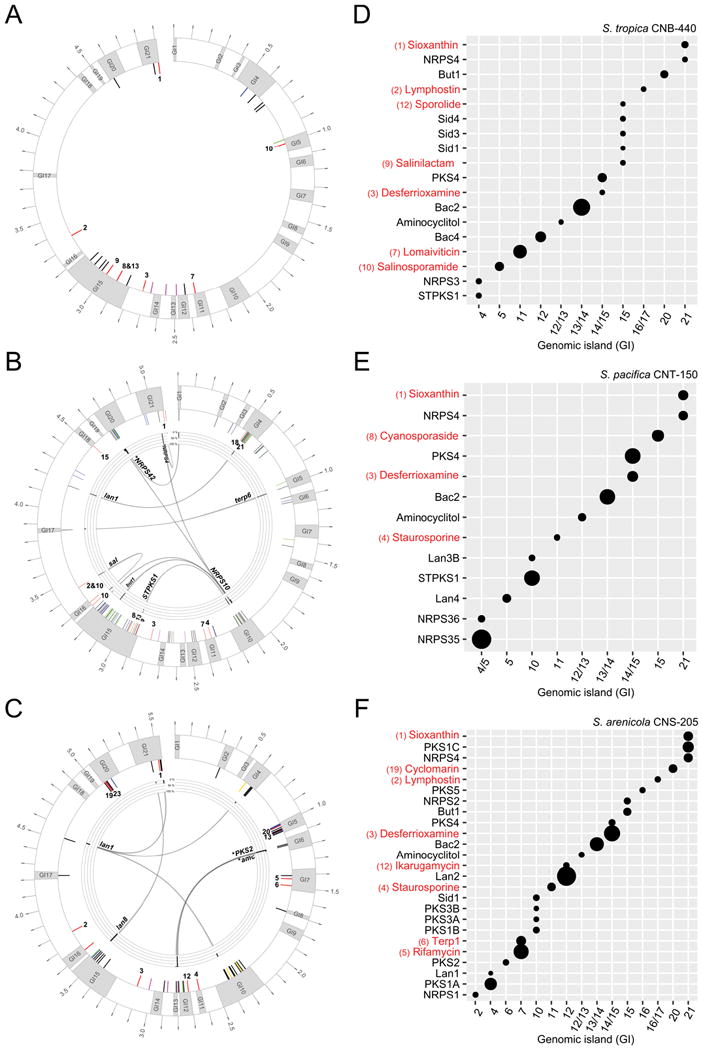
Pan-chromosomes. A) S. tropica, B) S. pacifica, and C) S. arenicola drawn with dnaA at the 12:00 position. Outer ring: genomic islands are shown in gray (labeled GI1-21), outer scale indicates size in Mb. Inner ring: positions of mapped BGCs. Those with known products are in red, genus-specific BGCs in pink, S. arenicola specific BGC in yellow, doubletons in green and singletons in blue. Inner ring: percent occurrence of each BGC at that site. Numbers correspond to compounds experimentally linked to their respective BGC as defined in Fig. 1. Expression profiles of BGCs in D) S. tropica CNB-440, E) S. pacifica CNT-150 (DSM 45549) and F) S. arenicola CNS-205. Size of circle corresponds to level of expression in stationary phase. Only expressed BGCs (those above the threshold) are indicated with a circle. BGCs with known products are shown in red (numbering as defined in Fig. 1). Genomic position (x-axis) is indicated by GI number or inter-island location.
Given that numerous specialized metabolites have been reported from Salinispora strains, we next asked if the position of the BGC affected the likelihood that the encoded secondary metabolites have been discovered. Of the 24 BGCs that have been experimentally or bioinformatically linked to their products, 18 could be mapped onto the three pan-chromosomes. The positions of these BGCs ranged from highly conserved core regions (e.g., lym between GI16-GI17 and des between GI14-GI15) to genomic islands such as GI10 and GI15, which are among the most active sites of BGC acquisition (Fig. 2A-C). Products have also been identified from BGCs that are both highly conserved (e.g., sio, observed in all 119 genomes) and rare (e.g., rtm and arn, each observed in one genome). These results provide evidence that recently acquired BGCs can be functional and suggest that location does not affect the likelihood of product discovery. To further explore the effects of genome location on BGC functionality, we asked if certain GIs were hot spots for BGC expression (Fig. 2D-F). For GIs that contain more than one BGC, they were differentially expressed 53% of the time, suggesting that most BGCs are under different regulatory control. Examples include GI10 in S. pacifica where STPKS1 was highly expressed relative to lan3B. There were also examples where a BGC located in the same GI in different species was differentially expressed (e.g., sio and NRPS4). These observations suggest that genomic position is not a good predictor of BGC expression. Nonetheless, a majority of BGCs (79%) in GI10 and GI15, the major sites of BGC acquisition, were expressed at low levels in the one cultivation condition tested.
BGC migration
The positions of BGCs are largely stable among the strains sequenced, with 92% of those observed in more than one strain found in the same chromosomal position in all strains (Fig. 2A-C). However, the remaining 8% of BGCs could be mapped to more than one position in different strains, providing insight into the complex evolutionary histories of some BGCs within the genus. In all cases, these positional changes were associated with different islands, suggesting the BGCs were either independently acquired or migrated from island to island. The island migration hypothesis is supported by likelihood and phylogenetic analyses in NRPS42 and NRPS4 in S. pacifica (Fig. S7, S8) and amc and PKS2 in S. arenicola (Fig. S9, S10). In all four cases, the likelihood and phylogenetic analyses predict that the BGCs were acquired once and migrated to different chromosomal positions. In the seven remaining cases where a BGC was observed in different chromosomal positions in different strains (sal, STPKS1, NRPS10, lan1, lan8, terp6, and but1), the most parsimonious explanation is that it was acquired more than once (Fig. S11-S21, 4A). In total, 11 BGCs varied in their genomic positions. Sixty-four percent of these could be linked to independent acquisition events and 36% to intra-genomic migration events. It remains unknown if BGCs observed in core regions of the genome originally entered via genomic islands and subsequently migrated to these conserved regions where they are less likely to be lost or disrupted by subsequent acquisition events (Dobrindt et al., 2004).
BGC exchange
As previously reported for enediyne BGCs (Ziemert et al., 2014), we observed clear examples of BGC exchange between the highly conserved lymphostin (lym) BGC (Miyanaga et al., 2011), which was observed in 110 of 119 genomes and the salinosporamide K version of the sal BGC (Fig. S21) (Eustáquio et al., 2011), which was observed in eight of the nine S. pacifica strains that lacked the lym BGC (Fig. 3A). Likelihood analyses predict that lym was vertically inherited from an S. pacifica ancestor and subsequently maintained in a majority of strains while sal was acquired more recently in at least four independent events. In all eight cases where sal replaces lym, the BGCs occur in the same chromosomal position (Fig. 3B) supporting the concept that these BGCs were exchanged. Interestingly, four strains maintain both the sal and lym BGCs and in all cases, lym is observed in its conserved genomic position while sal has been inserted in the core region between GI15 and 16. Unlike previous observations of enediyne BGC exchange, genes within sal and lym do not share high levels of sequence identity suggesting that homologous recombination is not involved. There is also evidence for the exchange of Salinispora BGCs that encode siderophores (Ziemert et al., accepted). It would be interesting to know if the products of sal and lym were functionally equivalent in the strains that possess them.
Figure 3.
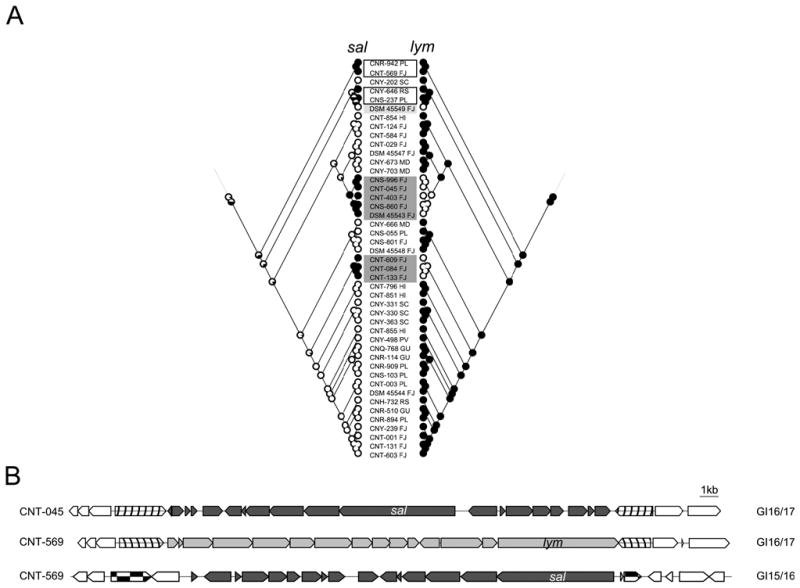
Exchange of sal and lym BGCs in S. pacifica. A) Mirrored likelihood analyses of sal (left) and lym (right) BGCs in S. pacifica. These analyses predict that lym was present in the common ancestor of the genus while sal was acquired more recently in at least four separate events. Grey shaded boxes indicate strains in which the lym BGC was replaced by sal. Black un-shaded boxes indicate four strains that have both BGCs (CNR-942, CNT-569, CNY-646 and CNS-237), whereas the light grey box indicates the only strain lacking both BGCs (DSM 45549). B) For strains containing either sal or lym, the BGCs are located in the same inter-island region between GI16 and GI17 as exemplified here by sal in strains CNT-045 and lym in CNT-569. For strains containing both Sal and lym, lym is located in the normal conserved position (GI16/GI17) while sal is located in the inter-island region between GI15 and GI16 as exemplified by strain CNT-569. SC: Sea of Cortez, PV: Puerto Vallarta, RS: Red Sea, FJ: Fiji, HI: Hawaii, PM: Palmyra, GU: Guam, PL: Palau, MD: Madeira archipelago).
BGC degradation
In addition to BGCs being observed in different chromosomal positions, there is evidence that some are degraded. We searched for BGC remnants by extracting all Salinispora genes annotated as “pseudogenes” from the IMG/ER database and screening this pool for annotations related to secondary metabolism. This led to the detection of pseudogene salpac_2984 in S. pacifica strain DSM 45543, which was also annotated as a “condensation-domain containing protein”. This 139-amino acid pseudogene shares 94% sequence identity with a region of the 1420 amino acid NRPS protein from NRPS10, a BGC identified in S. pacifica strains CNT-003 and CNR-909. Using this gene as a BLASTP query in IMG/ER, proteins with >90% sequence identity to salpac_2984 were identified in 14 additional Salinispora genomes. In addition to this NRPS fragment, a putative regulator gene also associated with NRPS10 was linked to the Salpac_2984 pseudogene. Using the regulator gene as a BLASTP template, three additional strains containing portions of NRPS10 but lacking the Salpac_2984 pseudogene could also be identified. Detailed analyses of the strains that only retained the regulator gene showed that parts of the NRPS could also be detected; however, they were not annotated as an open reading frame. Similar patterns were observed for the fungal BGC encoding bikaverin, which showed different stages of BGC decay and preservation of functional regulatory genes (Campbell et al., 2012).
Maximum likelihood analysis supports the independent acquisition of NRPS10 at six points in the evolutionary history of S. pacifica (Fig. 4A). The “complete” and partial versions of NRPS10 showed similar GC-content (69.0-69.6%), which closely matched the average genome content (69.7-69.9%), suggesting the acquisition events occurred among closely related strains. Only two strains contained the complete BGC (Fig. 4B) while 14 strains contained partial BGCs. Phylogenetic analysis of the regulatory gene revealed that the sequences observed in CNR-909 and CNT-003 (complete BGC) are most closely related to those detected in the partial BGCs observed in CNT-584 and CNT-124 (Fig. S20). These strains are distantly related in the species phylogeny, suggesting that the partial versions of NRPS10 were exchanged among these strains or their close relatives.
Figure 4.
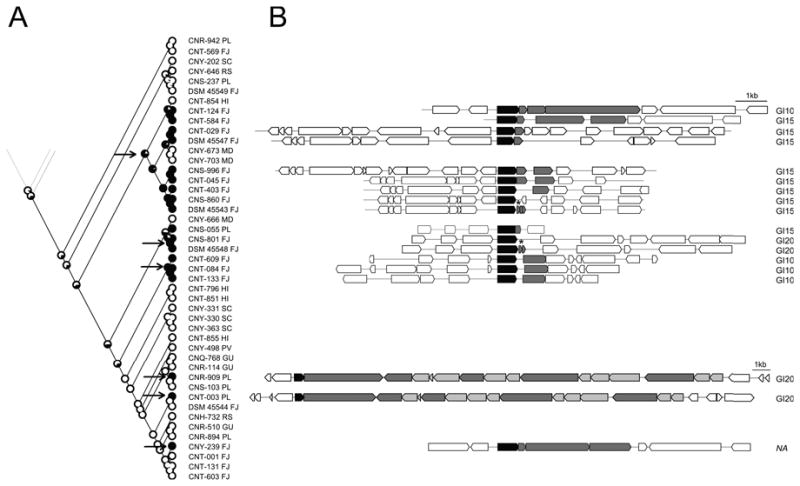
NRPS10 degradation in S. pacifica. A) Likelihood analysis for the conserved regulatory gene predicts six independent acquisition events (arrows). Abbreviations after strain number indicate isolation site of the strain (PL: Palau, FJ: Fiji, RS: Red Sea, HI: Hawaii, MD: Madeira archipelago, SC: Sea of Cortez, PV: Puerto Vallarta, GU: Guam) B) NRPS10 gene cluster organization. The “complete” BGC is observed in CNT-003 and CNR-909. The conserved regulator gene is shown in black, NRPS related genes in dark gray, tailoring enzymes in light gray and flanking genes in white. Position of BGC in genome shown next to cluster. GI: genomic island, NA: GI could not be assigned, *annotated as pseudogene.
Genome sequences derived from large numbers of closely related bacteria are providing unique opportunities to infer the complex evolutionary processes that contribute to the flexible genome (Rodriguez-Valera et al., 2016). The genus Salinispora invests heavily in specialized metabolism, with most BGCs acquired relatively recently in the evolutionary history of the genus. Acquired BGCs are targeted to specific genomic islands and can replace each other using what appears to be a plug and play type model of evolution that provides a mechanism to test the effects of specialized metabolites on fitness. Gaining a better understanding of the ecological functions of these compounds will provide insight into the selective pressures that maintain BGCs within specific lineages and how acquisition events shape population structure.
Experimental Procedures
Genome sequencing, assembly, and pathway identification
The strains used in this study are listed in Table S1. The genome sequences can be accessed via the IMG Genome ID number on the Joint Genome Institute's Integrated Microbial Genomes website (IMG/ER, https://img.jgi.doe.gov). Genome sequencing and assembly were carried out as previously described (Ziemert et al. 2014) as part of three independent JGI sequencing projects using the standard approaches employed at the time. AntiSMASH 2.0 (Blin et al. 2013) was used for terpene, RiPP, and “other” BGC identification while PKS and NRPS BGCs were detected using NaPDoS with default settings (Ziemert et al. 2012). Pathways were grouped into OBUs as described previously (Ziemert et al. 2014) and further investigated using BLAST (http://blast.ncbi.nlm.nih.gov/Blast.cgi) and IMG/ER.
Pan-chromosome assembly
Pseudo-chromosomes were generated for each strain and GI boundaries defined as previously described (Ziemert et al., 2014). Approximately 25% of the BGCs could not be mapped to the pseudo-chromosomes because the flanking regions did not extend into the genomic core. The average size of the GIs and conserved core regions were used to generate figurative representations of the chromosome for each species, which we termed “pan-chromosomes” (Chan et al., 2015). BGCs were mapped onto the pan-chromosomes according their position in the assemblies. The positions of BGCs that were present within the same GI or core region in more than one strain were averaged. Pan-chromosomes and Fig. 1 were visualized using “circos” (Krzywinski et al., 2009) and iTOL (Letunic and Bork, 2016). Genes encoding mobile genetic elements (MGEs) were extracted from the IMG/ER database via gene searches using keywords “transposase”, “integrase” and “recombinase”. The positions of MGEs in the assemblies were assigned in the same manner as the BGCs.
Phylogeny, ancestral state reconstruction, and statistics
The species phylogeny (Fig. 1) and the ancestral state reconstructions were based on 876 concatenated genes common to all 119 genome sequences (Millán-Aguiñaga et al., 2017). Maximum likelihood trees for core biosynthetic genes derived from individual BGCs were constructed with default settings in FastTree (Price et al., 2010) using a protein alignment (MUSCLE) generated by Geneious Pro v5.5.9. Three outgroups were chosen from the top ten BLASTP hits in NCBI. Ancestral state reconstruction was carried out with Mesquite as previously described (Maddison and Maddison, 2011; Ziemert et al., 2014). T-test and ANOVA analyses were carried out in R using default settings.
BGC migration and biogeography
Mesquite was used to determine if BGCs observed at different chromosomal positions in different strains could be attributed to single or multiple acquisition events. If a single acquisition event was predicted, phylogenies of core biosynthetic genes derived from those BGCs were generated. If the phylogenies were congruent, it was inferred that the BGC had moved positions subsequent to the acquisition event. Distances between collection sites were calculated using GPS coordinates (Table S1) of sites (http://www8.nau.edu/cvm/latlongdist.html). Numbers of shared BGCs were determined by comparing all collections sites with each other. The following BGCs were excluded: Genus-specific BGCs (sio, PKS4, bac2, amc), butyrolactone 1 (salinipostin), butyrolactone 2a and b, S. arenicola specific BCGs (rif, terp1, PKS1A, PKS3A, PKS3B, PKS1B) and NRPS2 (conserved in 61/62 S. arenicola).
BGC expression
Transcriptome analyses were performed using established methods. In brief, RNA was sent to the US Department of Energy Joint Genome Institute (JGI) for sequencing, quality control, and read mapping. Libraries for RNA-Seq were prepared using the TruSeq RNA Sample Prep Kit V2 (Illumina) with sequencing performed on an Illumina HiSEQ 2500 instrument. The sequencing effort generated >3×10⁷ paired end reads (100bp) per replicate, which provided over 100× coverage of each Salinispora genome. Raw reads were evaluated for artifact sequences using BBDuk by kmer matching (kmer=25) (https://sourceforge.net/projects/bbmap/). Quality trimming was performed using the phred trimming method set at Q10 (Ewing et al., 1998) and reads under 45 bases removed. Raw reads from each library were aligned to their respective reference genome using BWA (Li and Durbin, 2010). If a read mapped to more than one location, it was ignored. FeatureCounts was used to generate raw gene counts (Liao et al., 2014). Mapped reads were visualized using BamView in Artemis (Rutherford et al., 2000). The number of reads per kilobase of transcript per million mapped reads (RPKM) was used to normalize raw data in Artemis (Mortazavi et al., 2008). BGC expression levels were derived from average values calculated for key biosynthetic genes. These included PKS, NRPS, terpene synthase, precursor peptide (bacteriocin) and LanM (lantibiotic) genes. Additional genes associated with key biosynthetic operons were checked to confirm the expression levels.
Supplementary Material
Originality-Significance Statement.
Using comparative genomics, this study provides a comprehensive analysis of specialized metabolism among a large number of closely related bacteria. Biosynthetic gene clusters were mapped onto species-level pan-chromosomes revealing hot spots for horizontal acquisition. The results provide new insight into gene cluster diversity and distributions and evidence that biosynthetic gene clusters migrate and exchange positions using a plug and play type model of evolution. Transcriptomics was used for the first time to determine if chromosomal location affects biosynthetic gene cluster expression.
Acknowledgments
This work was funded by the NIH under grants R01GM085770 to PRJ and BSM and U19TW007401 to PRJ; and the Foundation for Science and Technology (FCT) under grants PTDC/QUIQUI/119116/2010 and IF/00700/2014 to SPG. Genome sequencing was conducted by the U.S. Department of Energy Joint Genome Institute and supported by the Office of Science of the U.S. Department of Energy under Contract No. DE-AC02- 05CH11231. We acknowledge the government and people of Fiji for permission to collect samples in their local waters.
Footnotes
The authors declare no conflict of interest.
References
- Abdelmohsen UR, Grkovic T, Balasubramanian S, Kamel MS, Quinn RJ, Hentschel U. Elicitation of secondary metabolism in actinomycetes. Biotechnol Adv. 2015;33:798–811. doi: 10.1016/j.biotechadv.2015.06.003. [DOI] [PubMed] [Google Scholar]
- Asolkar RN, Freel KC, Jensen PR, Fenical W, Kondratyuk TP, Park EJ, Pezzuto JM. Arenamides A-C, cytotoxic NF-κ-B inhibitors from the marine actinomycete Salinispora arenicola. J Nat Prod. 2009;72:396–402. doi: 10.1021/np800617a. [DOI] [PMC free article] [PubMed] [Google Scholar]
- Awakawa T, Crüsemann M, Munguia J, Ziemert N, Nizet V, Fenical W, Moore BS. Salinipyrone and pacificanone are biosynthetic by-products of the rosamicin polyketide synthase. ChemBioChem. 2015;16:1443–1447. doi: 10.1002/cbic.201500177. [DOI] [PMC free article] [PubMed] [Google Scholar]
- Bentley SD, Chater KF, Cerdeno-Tarraga AM, Challis GL, Thomson NR, James KD, et al. Complete genome sequence of the model actinomycete Streptomyces coelicolor A3(2) Nature. 2002;417:141–147. doi: 10.1038/417141a. [DOI] [PubMed] [Google Scholar]
- Berdy J. Bioactive microbial metabolites. A personal view. J Antibiot. 2005;58:1–26. doi: 10.1038/ja.2005.1. [DOI] [PubMed] [Google Scholar]
- Boddy C. Bioinformatics tools for genome mining of polyketide and non-ribosomal peptides. J Ind Microbiol Biotechnol. 2013;41:1–8. doi: 10.1007/s10295-013-1368-1. [DOI] [PubMed] [Google Scholar]
- Bonet B, Teufel R, Crüsemann M, Ziemert N, Moore BS. Direct capture and heterologous expression of Salinispora natural product genes for the biosynthesis of enterocin. J Nat Prod. 2014;78:539–542. doi: 10.1021/np500664q. [DOI] [PMC free article] [PubMed] [Google Scholar]
- Bose U, Hodson MP, Shaw PN, Fuerst JA, Hewavitharana AK. Bacterial production of the fungus-derived cholesterol-lowering agent mevinolin. Biomed Chrom. 2014;28:1163–1166. doi: 10.1002/bmc.3138. [DOI] [PubMed] [Google Scholar]
- Campbell MA, Rokas A, Slot JC. Horizontal transfer and death of a fungal secondary metabolic gene cluster. Gen Biol Evol. 2012;4:289–293. doi: 10.1093/gbe/evs011. [DOI] [PMC free article] [PubMed] [Google Scholar]
- Castro-Falcón G, Hahn D, Reimer D, Hughes CC. Thiol probes to detect electrophilic natural products based on their mechanism of action. ACS Chem Biol. 2016;11:2328–2336. doi: 10.1021/acschembio.5b00924. [DOI] [PMC free article] [PubMed] [Google Scholar]
- Challis GL. Mining microbial genomes for new natural products and biosynthetic pathways. Microbiol. 2008;154:1555–1569. doi: 10.1099/mic.0.2008/018523-0. [DOI] [PubMed] [Google Scholar]
- Chan AP, Sutton G, DePew J, Krishnakumar R, Choi Y, Huang XZ, et al. A novel method of consensus pan-chromosome assembly and large-scale comparative analysis reveal the highly flexible pan-genome of Acinetobacter baumannii. Genome Biol. 2015;16:143. doi: 10.1186/s13059-015-0701-6. [DOI] [PMC free article] [PubMed] [Google Scholar]
- Cimermancic P, Medema MH, Claesen J, Kurita K, Brown LCW, Mavrommatis K, et al. Insights into secondary metabolism from a global analysis of prokaryotic biosynthetic gene clusters. Cell. 2014;158:412–421. doi: 10.1016/j.cell.2014.06.034. [DOI] [PMC free article] [PubMed] [Google Scholar]
- Dobrindt U, Hochhut B, Hentschel U, Hacker J. Genomic islands in pathogenic and environmental microorganisms. Nat Rev Microbiol. 2004;2:414–424. doi: 10.1038/nrmicro884. [DOI] [PubMed] [Google Scholar]
- Duncan KR, Crüsemann M, Lechner A, Sarkar A, Li J, Ziemert N, et al. Molecular networking and pattern-based genome mining improves discovery of biosynthetic gene clusters and their products from Salinispora species. Chem Biol. 2015;22:460–471. doi: 10.1016/j.chembiol.2015.03.010. [DOI] [PMC free article] [PubMed] [Google Scholar]
- Egan S, Wiener P, Kallifidas D, Wellington EM. Transfer of streptomycin biosynthesis gene clusters within streptomycetes isolated from soil. Appl Environ Microbiol. 1998;64:5061–5063. doi: 10.1128/aem.64.12.5061-5063.1998. [DOI] [PMC free article] [PubMed] [Google Scholar]
- Eustáquio AS, Nam SJ, Penn K, Lechner A, Wilson MC, Fenical W, et al. The discovery of salinosporamide K from the marine bacterium “Salinispora pacifica” by genome mining gives insight into pathway evolution. ChemBioChem. 2011;12:61–64. doi: 10.1002/cbic.201000564. [DOI] [PMC free article] [PubMed] [Google Scholar]
- Ewing B, Hillier L, Wendl MC, Green P. Base-calling of automated sequencer traces using phred. I. Accuracy assessment. Genome Res. 1998;8:175–185. doi: 10.1101/gr.8.3.175. [DOI] [PubMed] [Google Scholar]
- Fischbach MA, Walsh CT. Assembly-line enzymology for polyketide and nonribosomal peptide antibiotics: logic, machinery, and mechanisms. Chem Rev. 2006;106:3468–3496. doi: 10.1021/cr0503097. [DOI] [PubMed] [Google Scholar]
- Fischbach MA, Walsh CT, Clardy J. The evolution of gene collectives: How natural selection drives chemical innovation. Proc Nat Acad Sci. 2008;105:4601–4608. doi: 10.1073/pnas.0709132105. [DOI] [PMC free article] [PubMed] [Google Scholar]
- Freel KC, Nam SJ, Fenical W, Jensen PR. Evolution of secondary metabolite genes in three closely related marine actinomycete species. Appl Environ Microbiol. 2011;77:7261–7270. doi: 10.1128/AEM.05943-11. [DOI] [PMC free article] [PubMed] [Google Scholar]
- Goering AW, McClure RA, Doroghazi JR, Albright JC, Haverland NA, Zhang Y, et al. Metabologenomics: Correlation of microbial gene clusters with metabolites drives discovery of a nonribosomal peptide with an unusual amino acid monomer. ACS Central Sci. 2016;2:99–108. doi: 10.1021/acscentsci.5b00331. [DOI] [PMC free article] [PubMed] [Google Scholar]
- Greunke C, Glöckle A, Antosch J, Gulder TA. Biocatalytic total synthesis of ikarugamycin. Angewandte Chemie Inter Ed. 2017;56:4351–4355. doi: 10.1002/anie.201611063. [DOI] [PubMed] [Google Scholar]
- Gross H. Strategies to unravel the function of orphan biosynthesis pathways: recent examples and future prospects. Appl Microbiol Biotechnol. 2007;75:267–277. doi: 10.1007/s00253-007-0900-5. [DOI] [PubMed] [Google Scholar]
- Harrison SJ, Mainwaring P, Price T, Millward MJ, Padrik P, Underhill CR, et al. Phase I clinical trial of marizomib (NPI-0052) in patients with advanced malignancies including multiple myeloma: Study NPI-0052-102 final results. Clinical Cancer Res. 2016;22:4559–4566. doi: 10.1158/1078-0432.CCR-15-2616. [DOI] [PubMed] [Google Scholar]
- Hertweck C. The biosynthetic logic of polyketide diversity. Angew Chem Int Ed. 2009;48:4688–4716. doi: 10.1002/anie.200806121. [DOI] [PubMed] [Google Scholar]
- Jensen PR. Natural products and the gene cluster revolution. Trends in microbiology. 2016;24:968–977. doi: 10.1016/j.tim.2016.07.006. [DOI] [PMC free article] [PubMed] [Google Scholar]
- Jensen PR, Moore BS, Fenical W. The marine actinomycete genus Salinispora: a model organism for secondary metabolite discovery. Nat Prod Rep. 2015;32:738–751. doi: 10.1039/c4np00167b. [DOI] [PMC free article] [PubMed] [Google Scholar]
- Juhas M, van der Meer JR, Gaillard M, Harding RM, Hood DW, Crook DW. Genomic islands: tools of bacterial horizontal gene transfer and evolution. FEMS Microbiol Rev. 2009;33:376–393. doi: 10.1111/j.1574-6976.2008.00136.x. [DOI] [PMC free article] [PubMed] [Google Scholar]
- Kersten RD, Lane AL, Nett M, Richter TKS, Duggan BM, Dorrestein PC, Moore BS. Bioactivity-guided genome mining reveals the lomaiviticin biosynthetic gene cluster in Salinispora tropica. ChemBioChem. 2013a;14:955–962. doi: 10.1002/cbic.201300147. [DOI] [PMC free article] [PubMed] [Google Scholar]
- Kersten RD, Ziemert N, Gonzalez DJ, Duggan BM, Nizet V, Dorrestein PC, Moore BS. Glycogenomics as a mass spectrometry-guided genome-mining method for microbial glycosylated molecules. Proc Natl Acad Sci. 2013b;110:4407–4416. doi: 10.1073/pnas.1315492110. [DOI] [PMC free article] [PubMed] [Google Scholar]
- Kim E, Moore BS, Yoon YJ. Reinvigorating natural product combinatorial biosynthesis with synthetic biology. Nat Chem Biol. 2015;11:649–659. doi: 10.1038/nchembio.1893. [DOI] [PMC free article] [PubMed] [Google Scholar]
- Krzywinski M, Schein J, Birol I, Connors J, Gascoyne R, Horsman D, et al. Circos: an information aesthetic for comparative genomics. Gen Res. 2009;19:1639–1645. doi: 10.1101/gr.092759.109. [DOI] [PMC free article] [PubMed] [Google Scholar]
- Lane AL, Nam SJ, Fukuda T, Yamanaka K, Kauffman CA, Jensen PR, et al. Structures and comparative characterization of biosynthetic gene clusters for cyanosporasides, enediyne-derived natural products from marine actinomycetes. J Am Chem Soc. 2013;135:4171–4174. doi: 10.1021/ja311065v. [DOI] [PMC free article] [PubMed] [Google Scholar]
- Letunic I, Bork P. Interactive tree of life (iTOL) v3: an online tool for the display and annotation of phylogenetic and other trees. Nucl Acids Res. 2016;44:242–245. doi: 10.1093/nar/gkw290. [DOI] [PMC free article] [PubMed] [Google Scholar]
- Li H, Durbin R. Fast and accurate long-read alignment with Burrows-Wheeler transform. Bioinformatics. 2010;26:589–595. doi: 10.1093/bioinformatics/btp698. [DOI] [PMC free article] [PubMed] [Google Scholar]
- Liao Y, Smyth GK, Shi W. featureCounts: an efficient general purpose program for assigning sequence reads to genomic features. Bioinformatics. 2014;30:923–930. doi: 10.1093/bioinformatics/btt656. [DOI] [PubMed] [Google Scholar]
- Maddison WP, Maddison DR. Mesquite: a modular system for evolutionary analysis 2011 [Google Scholar]
- McGlinchey RP, Nett M, Moore BS. Unraveling the biosynthesis of the sporolide cyclohexenone building block. J Am Chem Soc. 2008;130:2406–2407. doi: 10.1021/ja710488m. [DOI] [PubMed] [Google Scholar]
- Medema MH, Kottmann R, Yilmaz P, Cummings M, Biggins JB, Blin K, et al. Minimum information about a biosynthetic gene cluster. Nat Chem Biol. 2015;11:625–631. doi: 10.1038/nchembio.1890. [DOI] [PMC free article] [PubMed] [Google Scholar]
- Metsa-Ketela M, Halo L, Munukka E, Hakala J, Mantsala P, Ylihonko K. Molecular evolution of aromatic polyketides and comparative sequence analysis of polyketide ketosynthase and 16S ribosomal DNA genes from various Streptomyces species. Appl Environ Microbiol. 2002;68:4472–4479. doi: 10.1128/AEM.68.9.4472-4479.2002. [DOI] [PMC free article] [PubMed] [Google Scholar]
- Millán-Aguiñaga N, Chavarria KL, Ugalde JA, Letzel AC, Rouse GW, Jensen PR. Phylogenomic insight into Salinispora (Bacteria, Actinobacteria) species designations. Scientific Reports. 2017;7:3564. doi: 10.1038/s41598-017-02845-3. [DOI] [PMC free article] [PubMed] [Google Scholar]
- Miyanaga A, Janso JE, McDonald L, He M, Liu H, Barbieri L, et al. Discovery and assembly-line biosynthesis of the lymphostin pyrroloquinoline alkaloid family of mTOR inhibitors in Salinispora bacteria. J Am Chem Soc. 2011;133:13311–13313. doi: 10.1021/ja205655w. [DOI] [PMC free article] [PubMed] [Google Scholar]
- Mortazavi A, Williams BA, McCue K, Schaeffer L, Wold B. Mapping and quantifying mammalian transcriptomes by RNA-Seq. Nat Methods. 2008;5:621–628. doi: 10.1038/nmeth.1226. [DOI] [PubMed] [Google Scholar]
- Nett M, Ikeda H, Moore BS. Genomic basis for natural product biosynthetic diversity in the actinomycetes. Nat Prod Rep. 2009;26:1362–1384. doi: 10.1039/b817069j. [DOI] [PMC free article] [PubMed] [Google Scholar]
- Newman DJ, Cragg GM. Natural products as sources of new drugs over the 30 years from 1981 to 2010. J Nat Prod. 2012;75:311–335. doi: 10.1021/np200906s. [DOI] [PMC free article] [PubMed] [Google Scholar]
- Nielsen JC, Grijseels S, Prigent S, Ji B, Dainat J, Nielsen KF, et al. Global analysis of biosynthetic gene clusters reveals vast potential of secondary metabolite production in Penicillium species. Nat Microbiol. 2017;2:17044. doi: 10.1038/nmicrobiol.2017.44. [DOI] [PubMed] [Google Scholar]
- Ochman H, Lawrence JG, Groisman EA. Lateral gene transfer and the nature of bacterial innovation. Nature. 2000;405:299–304. doi: 10.1038/35012500. [DOI] [PubMed] [Google Scholar]
- Ogasawara Y, Kawata J, Noike M, Satoh Y, Furihata K, Dairi T. Exploring peptide ligase orthologs in Actinobacteria - Discovery of pseudopeptide natural products, ketomemicins. ACS chemical biology. 2016;11:1686–1692. doi: 10.1021/acschembio.6b00046. [DOI] [PubMed] [Google Scholar]
- Patin NV, Duncan KR, Dorrestein PC, Jensen PR. Competitive strategies differentiate closely related species of marine actinobacteria. ISME J. 2015;10:478–490. doi: 10.1038/ismej.2015.128. [DOI] [PMC free article] [PubMed] [Google Scholar]
- Penn K, Jenkins C, Nett M, Udwary DW, Gontang EA, McGlinchey RP, et al. Genomic islands link secondary metabolism to functional adaptation in marine Actinobacteria. ISME J. 2009;3:1193–1203. doi: 10.1038/ismej.2009.58. [DOI] [PMC free article] [PubMed] [Google Scholar]
- Price MN, Dehal PS, Arkin AP. FastTree 2–approximately maximum-likelihood trees for large alignments. PloS one. 2010;5:e9490. doi: 10.1371/journal.pone.0009490. [DOI] [PMC free article] [PubMed] [Google Scholar]
- Price-Whelan A, Dietrich LE, Newman D. Rethinking‘secondary’metabolism: physiological roles for phenazine antibiotics. Nat Chem Biol. 2006;2:71–78. doi: 10.1038/nchembio764. [DOI] [PubMed] [Google Scholar]
- Richter TK, Hughes CC, Moore BS. Sioxanthin, a novel glycosylated carotenoid, reveals an unusual subclustered biosynthetic pathway. Environ Microbiol. 2015;17:2158–2171. doi: 10.1111/1462-2920.12669. [DOI] [PMC free article] [PubMed] [Google Scholar]
- Roberts AA, Schultz AW, Kersten RD, Dorrestein PC, Moore BS. Iron acquisition in the marine actinomycete genus Salinispora is controlled by the desferrioxamine family of siderophores. FEMS Microbiol Lett. 2012;335:95–103. doi: 10.1111/j.1574-6968.2012.02641.x. [DOI] [PMC free article] [PubMed] [Google Scholar]
- Rodriguez-Valera F, Martin-Cuadrado AB, López-Pérez M. Flexible genomic islands as drivers of genome evolution. Curr Opin Microbiol. 2016;31:154–160. doi: 10.1016/j.mib.2016.03.014. [DOI] [PubMed] [Google Scholar]
- Rutherford K, Parkhill J, Crook J, Horsnell T, Rice P, Rajandream MA, Barrell B. Artemis: sequence visualization and annotation. Bioinformatics. 2000;16:944–945. doi: 10.1093/bioinformatics/16.10.944. [DOI] [PubMed] [Google Scholar]
- Sandy M, Butler A. Microbial iron acquisition: marine and terrestrial siderophores. Chemical Reviews. 2009;109:4580–4595. doi: 10.1021/cr9002787. [DOI] [PMC free article] [PubMed] [Google Scholar]
- Schultz AW, Oh DC, Carney JR, Williamson RT, Udwary DW, Jensen PR, et al. Biosynthesis and structures of cyclomarins and cyclomarazines, prenylated cyclic peptides of marine actinobacterial origin. J Am Chem Soc. 2008;130:4507–4516. doi: 10.1021/ja711188x. [DOI] [PubMed] [Google Scholar]
- Schulze CJ, Navarro G, Ebert D, DeRisi J, Linington RG. Salinipostins A–K, long-chain bicyclic phosphotriesters as a potent and selective antimalarial chemotype. J Org Chem. 2015;80:1312–1320. doi: 10.1021/jo5024409. [DOI] [PubMed] [Google Scholar]
- Seyedsayamdost MR. High-throughput platform for the discovery of elicitors of silent bacterial gene clusters. Proc Natl Acad Sci. 2014;111:7266–7271. doi: 10.1073/pnas.1400019111. [DOI] [PMC free article] [PubMed] [Google Scholar]
- Tang X, Li J, Millán-Aguiñaga N, Zhang JJ, O'Neill EC, Ugalde JA, et al. Identification of thiotetronic acid antibiotic biosynthetic pathways by target-directed genome mining. ACS Chem Biol. 2015;10:2841–2849. doi: 10.1021/acschembio.5b00658. [DOI] [PMC free article] [PubMed] [Google Scholar]
- Udwary DW, Zeigler L, Asolkar RN, Singan V, Lapidus A, Fenical W, et al. Genome sequencing reveals complex secondary metabolome in the marine actinomycete Salinispora tropica. Proc Natl Acad Sci. 2007;104:10376–10381. doi: 10.1073/pnas.0700962104. [DOI] [PMC free article] [PubMed] [Google Scholar]
- Villadsen NL, Jacobsen KM, Keiding UB, Weibel ET, Christiansen B, Vosegaard T, et al. Synthesis of ent-BE-43547A1 reveals a potent hypoxia-selective anticancer agent and uncovers the biosynthetic origin of the APD-CLD natural products. Nat Chem. 2016 doi: 10.1038/nchem.2657. [DOI] [PubMed] [Google Scholar]
- Waters CM, Bassler BL. Quorum sensing: cell-to-cell communication in bacteria. Annu Rev Cell Dev Biol. 2005;21:319–346. doi: 10.1146/annurev.cellbio.21.012704.131001. [DOI] [PubMed] [Google Scholar]
- Weber T. In silico tools for the analysis of antibiotic biosynthetic pathways. Int J Med Microbiol. 2014;304:230–235. doi: 10.1016/j.ijmm.2014.02.001. [DOI] [PubMed] [Google Scholar]
- Wietz M, Duncan K, Patin N, Jensen P. Antagonistic interactions mediated by marine bacteria: The role of small molecules. J Chem Ecol. 2013;39:879–891. doi: 10.1007/s10886-013-0316-x. [DOI] [PubMed] [Google Scholar]
- Williams PG, Miller ED, Asolkar RN, Jensen PR, Fenical W. Arenicolides A-C, 26-membered ring macrolides from the marine actinomycete Salinispora arenicola. J Org Chem. 2007;72:5025–5034. doi: 10.1021/jo061878x. [DOI] [PMC free article] [PubMed] [Google Scholar]
- Wilson MC, Gulder TAM, Mahmud T, Moore BS. Shared biosynthesis of the saliniketals and rifamycins in Salinispora arenicola is controlled by the sare1259-encoded cytochrome P450. J Am Chem Soc. 2010;132:12757–12765. doi: 10.1021/ja105891a. [DOI] [PMC free article] [PubMed] [Google Scholar]
- Winter JM, Behnken S, Hertweck C. Genomics-inspired discovery of natural products. Curr Opin Chem Biol. 2011;15:22–31. doi: 10.1016/j.cbpa.2010.10.020. [DOI] [PubMed] [Google Scholar]
- Xu M, Hillwig ML, Lane AL, Tiernan MS, Moore BS, Peters RJ. Characterization of an orphan diterpenoid biosynthetic operon from Salinispora arenicola. J Nat Prod. 2014;77:2144–2147. doi: 10.1021/np500422d. [DOI] [PMC free article] [PubMed] [Google Scholar]
- Ziemert N, Alanjary M, Weber T. The evolution of genome mining in microbes–a review. Nat Prod Rep. 2016;33:988–1005. doi: 10.1039/c6np00025h. [DOI] [PubMed] [Google Scholar]
- Ziemert N, Lechner A, Wietz M, Millan-Aguinaga N, Chavarria KL, Jensen PR. Diversity and evolution of secondary metabolism in the marine actinomycete genus Salinispora. Proc Natl Acad Sci. 2014;111:1130–1139. doi: 10.1073/pnas.1324161111. [DOI] [PMC free article] [PubMed] [Google Scholar]
Associated Data
This section collects any data citations, data availability statements, or supplementary materials included in this article.