ABSTRACT
Cucumber necrosis virus (CNV) is a member of the genus Tombusvirus and has a monopartite positive-sense RNA genome. CNV is transmitted in nature via zoospores of the fungus Olpidium bornovanus. As with other members of the Tombusvirus genus, the CNV capsid swells when exposed to alkaline pH and EDTA. We previously demonstrated that a P73G mutation blocks the virus from zoospore transmission while not significantly affecting replication in plants (K. Kakani, R. Reade, and D. Rochon, J Mol Biol 338:507–517, 2004, https://doi.org/10.1016/j.jmb.2004.03.008). P73 lies immediately adjacent to a putative zinc binding site (M. Li et al., J Virol 87:12166–12175, 2013, https://doi.org/10.1128/JVI.01965-13) that is formed by three icosahedrally related His residues in the N termini of the C subunit at the quasi-6-fold axes. To better understand how this buried residue might affect vector transmission, we determined the cryo-electron microscopy structure of wild-type CNV in the native and swollen state and of the transmission-defective mutant, P73G, under native conditions. With the wild-type CNV, the swollen structure demonstrated the expected expansion of the capsid. However, the zinc binding region at the quasi-6-fold at the β-annulus axes remained intact. By comparison, the zinc binding region of the P73G mutant, even under native conditions, was markedly disordered, suggesting that the β-annulus had been disrupted and that this could destabilize the capsid. This was confirmed with pH and urea denaturation experiments in conjunction with electron microscopy analysis. We suggest that the P73G mutation affects the zinc binding and/or the β-annulus, making it more fragile under neutral/basic pH conditions. This, in turn, may affect zoospore transmission.
IMPORTANCE Cucumber necrosis virus (CNV), a member of the genus Tombusvirus, is transmitted in nature via zoospores of the fungus Olpidium bornovanus. While a number of plant viruses are transmitted via insect vectors, little is known at the molecular level as to how the viruses are recognized and transmitted. As with many spherical plant viruses, the CNV capsid swells when exposed to alkaline pH and EDTA. We previously demonstrated that a P73G mutation that lies inside the capsid immediately adjacent to a putative zinc binding site (Li et al., J Virol 87:12166–12175, 2013, https://doi.org/10.1128/JVI.01965-13) blocks the virus from zoospore transmission while not significantly affecting replication in plants (K. Kakani, R. Reade, and D. Rochon, J Mol Biol 338:507–517, 2004, https://doi.org/10.1016/j.jmb.2004.03.008). Here, we show that the P73G mutant is less stable than the wild type, and this appears to be correlated with destabilization of the β-annulus at the icosahedral 3-fold axes. Therefore, the β-annulus appears not to be essential for particle assembly but is necessary for interactions with the transmission vector.
KEYWORDS: RNA virus, cryo-EM, protein structure-function
INTRODUCTION
Cucumber necrosis virus (CNV) is a member of the genus Tombusvirus and has a monopartite positive-sense RNA genome (1, 2). CNV is transmitted in nature via zoospores of the Chytridiomycete fungus, Olpidium bornovanus (1, 3, 4). These viruses have a T=3 icosahedral protein shell with a maximum diameter of ∼340 Å. Each capsid protein is comprised of three domains: R, S, and P. The first ∼58 residues at the N-terminal region are disordered in the CNV crystal structure and comprise the R domain since it interacts with the RNA interior. Between this region (R) and the next domain (S) are ∼34 residues that act as a flexible connecting “arm.” The next ∼170 residues comprise the S domain, so named because it forms the tight protein shell that encapsidates the RNA genome. The final ∼110 residues form the P domains that combine with the P domain from adjacent subunits to form dimeric protrusions on the shell. The A subunits encircle the icosahedral 5-fold axes, and their P domains interact with the P domains of adjacent B subunits to form dimeric protrusions. In contrast, the C subunits form homodimers across the icosahedral 2-fold axes. Only the arm region of the C subunits is observed in the crystal structure, and ∼17 residues of this region form β-annuli at the icosahedral 3-fold axes. The entire R and arm regions (up to residue ∼100) are disordered in the A and B subunits. This difference in the arm structure is likely due to necessary differences in the angle between the S domain contacts in the intact capsid structure. The S domains in the C-C subunit dimers are relatively flat, with the ordered arms lying between the dimers, whereas the S domains in the A-B pairs are more angled, leaving no room for the arm structure.
From our crystal structure of CNV (5), it is evident that the core structure of CNV is highly similar to that of tomato bushy stunt virus (TBSV) (6), with major differences lying on the exposed loops. Also as was seen with TBSV, CNV appears to have calcium binding sites between the subunits around the quasi-3-fold axes. However, unlike TBSV, there appears to be a novel zinc binding site within the β-annulus formed by the N termini of the three C subunits at the icosahedral 3-fold axes (5) (Fig. 1). Two transmission-defective mutants map immediately around this zinc binding site (7), with the P73G mutation lying immediately above the putative zinc binding site. With this mutation, CNV grows well in plants when manually inoculated, can still bind to zoospores, but is no longer vector transmitted. While wild-type CNV becomes markedly sensitive to trypsin digestion when treated with alkaline pH buffers in the presence of EDTA or after interaction with the zoospore vector, the P73G mutant appeared to be less sensitive to trypsinolysis (7). It was hypothesized that the mutation of the proline residue at position 73 to glycine (mutant P73G) altered the capacity of the A and B subunit arms to extrude from the capsid, thus affecting transmissibility. In the manuscript we present an additional possibility for reduced transmission that is due to destabilization of the P73G capsid via disruption of the β-annulus. Nevertheless, even though P73 is buried in the capsid, it appears to be intimately involved in zoospore transmission.
FIG 1.
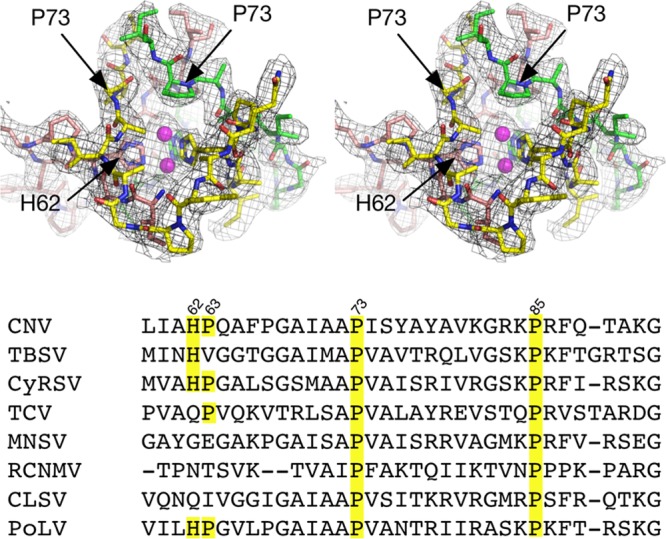
Location of residue P73 in CNV and associated density in the 3.0-Å X-ray structure at the putative zinc binding region at the quasi-6-fold axis. The top figure is a stereo pair and represents the crystal structure of C subunit termini involved in zinc binding with the RNA interior toward the bottom of the figure. For clarity, the backbone atoms are shown in green, yellow, and mauve for the three C subunits. The model has two alternative positions for zinc based on the electron density, and these are represented by mauve spheres. At bottom is the sequence alignment of various tombusviruses in that region. CyRSV, cymbidium ringspot tombusvirus; TCV, turnip crinkle virus; MNSV, melon necrotic spot virus; RCNMV, red clover necrotic mosaic virus; CLSV, cucumber leaf spot virus; PoLV, pathos latent virus.
Presented here are the cryo-electron microscopy (cryo-EM) structures of wild-type CNV under native conditions (resolution at a Fourier shell correlation of 0.5 [FSC1/2] is 6.8 Å), in the swollen state (FSC1/2 of 9.9 Å), and the P73G mutant under native conditions (FSC1/2 of 4.5 Å and an FSC 0.143 of 4.2 Å). In the wild-type native and swollen structures, the putative zinc binding structure is well ordered. However, even under native conditions, this same region is badly disordered in the P73G mutant. In addition, urea denaturation studies clearly demonstrate that the wild-type virus is markedly more stable than the P73G mutant. Together, these results suggest that P73 plays a significant role in stabilizing the β-annulus at the quasi-6-fold axis and, in turn, helps keep the capsid intact under swelling conditions. Together, this suggests that the loss of zoospore transmission with the P73G mutation may be due, at least in part, to destabilization of the capsid.
RESULTS
Cryo-EM structures of CNV.
The main goal of this project was to determine how a mutation in an internal residue of the CNV particle, P73G, could affect vector transmission. Previously, it was suggested that the glycine substitution altered the structure of the A and B subunit arms such that they could not extrude from the particle, and this blocked zoospore transmission (7). When the P73G mutant is mechanically inoculated on leaves, it yields nearly as much virus as the wild type but cannot be transmitted by zoospores (8). Therefore, the structure of the mutant was needed to ascertain whether the mutation might have caused large conformational changes or capsid stabilization that might explain the lack of vector transmission. While the wild-type virus readily formed crystals in 0.16 M PIPES [piperazine-N,N-bis(2-ethanesulfonic acid)] buffer and 3.2 M sodium formate, pH 6.0, numerous attempts to crystallize the P73G mutant failed to produce even small crystals. Therefore, cryo-EM was necessary for structure determination.
While we had previously determined the atomic structure of CNV (5), the cryo-EM structure of wild-type CNV under native conditions was determined so that the P73G mutant and native structures could be directly compared using the same conditions and methodologies. Similarly, the wild-type cryo-EM structure under native conditions makes for a more direct comparison to the structure of the swollen state. The FSC1/2 resolutions of the wild type under native conditions, wild type under swelling conditions (50 mM sodium phosphate, pH 7.6, with 25 mM EDTA), and the P73G mutant under native conditions (50 mM sodium acetate, pH 5.0) were 5.8 Å, 9.9 Å, and 4.5 Å, respectively. Using the program ResMap (9) the mean resolutions were estimated to be 2.7 Å, 5.9 Å, and 2.9 Å for the wild-type native, wild-type swollen, and P73G reconstructions, respectively. All three values are highly optimistic and do not match the observed level of detail.
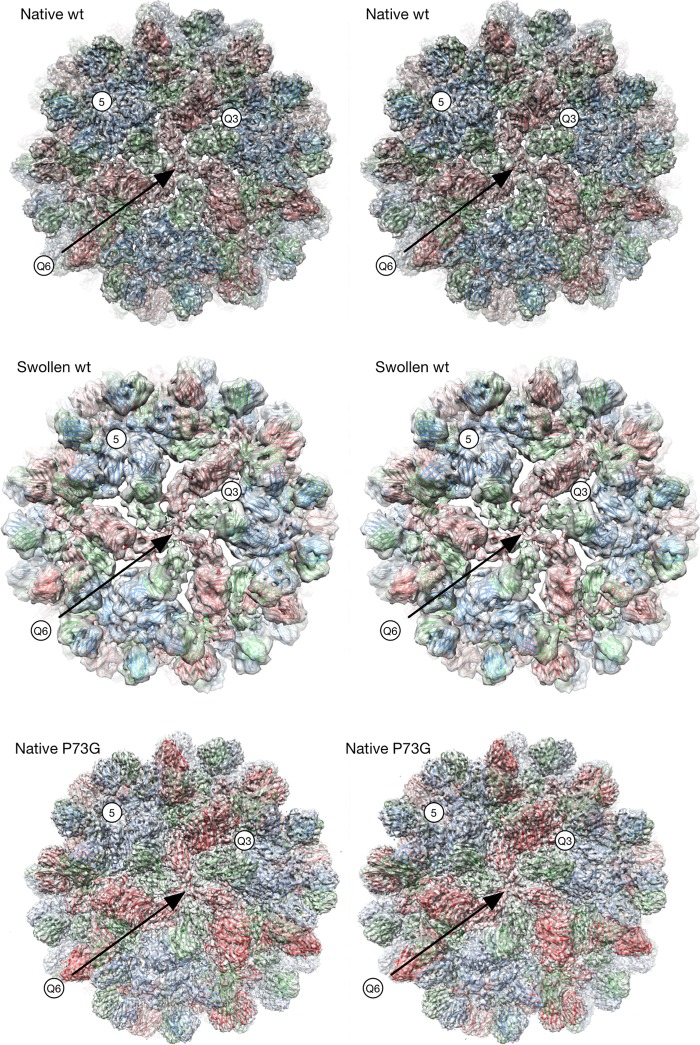
As shown in Fig. 2, the crystal structure of CNV fits well into the wild-type CNV cryo-EM structure under native conditions. No adjustments to the model were needed to fit this structure into the cryo-EM envelope. As expected for this resolution, many of the loops are well defined, but there were some spurious electron density connections between the β-strands within β-sheets. At higher resolution, the strands of the sheet appear as individual, unconnected strands. Nevertheless, this clearly shows that the capsid conformation under high-salt crystallization conditions is the same as that of the low-ionic-strength conditions used for cryo-EM.
FIG 2.
Cryo-EM structures of the wild-type CNV in the native and swollen states and P73G in the native state. The stereo pairs are centered on the quasi-6-fold axis (Q6). The model for the native wild-type (wt) and P73G mutants is the unmodified crystal structure of CNV (5) while that of the swollen wild-type virion is the same crystal structure fitted into the density using Situs (10). The A, B, and C subunits are shown in blue, green, and red, respectively. Q3, quasi-3-fold axis.
Also shown in Fig. 2 is the structure of wild-type CNV under swelling conditions. At pH 7.6, in the presence of EDTA, the diameter of the particle swells by approximately 28 Å. The crystal structure of the entire CNV was first fit into the swollen shell and then refined using Situs (10). However, it was clear that the P and S domains needed to be split in order to better fit the density. Therefore, each of the subunits of the Situs-refined model was split into the two domains and then fitted individually using Chimera (11).
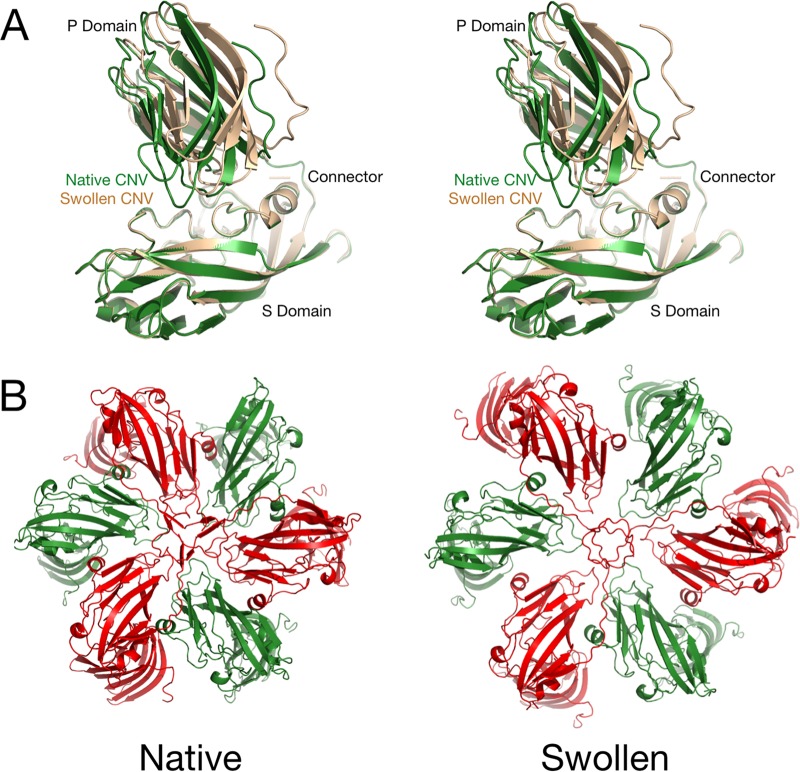
In the model of the swollen state, the subunits spread apart at the quasi-3-fold axes that lie between the A, B, and C subunits. As was previously shown with TBSV (12), this is likely due to the loss of calcium ions at this axis, resulting in intersubunit repulsion due to the remaining cluster of acidic residues. P domains from adjacent subunits form dimers, and these dimers must remain intact even as the subunits move to greater radii and spread away from each other. To maintain P domain interactions during swelling, the P domains flex at the connector region and move relative to the shell (Fig. 3). In spite of this swelling, the 5-fold pentons and annulus at the quasi-6-fold axes remain intact although the shell domains around the quasi-6-fold axes spread apart.
FIG 3.
Conformational changes in CNV during the swelling process. (A) Stereo pair of the B subunit under native (green) and swollen (wheat) conditions. The models were aligned using the shell (S) domain as a guide. Notice the large movement of the P domain with respect to the S domain as the subunits are splayed apart during swelling. (B) Differences between the crystal structure at the quasi-6-fold axis and the cryo-EM structure of the wild-type swollen particle. The B and C subunits are shown in green and red, respectively.
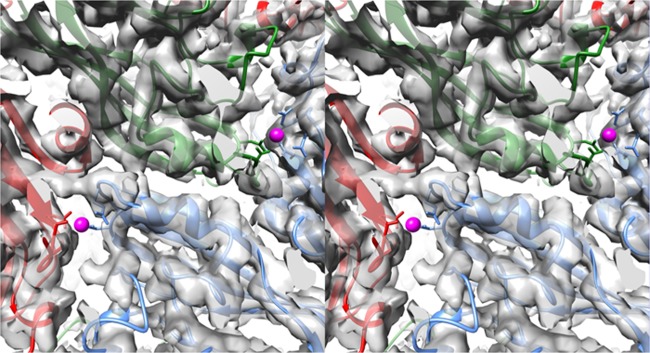
Without any adjustments, the crystal structure of native CNV fits well into the P73G cryo-EM density. An example of the electron density of the capsid region is shown in Fig. 4. While only some of the bulkier side chains are apparent in the electron density, the density well describes the backbone structure. Without any adjustment to the model, the crystal structure of CNV fits well into the density of the P73G image reconstruction.
FIG 4.
Example density of the P73G mutant cryo-EM structure under native conditions. In these stereo pairs, the A, B, and C subunits are colored blue, green, and red, respectively. Calcium ions were identified in the X-ray structure (5) and are represented by mauve spheres.
While nearly all of the P73G density matched extremely well with the native crystal structure, there were significant differences in the β-annulus structures at the inner surface of the quasi-6-fold axes (Fig. 5). In these figures, the view is from inside the virus looking into the quasi-6-fold β-annulus. The top figure is the 3.0-Å X-ray density of the wild-type native structure. The mauve sphere represents the putative bound zinc. Even at this resolution, the electron density of the annulus is well ordered and appears to be plugged by the zinc ion. The next figure is of the same region in the ∼5.8-Å resolution cryo-EM structure of the wild-type CNV under native conditions. The annulus is also well ordered here, with the strands comprising the annulus clearly visible. Therefore, the annulus appears well ordered at these two resolutions using two different structural techniques. The next image is the ∼9.9-Å cryo-EM structure of the wild-type swollen CNV annulus. Even though the capsid is in the swollen conformation and the reconstruction is at a lower resolution, the annulus is still a prominent feature protruding into the interior of the capsid. This suggests that even as the subunits are being pulled away from the quasi-6-fold axis during swelling, they are tethered together by the annulus. The greatest difference in this area is in the 4.2-Å cryo-EM density of the P73G mutant under native conditions. Even though the strands of the capsid are clear all around the quasi-6-fold axis, the annulus itself is markedly disordered. Indeed, while the other structure shows a plugged quasi-6-fold pore, the P73G mutant has an unobstructed hole at the axis. It seems more than coincidental that this disorder is exactly at the location of the P73G mutant as shown in Fig. 1. From all of these results, it seems clear that the P73G mutation is destabilizing the quasi-6-fold axis either by eliminating the kink in the strands that bend the N termini into the β-annulus conformation and/or by destroying the zinc binding site.
FIG 5.
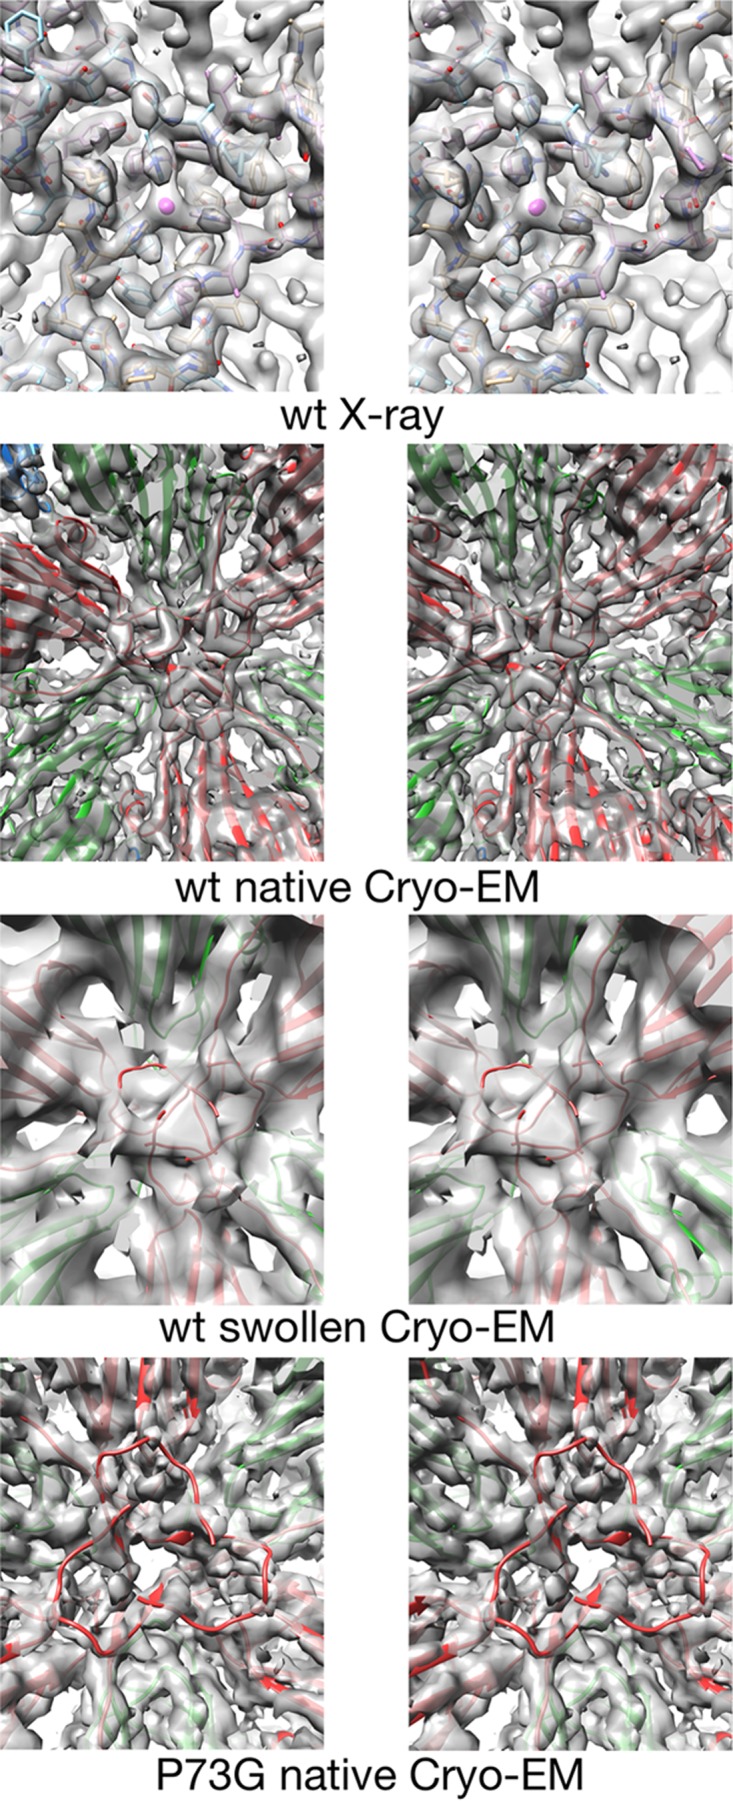
Stereo pairs of electron density of the inner surface of the capsid at the quasi-6-fold axis. The top panels show the density of the crystallographic structure of CNV at the quasi-6-fold axis (5). The mauve sphere in the center represents the putative zinc ion chelated by three icosahedrally related C-chain His residues. Subsequent panels show the density of the cryo-EM structure of the wild-type (wt) CNV under native conditions (FSC1/2 of 6.8 Å) and under swollen conditions (FSC1/2 of 9.9 Å), as indicated. The model shown at the annulus is from the native, wild-type structure even though the C subunits are displaced from the quasi-6-fold axis due to the swelling. The bottom panels show the cryo-EM structure of the P73G annulus under native conditions (FSC 0.143 of 4.2 Å and FSC1/2 of 4.5 Å). While the density of the subunits around the annulus is well defined, the metal binding area at the annulus is badly disordered.
Urea denaturation studies.
From Fig. 5, it is apparent that the P73G mutation has a destabilizing effect on the β-annulus. The next question is whether this localized disorder translates to effects on the entire capsid. To this end, the stability of the P73G mutant was compared to that of the wild type in the presence of increasing concentrations of urea as was previously done with cucumber mosaic virus (13).
For this experiment, wild-type and P73G CNVs were exposed to increasing concentrations of urea under swelling conditions (50 mM sodium phosphate, pH 7.6, with 25 mM EDTA). In Fig. 6, the top panel shows the migration of these samples in agarose. The dotted boxes show the regions of the gel that were cut out and then applied to SDS-PAGE gels to look for the presence of capsid protein. In the first lane, the untreated and swollen wild-type CNV samples ran as single bands. As the urea was increased in the swelling buffer during the 1-h incubation, the virions apparently started to aggregate until they formed such large species that the sample barely left the well at 3 M urea. As the SDS-PAGE demonstrates, the major band in the ethidium bromide-stained agarose gel contains both viral RNA and capsid protein.
FIG 6.
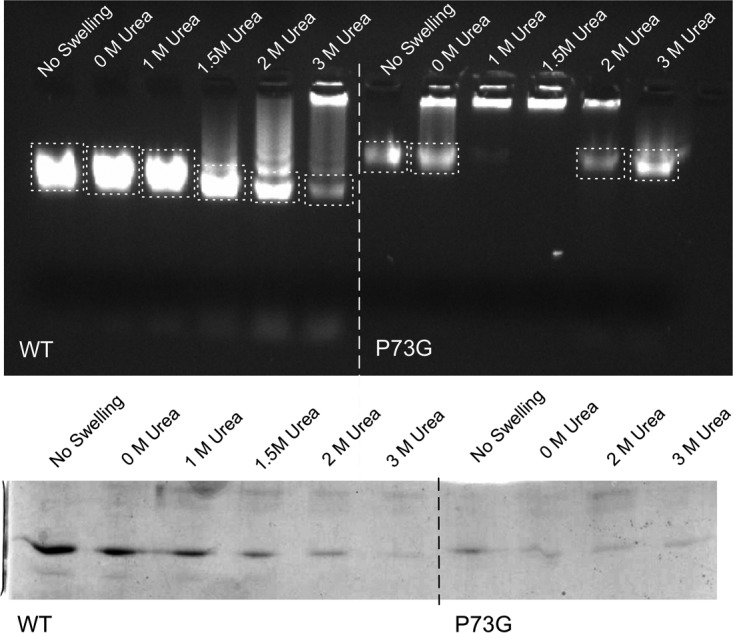
Particle stability as measured by resistance to urea denaturation. The top figure shows the effects of urea on CNV mobility in a 1% agar gel made from 0.5× TB buffer, pH 8.3, that contained ethidium bromide for visualization. The loading well is located at the top of the gel. The dashed boxes denote the sections of the gel that were excised and run on an SDS-PAGE gel. The bottom figure shows an SDS-PAGE gel of the excised bands indicated in the top panel. Only the lower bands from the agar gel were analyzed by SDS-PAGE. Note that with the P73G mutant, the lower band disappears at 1 M urea and then reappears at higher urea concentrations.
The P73G CNV mutant shows significantly different results under these same conditions. Even when the mutant virus was not treated with swelling buffer, the major band in the agarose gel migrated more slowly than that of the wild-type virus. The simplest explanation for this would be that, even without being exposed to EDTA, the virus swelled and/or aggregated when loaded onto an agarose gel with a pH of 8.3. As shown in the SDS-PAGE gel beneath, this band contains capsid protein. However, when the P73G mutant is exposed to the swelling buffer without any addition of urea, a major portion of the virus becomes a large aggregate that does not leave the well. This aggregation is further exacerbated when the urea is increase to 1 M and 1.5 M urea. However, when the urea concentration is further increased to above 2 M, the major band reappears and seems to contain some capsid protein. The simplest explanation for these observations is that the mutant is swelling and losing integrity at high pH, even in the absence of EDTA, and forming large aggregates of damaged particles. As the urea concentration is further increased, these aggregates are resolubilized and form a band in the agarose that represents RNA/protein complexes. It is interesting that the protein band in the 2 M urea wild-type sample is stronger than in 3 M urea while the ethidium bromide-stained agarose gel showed the opposite effect. It is possible that the mutant virus band in the agarose gel has a higher RNA/protein ratio than the wild-type virus sample.
The samples from the urea denaturation studies were examined using negative stain and electron microscopy to evaluate the integrity of the particles after various treatments. As expected from the cryo-EM image reconstructions, the wild-type and P73G particles under native conditions (50 mM sodium acetate, pH 5.0) were identical in appearance (Fig. 7). When the particles were treated with swelling buffer for 1 h, there were clear differences. The wild-type particles appeared still intact but were now stained in the core. In contrast, the P73G mutant was more sensitive to the high pH and EDTA treatment. After treatment with the swelling buffer, there were far more disrupted particles than wild-type particles, and those that remained formed large aggregates on the grid. This is consistent with the agarose gel results that suggested that treating the mutant virus with swelling buffer created large aggregates in solution. The bottom figures show the results of treating the virions with 3 M urea in swelling buffer. Both wild-type and P73G virions are badly denatured, but the P73G mutant appears more disrupted than the wild type. In the agarose gels, 3 M urea breaks up the P73G aggregates that did not leave the loading well. However, it is clear from the EM images that the particles have been broken into small fragments. With the wild-type virions, most of the virus is trapped in the loading well, and the negative-stain images suggest that all of the particles are disrupted but not to the same degree as observed with the P73G mutant. These results suggest that treating the mutant virus with even higher urea concentrations caused the aggregates to resolubilize, allowing them to enter the gel. However, the P73G mutant is clearly more sensitive to urea and swelling than the wild type.
FIG 7.
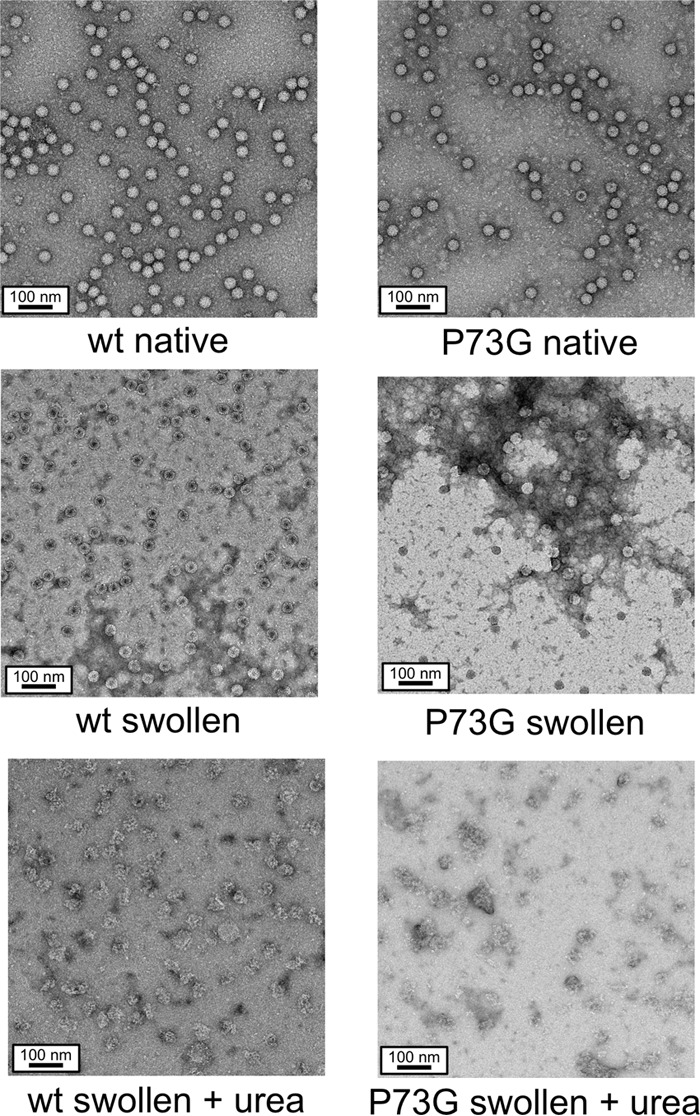
Negative-stain EM images of representative samples from the urea denaturation experiments. Under native conditions (i.e., pH 5.0), both the P73G and wild-type virions are uniform and monodispersed. Upon incubation in the swelling buffer, the wild-type virions expand; their cores are penetrated by stain but are still well dispersed. In contrast, the P73G particles are more heterogeneous in shape and form large aggregates. The bottom figures show the differences between the wild type and the P73G mutant under swelling conditions in the presence of 3 M urea. In the case of the P73G mutant, while the major virus band reappears in the agarose gel at 3 M urea, this sample contains only disrupted virions.
DISCUSSION
In a manner very similar to that of other members of the Tombusvirus genus (12), CNV swells when the virions are exposed to slightly alkaline pH and EDTA. There is a cluster of acidic residues at the quasi-3-fold axes that comes together to bind a metal ion, presumably calcium. When the metal is removed with EDTA and the pH is above neutrality, the charge on these side chains becomes negative and causes repulsion between the A, B, and C subunits and likely causes the expansion of the capsid. The P domains from adjacent subunits form dimers that need to remain intact during the swelling process. To this end, the relatively flexible connector between the P and S domains stretches and causes a shift of the P domain relative to the S domain.
The P and S domains themselves remain as independent rigid bodies during the swelling. With the wild-type virus, the interactions of the A subunits immediately around the 5-fold axis seem unperturbed by the expansion. The B and C subunits around the quasi-6-fold axes appear to spread away from the 6-fold axes and away from each other. However, if the entire subunits are translated away from the axes, the resulting positions of the C subunit N termini that form the β-annulus are moved out of the density. Indeed, the β-annulus from the CNV crystal structure fits well into the annulus density of the model of the swollen state. Therefore, the interactions among the A subunits at the 5-fold axis and the β-annulus formed by the C subunits act to hold the particle together during the swelling process.
While nearly all of the P73G cryo-EM structure agrees extremely well with the crystal structure of CNV and the cryo-EM structure under native conditions, there are significant differences in the β-annulus structures. This feature is very well ordered in both the crystal and cryo-EM structures (with resolutions ranging from 9.9 to 3 Å). However, even under native conditions (50 mM sodium acetate, pH 5.0), this region is completely disordered in the P73G mutant.
Since all of the tombusviruses have a proline at amino acid position 73 (Fig. 1) this suggests that the N terminus requires the unique conformation afforded by proline and that the increased flexibility of a glycine at this position does not create the proper conformation. The Pro-to-Gly mutation could be affecting this region in a couple of different ways. In the case of CNV, it might be distorting the β-annulus such that it can no longer bind the putative zinc ion, thereby destabilizing this feature. Alternatively, it may be that the proline is required to create the β-annulus in all of the tombusviruses and that the effects on the zinc binding have a relatively minor contribution to the formation of the annulus.
When the plants are manually inoculated, the yield of the P73G mutant is nearly as high as that of wild-type-inoculated plants. The mutant can also bind to the zoospore, so the interactions between the virion and receptor are also unaffected. Therefore, the results with the P73G mutant suggest that the β-annulus itself is not required for capsid assembly but is required for transmission. The results of the urea denaturation studies suggest that the P73G mutant may be affecting transmission by destabilizing the capsid. Therefore, these results suggest that the β-annulus plays a role in the vector transmission process by holding the β-annulus together. It is important that the swollen, wild-type particles are very poorly transmitted by the zoospore (data not shown). This supports the contention that stability is an important aspect of vector transmission.
MATERIALS AND METHODS
Virus production and purification.
CNV was produced and purified essentially as previously described, with some modifications (14). CNV was propagated in Nicotiana benthamiana plants that were at the 5- to 7-true-leaf stage. The inoculum contained ∼50 ng/μl virus in 50 mM KPO4, pH 6.8, and 20 μl of this solution was rubbed onto leaves that had been dusted with carborundum. The infection was allowed to proceed for 5 to 7 days, and leaves were harvested when the plants had completely wilted. The infected leaf material was stored at −80°C until processing.
Frozen leaf material (∼200 g) was ground in a chilled blender until fully homogenized in 1 to 2 volumes of ice-cold 0.1 M sodium acetate, pH 5.0, containing 10 mM β-mercaptoethanol. The material was allowed to rest in ice for 20 to 30 min, and the plant debris was removed by centrifugation at 5,000 × g for 30 min at 4°C. The supernatant was then filtered through one layer of Miracloth. The filtrate was clarified by centrifugation again at 5,000 × g for 30 min at 4°C. To the supernatant, polyethylene glycol (PEG; molecular weight [MW], 8,000) was added to yield a final concentration of 8% (wt/vol) and stirred for 2 h at 4°C. The precipitate was collected by centrifugation at 8,000 × g for 20 min at 4°C and resuspended in less than 60 ml of 10 mM sodium acetate, pH 5.0. This suspension was kept at 4°C overnight to ensure that the precipitate was fully resuspended.
The next day the debris was removed from the suspension by centrifugation at 8,000 × g for 20 min at 4°C. CsCl was added to the supernatant to yield a 2.4 M solution. The solution was then centrifuged in an SW41 rotor at 36,000 rpm for 36 to 48 h. The virus band, which appeared in the lower third of the SW41 tube, was collected via a side puncture with a syringe and hypodermic needle. The pooled bands were then dialyzed extensively for several days against 20 mM sodium acetate, pH 5.0. Allowing at least 8 h per dialysis, the virus was first dialyzed three times in the acetate buffer in the presence of 20 mM calcium chloride and then an additional three times without the calcium added. The concentration of CNV was estimated assuming that a 1 mg/ml solution has an optical density of 4.5 at 260 nm. The typical yield was ∼30 mg of pure virus from 12 plants. Purity of the virus was determined via SDS-PAGE, but the sample was first brought to a pH between 7 and 8 prior to boiling in SDS running buffer since the capsid protein undergoes autolysis at acidic pHs at high temperature in the presence of SDS. For the P73G mutant, some of the purified virus was used for reverse transcription-PCR (RT-PCR) sequencing to confirm the retention of the mutation.
Particle stability in urea.
To better ascertain possible stability differences between wild-type CNV and the P73G mutant, both types of virions were exposed to increasing concentrations of urea under swelling conditions and examined with agarose gel electrophoresis. The swelling buffer consisted of 50 mM sodium phosphate, pH 7.6, that contained 25 mM EDTA to chelate the divalent metals in the capsid. Each reaction mixture consisted of 10 μl of swelling buffer plus 0.5 μl of CNV that was at a concentration of ∼50 mg/ml. After incubation at room temperature for 1 h, the samples were electrophoresed through a 1% agarose gel made using 0.5× Tris-borate (TB) buffer, without EDTA, at pH 8.3. Electrophoresis was performed for 1 h at 4°C at 100 V. The viral RNA was visualized using ethidium bromide (0.04%, wt/vol) in the gel.
Cryo-EM data collection on wild-type CNV.
Data collection on the wild-type CNV under native and swelling conditions was performed at the National Resource for Macromolecular Microscopy (NRAMM). Data were acquired using a Tecnai F20 Twin transmission electron microscope operating at 120 kV, using a dose of ∼12 e−/Å2 and a nominal underfocus ranging from 1.4 to 2.5 μm. Images were automatically collected at a nominal magnification of ×62,000 at a pixel size of 1.32 Å at the specimen level. All images were recorded with a Tietz F415 4,000- by 4,000-pixel charge-coupled-device (CCD) camera (15-μm pixel) utilizing the Leginon data collection software (15). Experimental data were processed by the Appion software package (16), which interfaces with the Leginon database infrastructure. The contrast transfer function (CTF) for each micrograph was estimated using the ACE package (17). Particles were automatically selected from the micrographs using a template-based particle picker (18) and extracted at a box size of pixels. The final stacks contained 37,970 and 16,253 particles for the native and swollen particles, respectively. The three-dimensional (3D) reconstruction was carried out using the EMAN reconstruction package (19). Resolution was assessed by calculating the Fourier shell correlation (FSC) at a threshold of 0.5, which provided values of 5.8-Å and 9.9-Å resolution for the native and swollen reconstructions, respectively. Using the program ResMap (9), the mean resolutions were estimated to be 2.7 Å and 5.9 Å for the native and swollen reconstructions, respectively, but these values are too generous as estimates of the resulting maps.
Cryo-EM data collection on the P73G mutant.
Data on the P73G mutant were collected at the Sealy Center for Structural Biology and Molecular Biophysics at the University of Texas Medical Branch (UTMB). Purified CNV P73G was vitrified as previously described (20) on carbon holey film (R2x2 Quantifoil [Micro Tools GmbH, Jena, Germany] or C-flat [Protochips, Raleigh, NC]) grids. Briefly, purified concentrated (∼1 mg/ml) suspensions of virions were applied to the holey films, blotted with filter paper, and plunged into liquid ethane. Frozen grids were stored under liquid nitrogen until used for microscopy. They were transferred to a cryo-specimen holder (Gatan 626) under liquid nitrogen and put in a microscope (JEOL 2200FS) equipped with an in-column energy filter (omega type) and field emission gun (FEG) operating at 200 keV. Grids were maintained at close to liquid nitrogen temperatures during EM sessions (−172 to −180°C). CNV virions were imaged at a magnification of either ×60,000 or ×40,000 using a DE-20 direct electron detector (Direct Electron, LP, San Diego, CA, USA) in movie mode under low-dose conditions. An in-column omega electron energy filter was used during imaging with zero-loss energy peak selected with a 20-eV slit. Images were acquired with an approximately 37 e−/Å2 dose; DE-20 pixel size corresponded to ∼1 Å (at ×60,000) on the specimen scale. Defocus values of 0.88 to 2.55 μm were used for imaging.
Individual frames in each image were aligned using DE_process_frames.py script provided by Direct Electron (Direct Electron, LP, San Diego, CA, USA) using radiation damage compensation (progressively increasing low-pass filtering of later frames in the series) to increase low-frequency content in the final images, thus facilitating subsequent particle alignment. Frames were aligned either as a whole or as individual patches containing boxed particles.
Individual virion images were boxed from the images using the E2BOXER program from the EMAN2 suite (19). EMAN2 was used for CTF determination and correction; the subsequent processing (particle alignment, orientation determination, and refinement) was done in IMAGIC-5 (21) followed by processing with the JSPR program (22).
An ab initio model of the virus was obtained using the angular reconstitution technique (23). Several refinement cycles, including origin/orientation and refinement/correction of elliptic distortion, were performed leading to a stable 3D map of the CNV P73G virions (24). The final 3D map was reconstructed from the 49,525 virion images. Effective resolution of the map was 4.48 Å with an FSC cutoff of 0.5 and 4.2 Å with an FSC cutoff of 0.143 using the gold-standard protocol (25). The program ResMap (9) estimated the resolution to be 2.9 Å, which was judged to be an overestimate based on the map quality.
Building CNV models using the cryo-EM density.
The model for the swollen CNV structure was built using the crystal structure of CNV (5). The full CNV icosahedron was divided into three separate files containing the A, B, and C subunits. Using the collage option in the Situs (10) program, 60 copies of the subunits were fitted into the electron density. While the general fit of the subunits was reasonable, it was evident that the P and S domains needed independent fitting. To this end, all 60 of the A, B, and C subunits were divided into P and S domains and fit into their respective densities using the program Chimera (26). The only area that did not fit well into the EM density was at the quasi-6-fold axes (icosahedral 3-fold axes): as the models for the S domains of the C subunit are spread apart as rigid bodies to fit into the swollen density, the N termini no longer form the tight β-annulus. However, the density of the annulus clearly showed that it remained intact during swelling. While the resolution was not sufficient to build a model for the region, it was clear that the wild-type β-annulus structure fit extremely well in the cryo-EM density without any modification.
Accession number(s).
The wild-type, wild-type swollen, and P73G cryo-EM maps have been deposited in the Worldwide Protein Data Bank (wwPDB) under accession numbers EMD-8825, EMD-8824, and EMD-8818, respectively.
ACKNOWLEDGMENTS
The work presented here on the wild-type CNV cryo-EM structure was conducted at the National Resource for Automated Molecular Microscopy (NRAMM), which is supported by the National Institutes of Health through the National Center for Research Resources' P41 program (RR17573). This work was supported by UTMB startup funds to T.J.S.
We express our sincere gratitude to all of the staff of NRAMM for their help and support in preparing the samples and collecting the images. Data on the P73G mutant was collected at the EM facility within the Sealy Center for Structural Biology and Molecular Biophysics.
REFERENCES
- 1.Rochon D, Kakani K, Robbins M, Reade R. 2004. Molecular aspects of plant virus transmission by olpidium and plasmodiophorid vectors. Annu Rev Phytopathol 42:211–241. doi: 10.1146/annurev.phyto.42.040803.140317. [DOI] [PubMed] [Google Scholar]
- 2.Rochon DM, Tremaine JH. 1989. Complete nucleotide sequence of the cucumber necrosis virus genome. Virology 169:251–259. doi: 10.1016/0042-6822(89)90150-5. [DOI] [PubMed] [Google Scholar]
- 3.Campbell RN. 1996. Fungal transmission of plant viruses. Annu Rev Phytopathol 34:87–108. doi: 10.1146/annurev.phyto.34.1.87. [DOI] [PubMed] [Google Scholar]
- 4.Dias HF. 1970. The relationship between cucumber necrosis virus by Olpidium cucurbitacearum. Virology 40:828–839. doi: 10.1016/0042-6822(70)90128-5. [DOI] [PubMed] [Google Scholar]
- 5.Li M, Kakani K, Katpally U, Johnson S, Rochon D, Smith TJ. 2013. Atomic structure of cucumber necrosis virus and the role of the capsid in vector transmission. J Virol 87:12166–12175. doi: 10.1128/JVI.01965-13. [DOI] [PMC free article] [PubMed] [Google Scholar]
- 6.Harrison SC, Olson AJ, Schutt CE, Winkler FK, Bricogne G. 1978. Tomato bushy stunt virus at 2.9Å resolution. Nature 276:368–373. doi: 10.1038/276368a0. [DOI] [PubMed] [Google Scholar]
- 7.Kakani K, Reade R, Rochon D. 2004. Evidence that vector transmission of a plant virus requires conformational change in virus particles. J Mol Biol 338:507–517. doi: 10.1016/j.jmb.2004.03.008. [DOI] [PubMed] [Google Scholar]
- 8.Kakani K, Robbins M, Rochon D. 2003. Evidence that binding of cucumber necrosis virus to vector zoospores involves recognition of oligosaccharides. J Virol 77:3922–3928. doi: 10.1128/JVI.77.7.3922-3928.2003. [DOI] [PMC free article] [PubMed] [Google Scholar]
- 9.Kucukelbir A, Sigworth FJ, Tagare HD. 2014. Quantifying the local resolution of cryo-EM density maps. Nat Methods 11:63–65. doi: 10.1038/nmeth.2727. [DOI] [PMC free article] [PubMed] [Google Scholar]
- 10.Wriggers W. 2010. Using Situs for the integration of multi-resolution structures. Biophys Rev 2:21–27. doi: 10.1007/s12551-009-0026-3. [DOI] [PMC free article] [PubMed] [Google Scholar]
- 11.Pettersen EF, Goddard TD, Huang CC, Couch GS, Greenblatt DM, Meng E, Ferrin TE. 2004. UCSF Chimera—a visualization system for exploratory research and analysis. J Comput Chem 25:1605–1612. doi: 10.1002/jcc.20084. [DOI] [PubMed] [Google Scholar]
- 12.Robinson IK, Harrison SC. 1982. Structure of the expanded state of tomato busy stunt virus. Nature 297:563–568. doi: 10.1038/297563a0. [DOI] [Google Scholar]
- 13.Ng J, Liu S, Perry KL. 2000. Cucumber mosaic virus mutants with altered physical properties and defective in aphid transmission. Virology 276:395–403. doi: 10.1006/viro.2000.0569. [DOI] [PubMed] [Google Scholar]
- 14.Katpally U, Kakani K, Reade R, Rochon D, Smith TJ. 2007. Structures of T=1 and T=3 Cucumber necrosis virus particles: evidence of internal scaffolding. J Mol Biol 365:502–512. doi: 10.1016/j.jmb.2006.09.060. [DOI] [PubMed] [Google Scholar]
- 15.Suloway C, Pulokas J, Fellmann D, Cheng A, Guerra F, Quispe J, Stagg S, Potter CS, Carragher B. 2005. Automated molecular microscopy: the new Leginon system. J Struct Biol 151:41–60. doi: 10.1016/j.jsb.2005.03.010. [DOI] [PubMed] [Google Scholar]
- 16.Lander GC, Stagg SM, Voss NR, Cheng A, Fellmann D, Pulokas J, Yoshioka C, Irving C, Mulder A, Lau PW, Lyumkis D, Potter CS, Carragher B. 2009. Appion: an integrated, database-driven pipeline to facilitate EM image processing. J Struct Biol 166:95–102. doi: 10.1016/j.jsb.2009.01.002. [DOI] [PMC free article] [PubMed] [Google Scholar]
- 17.Mallick SP, Carragher B, Potter CS, Kriegman DJ. 2005. ACE: automated CTF estimation. Ultramicroscopy 104:8–29. doi: 10.1016/j.ultramic.2005.02.004. [DOI] [PubMed] [Google Scholar]
- 18.Roseman AM. 2003. Particle finding in electron micrographs using a fast local correlation algorithm. Ultramicroscopy 94:225–236. doi: 10.1016/S0304-3991(02)00333-9. [DOI] [PubMed] [Google Scholar]
- 19.Ludtke SJ, Baldwin PR, Chiu W. 1999. EMAN: semiautomated software for high-resolution single-particle reconstructions. J Struct Biol 128:82–97. doi: 10.1006/jsbi.1999.4174. [DOI] [PubMed] [Google Scholar]
- 20.Sherman MB, Guenther RH, Tama F, Sit TL, Brooks CL, Mikhailov AM, Orlova EV, Baker TS, Lommel SA. 2006. Removal of divalent cations induces structural transitions in red clover necrotic mosaic virus revealing a potential mechanism for RNA release. J Virol 80:10395–10406. doi: 10.1128/JVI.01137-06. [DOI] [PMC free article] [PubMed] [Google Scholar]
- 21.van Heel M, Harauz G, Orlova EV. 1996. A new generation of the IMAGIC image processing system. J Struct Biol 116:17–24. doi: 10.1006/jsbi.1996.0004. [DOI] [PubMed] [Google Scholar]
- 22.Guo F, Jiang W. 2014. Single particle cryo-electron microscopy and 3-D reconstruction of viruses. Methods Mol Biol 1117:401–443. doi: 10.1007/978-1-62703-776-1_19. [DOI] [PMC free article] [PubMed] [Google Scholar]
- 23.Van Heel M. 1987. Angular reconstitution: a posteriori assignment of projection directions for 3D reconstruction. Ultramicroscopy 21:111–124. doi: 10.1016/0304-3991(87)90078-7. [DOI] [PubMed] [Google Scholar]
- 24.Yu G, Li K, Liu Y, Chen Z, Wang Z, Yan R, Klose T, Tang L, Jiang W. 2016. An algorithm for estimation and correction of anisotropic magnification distortion of cryo-EM images without need of pre-calibration. J Struct Biol 195:207–215. doi: 10.1016/j.jsb.2016.06.003. [DOI] [PMC free article] [PubMed] [Google Scholar]
- 25.Scheres SH, Chen S. 2012. Prevention of overfitting in cryo-EM structure determination. Nat Methods 9:853–854. doi: 10.1038/nmeth.2115. [DOI] [PMC free article] [PubMed] [Google Scholar]
- 26.Goddard TD, Huang CC, Ferrin TE. 2007. Visualizing density maps with UCSF Chimera. J Struct Biol 157:281–287. doi: 10.1016/j.jsb.2006.06.010. [DOI] [PubMed] [Google Scholar]


