

Abstract
Objective
To understand the adaptation to lactation of obese rats, by studying the interplay among the gut hormone cholecystokinin (CCK), the adiposity hormone leptin and the affiliation hormone oxytocin in modulating body mass and fat storage.
Design
Strain differences were examined between Otsuka Long Evans Tokushima Fatty (OLETF) rats lacking expression of functional CCK-1 receptors and Long Evans Tokushima Otsuka (LETO) controls, tested as nulliparous dams, at the 7 and 15th lactation day, at weaning (lactation day 22) or 8 weeks postweaning.
Measurements
We measured body mass, fat pads (brown, retroperitoneal and inguinal) and inguinal adipocytes. Plasma levels of leptin and oxytocin were determined.
Results
Fat depots of LETO female rats were larger during lactation compared to the levels found in postweaning and nulliparous female rats. LETO female rats gained weight and accumulated fat during pregnancy and lactation, returning to their normal fat levels postweaning. In contrast, OLETF female rats presented lower body weight and fat depots during the lactation period than nulliparous dams, and regained the weight and fat postweaning. Plasma leptin and oxytocin were highly correlated and followed the same pattern. OLETF leptin levels were highly correlated with fat depot and inguinal cell surface. No significant correlation was found for LETO parameters.
Conclusions
Pregnancy and lactation are energy-consuming events, which naturally induce female rats to increase food intake and accumulate fat. When challenged by the demands of rapidly growing preobese OLETF pups, OLETF dams’ fat stores are reduced to lean, LETO levels. During lactation, sensitivity of the oxytocinergic neurons descending from the paraventricular nuclei to the nucleus of the solitary tract to CCK is reduced. We theorized that this pathway is not available to OLETF female rats that lack functional CCK-1 receptors to mediate the signal. The current study contributes to the understanding of the female body’s adaptation to lactation.
Keywords: adipose tissues, hypertrophy, weight gain, female rats
Introduction
To nourish and raise offspring, the female rat body adapts to the special demands of lactation. Thus during this period, considerable changes occur in the female rat body, food consumption increases two to three times relative to nonlactating controls and body weight increases in rats.1 We do not have a full understanding of the mechanisms underlying these increases in normal weight and certainly not in overweight female rats.
Energy intake is under the control of both short- and long-term signals, among them cholecystokinin (CCK) and leptin, respectively.2 CCK inhibits food intake by reducing meal size, an effect mediated by the CCK-1 receptor. Plasma leptin levels are positively correlated with the amount of white adipose tissue, and they regulate the activity of neuropeptides in hypothalamic nuclei. In mammals, oxytocin (OT), in addition to modulating social and bonding behaviors, is involved in reproduction and care of offspring, and has both anabolic and catabolic effects. Both peripherally and centrally administrated OT induce a dose-related reduction in feeding.3 Systematic administration of CCK inhibits gastric motility, reduces food intake and stimulates pituitary secretion of OT in rats. OT fibers and endings have been described in various brain areas, including the dorsal medial hypothalamus (DMH), nucleus of the solitary tract (NTS) and the dorsal motor nucleus of the vagus nerve. In rats, populations of low- and high-affinity OT receptors have been described in the brain and in adipocytes.3–5 Within the hypothalamus, the neurons that undergo the most dramatic changes during pregnancy and lactation are the magnocellular neurons of the supraoptic nucleus (SON) and paraventricular nuclei (PVN), where OT is produced.6 Peripheral levels of OT are about a tenth of cerebrospinal fluid levels.7
Hyperphagia in lactating female rats is associated with decreased sensitivity to the satiety effects of CCK,1 and with reduced blood leptin levels relative to nonlactating rats.8–11 Although the hypoleptinemia should facilitate the hyperphagia of lactation, other orexigenic signals must also be involved.12,13 During lactation, the amount of hypothalamic neuropeptide Y (NPY) increases8 mainly in the DMH.14
In Western society, the incidences of overweight and obesity are increasing. Weight gain during pregnancy and lactation has many implications for women’s and children’s health, including risks related to adult obesity.15 Compared to normal-weight women, overweight and obese women retain more of the body weight gained during pregnancy and postpartum, when examined in the second year after giving birth.16 Stein and co-workers17 suggest that a high leptin concentration postpartum may predict an increased risk of overweight and obesity in vulnerable women. Thus, it is very important to understand weight regulation mechanisms during lactation and postweaning (PW). To elucidate the contribution of CCK, leptin and OT to adaptation to lactation, we used genetically obese Otsuka Long Evans Tokushima Fatty (OLETF) rats, lacking expression of functional CCK-1 receptors.18,19
In the absence of functional peripheral short-term CCK satiety signaling, male OLETF rats eat large meals, accumulate larger fat pads and become obese. Meal size of OLETF male rats is double than that of Long Evans Tokushima Otsuka (LETO) controls, although meal number decreases, but not to a sufficient degree to prevent overweight.19 OLETF male rats fail to compensate for fat calories.20 Leptin acts at the level of the hypothalamus to decrease the synthesis and secretion of NPY and agouti-related peptide (AGRP)8 and decreases the synthesis of the prepropeptide pre-opiomelanocortin (POMC). OLETF rats do not appear to have a primary deficit involving arcuate nucleus NPY or POMC signaling but rather a primary deficit in DMH hypothalamic NPY signaling, with upregulated levels of DMH NPY that may contribute to their hyperphagia and obesity.21–23
OLETF rats were chosen for this study for several reasons, beyond their CCK-1 receptor mutation (that allows the examination of CCK-1 mediation of adaptation to lactation). The first arises from our prior experience with this model. We have characterized numerous aspects of their hyperphagia and obesity and many aspects of their development.24 Although, the absence of CCK-1 receptor signaling is certainly not common in human obesity, there has been a single case report demonstrating obesity in an individual with such a defect,25 the OLETF rat does share many features found in human obesity. The OLETF rat does not have a primary deficit in leptin signaling. Like most human obese individuals, the OLETF rat develops leptin resistance as it becomes obese. The OLETF rat is susceptible to diet-induced obesity (DIO). Access to a high-fat (HF) diet enhances their obesity and they have been demonstrated to have increased relative preferences for palatable diets. Unlike many rodent obesity models, the OLETF rat develops type 2 diabetes, as it becomes obese, making it a particularly relevant model. Finally, the OLETF rat has a deficit in DMH NPY signaling. Deficits in DMH NPY signaling have been noted in a number of other rodent obesity models including the lethal agouti yellow, melanocortin 4 receptor knockout,26 tubby,27 diet-induced obese28 and brown adipose tissue (BAT)-deficient obese mice.29 Although the specific deficit that initiates the cascade for obesity development is specific to the OLETF rat, the manifestations of that deficit that result in obesity are very similar to those found both in other rodent models and in human obesity.
Very little research has been conducted on adult OLETF female rats, beyond the issue of their resistance to diabetes, first reported by Kawano.30 Watanobe demonstrated that the abnormalities in luteinizing hormone and prolactin surge due to hyperleptinemia were restored after 3 days of starvation.25 In the current research, we investigated the influence of lactation on fat accumulation, leptin and OT, in OLETF and LETO female rats. The results show different patterns of adaptation to the energetic demands of lactation in OLETF vs LETO dams.
Methods
Animals
Nulliparous (NP) and multiparous pregnant OLETF and LETO rats from three different shipments from the Tokushima Institute (Otsuka, Japan) were used in these experiments. They were housed in the colony of the Developmental Psychobiology Laboratory at Bar-Ilan University, Ramat-Gan, Israel. Pregnant OLETF and LETO female rats were housed individually in clean polycarbonate cages (18.5cm height × 26.5cm width × 43cm length) with stainless steel wire lids and wood shavings as bedding material. Food and water were freely available. The animals were on a 14:10 h light:dark cycle, with lights on at 0500 hours. Room temperature was maintained at 22±2 °C. Dams were checked daily for parturition. Newborn litters found until 1200 hours each day were designated as born on that day (Lac0). On Lac1–2, litters were culled to 10 pups (minimum 6), with sex distribution kept as equal as possible for each litter. The NP group studied in this paper consisted of NP rats that arrived in the shipments and did not give birth, with the addition of some female rats raised from the offspring of the litters born from the pregnant rats.
Female rats were investigated in one of the following states: (1) NP controls, (2) at the 7th day of lactation (Lac7), (3) at the 15–16th day of lactation (Lac15), (4) on weaning day, that is, 22nd or 23rd days lactation (Lac22) and (5) 7–8 weeks PW. These time points were chosen because of the duration of pregnancy and nursing. Female rats nurse their pups for 3 weeks, so we sampled at the end of each week. Rat gestation lasts for 21–23 days, so that altogether pregnancy and nursing take place over about 7 weeks. We chose to give animals the same period to recover; therefore, we took measurements from additional female rats 7–8 weeks PW. Postpartum body weight was assessed for comparison purposes on Lac1 (Table 1).
Table 1.
Mean body weight of the groups of female rats studied
| Phase | LETO | OLETF | ||||
|---|---|---|---|---|---|---|
|
|
|
|||||
| Weight (g) | Significant comparisons | N | Weight (g) | Significant comparisons | n | |
| NP | 262.3+4.4 | B | 13 | 369.1+8.3 | * | 7 |
| Lac1 | 248.3+13.4 | 7 | 345.7+12.0 | * | 8 | |
| Lac7 | 274.2+11.2 | 5 | 359.8+11.2 | * | 8 | |
| Lac15 | 303.7+11.6 | A | 7 | 331.4+9.2 | A, B | 6 |
| WD | 292.4+2.8 | A | 10 | 330.0+9.6 | A, B,* | 7 |
| PW | 290.4+7.4 | A | 8 | 377.7+23.9 | * | 8 |
Abbreviations: Lac, lactating; LETO, Long Evans Tokushima Otsuka; NP, nulliparous; OLETF, Otsuka Long Evans Tokushima fatty rats; PW, postweaning. Note: Lac1 data represent postpartum weight. The animals were not killed at this time. A, significantly different from NP group, within strain; B, significantly different from PW group, within strain;
significant OLETF–LETO difference at this phase.
We attempted to study animals in the different groups that were as similar as possible. Unfortunately some features could not be kept standard, such as weight and age, as the data from female rats were collected during different reproductive states. We also tried to collect data from animals that underwent parturition at the same age. Even so, our PW female rats were older than the lactating dams. We chose female rats that gave birth at the youngest ages for this group to minimize age differences. NP female rats with a wide range of ages were also collected, to serve as appropriate-aged controls for the lactating and PW groups. Despite their diverse ages, the NP groups’ weight turned out to be relatively similar (within-strain), and lower than that of the PW female rats. Thus, parturition and lactation altered the weight of animals. We collected data only from those female rats who raised their pups appropriately, as determined by daily observations, and from those whose pups’ weight gain was as expected for their strain. NP and PW rats were kept in a cage with other adult female rats. All applicable institutional and governmental regulations concerning the ethical use of animals were followed during this research. The study protocol was approved by the Institutional Animal Care and Use Committee according to the National Institutes of Health guide for the care and use of Laboratory animals.
Tissue collections
Rats were weighed and killed between 1100 and 1400 hours. Inguinal white fat tissue (I-WAT), interscapular BAT and retroperitoneal WAT (R-WAT) were collected from decapitated animals, weighed, placed in plastic tubes and frozen on dry ice. Samples were preserved at −80 °C until analyzed.
Trunk blood was collected in two chilled vacutainer tubes coated with EDTA. Tubes for OT assays, in addition, contained 150 μl of Trasylol (aprotinin) 500 000 KIU (Bayer, Germany). Samples were kept ice-chilled for up to 1 h before being centrifuged at 4 °C at 1500 g for 15 min. Supernatants were collected and stored at −80 °C until assayed.
Hormones: sampling and assay
General
We determined the plasma blood levels of leptin and OT, using 96 plate commercial ELISA kits (R&D Systems, Minneapolis, MN, USA). Measurements were performed in duplicate. The concentration of samples was calculated according to the relevant standard curve. For each plate a separate standard curve was constructed.
Oxytocin
We have recently described plasma OT determination in human blood, using the same procedure.31 Briefly, samples were diluted 1:5 in the assay buffer and treated according to the instructions of the commercial kit. At the final step, the optical density of the samples and standards was measured in wavelengths of 405 and then 590 for corrections. Concentrations of OT were calculated using MatLab-6 according to the semilogarithmic curve standard, having the range of 3.9–1000 pg ml−1. We note that the range of OT levels that was measured in the current study is according to the levels observed for Sprague–Dawely rats, measured by enzyme-linked immunoassay.32
Leptin
Samples were diluted 1:11 in the assay buffer and treated according to the instructions of the commercial kit. At the final step, the optical density of the samples and standards was measured in wavelengths of 450 and then 570 for corrections. The concentration of leptin was calculated according to the logarithmic curve, with the range of 62.5–4000 pg ml−1.
Hypertrophy of adipocytes
The weight of fat tissue changed tremendously over the reproductive phases. Therefore, we were interested to learn about the characteristics of fat cells at the different time points. A unique feature of adipocytes is their capability to vary greatly in size depending upon stage of development, nutrient availability and physical activity level. In adult rats, total adipocyte cell number cannot be decreased.33–34 However, an increase can be observed in genetically obese adult animals, in response to various manipulations.33 The inguinal fat pad is distinct from other fat depot types, as both adipocyte cell size and number can be affected by food consumption and reproductive status.33 For this reason we further investigated the size of inguinal adipocytes.
Histology
Samples of I-WAT were used for characterizing the adipocytes’ cell-calculated surface. Tissues were sectioned to 8 μm by cryostat (Lyca), at −35 °C, mounted on glass slides and digital photographs (Nikon) were taken through the microscope (Nikon) using the ACT1 program (at −200 magnification). For each inguinal fat pad examined, between 6 and 16 representative pictures were taken at minimal distance intervals of 30 μm. Adipocyte size parameters were derived from two to four representative cells from each picture, depending on the cell size, using the public domain National Institutes of Health Scion image program. From each animal at least 24 cells were analyzed. The criteria for representative cells were: (1) no granulation was visible in its surrounding membrane and (2) the membrane was smooth. A similar methodological approach was described elsewhere. 35,36 The adipocyte’s surface area was calculated from the size parameters according to the ellipsoid surface equation.
Data presentation and analysis
Statistical comparisons between strains were performed by two-way analysis of variance (ANOVA), with strain as one factor and reproductive stage group as the other, on each fat depot and hormone separately. Significant interactions were followed-up by one-way ANOVA comparing reproductive states, separately in each strain, followed by post-hoc Duncan’s test. Student’s t-tests further allowed for comparison between strains at particular reproductive states, to complete the interpretation of significant interactions. For group comparisons on adipocyte area, where the N was smaller, a nonparametric approach was chosen: Kruskal– Wallis tests, followed by post-hoc Mann–Whitney tests for pairwise comparisons. Finally, Pearson’s correlation coefficients were determined between the measures.
Results
Body weight
In addition to a significant strain effect (F(1,66)=135.13; P<0.001), in which OLETF female rats were heavier than LETO controls, overall ANOVA showed a significant strain × reproductive stage interaction (F(4,66)=7.47; P<0.001), but no overall reproductive stage effects. As shown in Table 1, the OLETF dams were significantly heavier than controls in all reproductive states examined (P<0.001), with the exception of Lac15 (P<0.1).
LETO
One-way ANOVA showed significant differences in body weight across reproductive stage (F(4,37)=6.32, P<0.001). Post-hoc Duncan’s test (P<0.05) showed that the weight of the NP group was significantly lower than that of the Lac15, Lac22 and PW groups, and the Lac15 group weighed significantly more than the Lac7 and NP groups (Table 1).
OLETF
One-way ANOVA showed significant body-weight differences across reproductive stage (F(4,29)=3.37, P<0.05). Post-hoc Duncan’s test showed that body weight was significantly lower on lactating days 15 and 22, compared to both the NP and the PW groups; Lac7 rats did not differ from the other groups (Table 1).
Adipose tissues
Figure 1 shows data from three fat depots: inguinal, retroperitoneal and brown (BAT), in LETO and OLETF groups separately. Significant strain main effects were revealed for all pads, both on net weights and on the percentage of bodyweight measures (all six ANOVAs, P<0.001): overall, OLETF dams had heavier fat pads than LETO controls. In addition, the strain × reproductive phase group interactions were significant for all three pads, by both measures (in five ANOVAs, P<0.001, for percent BAT, P<0.01).
Figure 1.

Adipose fat tissues. Adipose tissues: inguinal WAT (I-WAT) (a, b), retroperitoneal WAT (R-WAT) (c, d) and brown adipose tissue ((BAT) (e, f) were collected and weighed from nulliparous (NP), lactating (Lac7, 15 and WD), and postweaning (PW) rats. The left panel presents the absolute average weight of the fat tissue (a, c and e). The right panel presents the percentage of this tissue from the body mass (b, d and f). Note the similarity of data patterns in the two sets of figures. White bars are Long Evans Tokushima Otsuka (LETO) and gray bars are Otsuka Long Evans Tokushima Fatty (OLETF). At each phase, 5–10 animals were tested and averaged; the error is represented as s.e.m. Analyses of Variance (ANOVAs) performed on the data showed, overall, that the lactating LETO groups had significantly more I-WAT (but not R-WAT and BAT) than the LETO nonlactating groups, whereas in the OLETF strain, the lactating groups had significantly less fat in all three tissues compared to the NP group, and on most comparisons also compared to the PW group. With some exceptions, fat tissue weight did not differ significantly among the lactating groups. OLETF–LETO comparisons: OLETF dams had significantly heavier fat pads and greater percent fat on all measures, in NP, PW and Lac7 dams (with a few exceptions). In contrast, on Lac15 and 22, the two strains did not differ on all measures (with one exception). For particular group comparisons, see ‘Results’. *, Significantly different from NP group, within-strain comparison and +, significantly different from PW group, within-strain comparison.
Stage of lactation significantly affected inguinal fat in LETO rats whether the data are expressed in absolute (F(4,31)=64.39, P<0.001) or relative terms (F(4,32)= 104.75, P<0.001). Post-hoc Duncan’s tests (P<0.05) showed that all lactating groups had weights and percent weights of inguinal fat tissues, which were significantly higher than those of the two nonlactating groups (NP and PW). PW rats had significantly lower percent weight of fat tissues compared to the NP group. Within the lactating groups, dams had greater percent fat levels during the first two postpartum weeks than the Lac22 group. There were no reproductive stage differences in net and percent of LETO retroperitoneal and BAT fat pads’ weight from total body weight, with one exception. BAT weight was significantly lower in Lac7 than in Lac22 and PW groups (F(4,32=2.69, P<0.05, Duncan’s test, P<0.05).
As can be seen in Figure 1, there were significant differences in all the fat tissues across the various stages of lactation in OLETF rats: Inguinal pad weight (F(4,26)=7.29, P<0.001); and as expressed as percent of the rat’s body weight (F(4,26)=4.16, P<0.01); Retroperitoneal pad weight (F(4,24)=27.49, P<0.001) and as percent of the rat’s body weight (F(4,24)=41.29, P<0.001); BAT tissue weight (F(4,25)=6.12, P<0.001) and as percent of the rat’s body weight (F(4,25)=5.26, P<0.01).
Post-hoc Duncan’s tests showed that all lactating OLETF groups had fat tissues (both net and as percentages) that were significantly lighter than those of the NP OLETF group (with one exception: for percent inguinal fat, Lac7 did not differ from NP) (Figure 1). Similarly, the Lac15 and Lac22 OLETF groups presented fat pads (both net and as percentages) that were significantly lighter than those of the PW OLETF group (with one exception: percent BAT: the Lac22 vs PW comparison). In contrast, Lac7 rats differed from PW rats only on the retroperitoneal fat (net and percentage), but not in the two other fat tissues. Within the lactating groups, the Lac15 group did not differ significantly from the Lac22 dams on any measure, whereas Lac7 rats presented heavier retroperitoneal fat (both net and percentage) than the Lac15 and 22 dams (the Lac7 vs 22 comparison was also significant on weight of inguinal fat).
OLETF-LETO comparisons on all six measures, at each reproductive state separately showed that OLETF dams had significantly heavier fat pads and greater percent fat on all measures, in nonlactating NP and PW rats (with one nonsignificant exception: percent BAT, P<0.1), and in Lac7 dams (with one exception: percent inguinal fat). In contrast, on Lac15 and 22, the two strains did not differ on these measures (with one exception: inguinal fat weight in Lac22 rats).
In summary, LETO female rats appeared to accumulate I-WAT during the first 2 weeks of lactation. From the 15th day, the amount of I-WAT was lower, and PW dams contained the same amount of I-WAT as found in NP rats (Figure 1). On the 7th day of lactation the female rats had 214% I-WAT compared to NP rats. On the 15th day of lactation I-WAT rose to 246% than that of NP and on weaning I-WAT was still 180% than that of NP. No significant difference was observed in R-WAT and BAT between LETO female rats regardless of status. OLETF female rats lost fat during the lactation period, from all the three examined tissues. In the middle of the lactation period and during the transition toward weaning (days 15–22), OLETF dams had reduced weight fat tissues that did not differ from those of LETO controls in the same lactation stage. In contrast, 8 weeks PW OLETF dams gained fats, appearing to re-achieve the same amount as observed in NP.
Hypertrophy of adipocytes
OLETF female rats presented significantly larger fat cell surface areas than those of LETO controls, (F(1,28)=34.24; P<0.001). In addition, there was a significant effect of reproduction stage (F(4,28)=6.36; P<0.001) and a strain × reproductive stage interaction (F(4,28)=13.04; P<0.001).
Figure 2 shows the average surface area of inguinal adipocytes, in square microns, in LETO and OLETF rats at the various reproductive stages. The size of inguinal adipocytes of OLETF female rats was significantly lower during the lactation period (Kruskal–Wallis test, χ2 (4)=13.95, P<0.01), with the smallest size on weaning day and an increase PW. Mann–Whitney tests showed that for OLETF rats the mean surface cell area did not differ between NP and PW groups; the surface cell area was significantly greater in these two groups than in all three lactating groups: Lact7, Lac15 and WD (all P<0.05). In contrast, the surface area of adipocytes of control LETO female rats did not differ throughout lactation or during PW period (Kruskal–Wallis test, χ2 (4)=8.014, P<0. 1). However, the surface area of adipocytes in the Lac15 LETO group was significantly greater than that of the LETO NP and PW groups (Mann–Whitney tests: both P<0.05).
Figure 2.
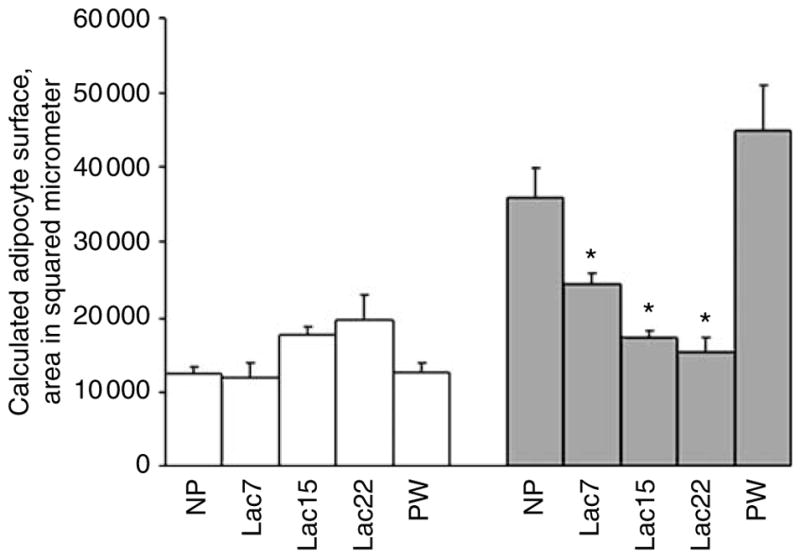
Calculated surface area of inguinal adipocytes. The mean surface area of inguinal adipocytes was determined as described in the Methods. The I-WAT was taken from nulliparous (NP), lactating (Lac7, 15 and WD) and postweaning (PW) rats. White bars are Long Evans Tokushima Otsuka (LETO) and gray bars are Otsuka Long Evans Tokushima Fatty (OLETF). At each phase 4–5 tissues were tested and averaged; the error is represented as s.e.m. Nonparametric analysis revealed no significant difference among LETO groups (with one exception: Lact15 vs the nonlactating groups), whereas the nonlactating OLETF groups had significantly less adipocyte area compared to lactating OLETF dams in all 3 weeks of lactation. Fat cell area did not differ significantly among the three lactating groups. *, P<0.05 compared to the nonlactating groups.
Hormones
In addition to a significant strain effect (F(1,36)=112.84; P<0.001), in which OLETF female rats presented significantly higher plasma leptin levels than LETO controls, ANOVA showed a significant strain × reproductive stage interaction (F(4,36)=28.77; P<0.001), and also an overall reproductive stage effect (F(4,36)=32.14; P<0.001). As shown in Figure 3, although the nonlactating OLETF dams had significantly higher leptin levels than lactating OLETF dams (one-way ANOVA, P<0.001, Post-hoc Duncan’s test), in the LETO strain there was no significant reproductive stage effect. Strain comparisons performed separately at each reproductive stage showed that leptin levels were significantly higher in OLETF vs LETO nonlactating rats. Strain differences were not significant in the lactating groups.
Figure 3.

Plasma levels of leptin and oxytocin. Plasma levels of leptin and oxytocin were determined as described in the Methods. Hormones of nulliparous (NP), lactating (Lac7,15 and 22) and postweaning (PW) rats were analyzed. White bars are Long Evans Tokushima Otsuka (LETO) and gray bars are Otsuka Long Evans Tokushima Fatty (OLETF). At each phase 4–6 dams were tested and averaged; the error is represented as s.e.m. Hormone levels did not differ between groups in the LETO strain. In the OLETF strain, leptin levels were significantly lower in lactating vs nonlactating OLETF groups and oxytocin (OT) levels were significantly lower in lactating OLETF vs the NP OLETF group (but the comparisons with the PW group were not significant). Leptin and OT levels within the three lactating OLETF groups did not significantly differ from each other (for particular group comparisons, see ‘Results’). *, P<0.05 compared to the nonlactating groups, for leptin, and compared to the NP group only, for OT.
For OT, ANOVA revealed a significant strain effect (F(1,36)=9.50; P<0.01), a significant effect of reproductive stage (F(4,36)=5.39; P<0.01) and a significant strain by reproductive stage interaction (F(4,36)=3.38; P<0.05). NP and postpartum OLETF dams had significantly elevated OT levels. These levels were significantly lower during lactation (one-way ANOVA, P<0.01, Post-hoc Duncan’s test). OT levels in LETO rats were not affected by lactation.
Glucose levels were similar in OLETF and LETO rats and did not change significantly over the reproductive stages (data not shown).
Correlations
Table 2 presents Pearson’s correlations between leptin or OT levels and measures of body weight and fat pads for OLETF and LETO dams, over the reproductive states. For OLETF rats, all the parameters displayed a similar trend; leptin and OT levels were positively correlated with body weight, adipocyte area and weight of fat tissues (normalized to body mass) (Table 2). For LETO rats, negative correlations were found between leptin and I-WAT area, body weight and weight of BAT, and between OT levels and R-WAT.
Table 2.
Correlations between hormones and other measures
| Correlates | Leptin | Oxytocin | ||
|---|---|---|---|---|
|
|
|
|||
| LETO | OLETF | LETO | OLETF | |
| Oxytocin | 0.60 | 0.90 | ||
| Cell Area | −0.89 | 0.99 | 30.38 | 0.83 |
| Weight | −0.82 | 0.91 | 30.40 | 0.84 |
| BAT | −0.81 | 0.94 | 30.21 | 0.97 |
| BAT, normalized | −0.45 | 0.90 | 0.08 | 0.98 |
| R-WAT | −0.19 | 0.97 | −0.89 | 0.95 |
| R-WAT, normalized | 0.47 | 0.97 | 30.37 | 0.96 |
| I-WAT | −0.32 | 0.92 | 30.43 | 0.93 |
| I-WAT, normalized | −0.20 | 0.90 | 30.42 | 0.94 |
Abbreviations: BAT, brown adipose tissue; I-WAT, white fat tissue; LETO, Long Evans Tokushima Otsuka; OLETF, Otsuka Long Evans Tokushima fatty; R-WAT, retroperitoneal WAT. Averaged values of each group were correlated (significant values, above r=0.8, are highlighted in bold).
Discussion
Lactating female rats increase food intake to maintain energy balance.1 During lactation, the hyperphagia and subsequent weight gain are dependent upon the presence of suckling pups.8,13 However, the underlying mechanisms controlling this process are unclear, especially for obese individuals. To better understand the process of body-weight regulation during lactation, we examined body weight, fat tissues and hormone levels in lactating, weaned and NP OLETF and LETO rats. The pattern of results suggests, together with the existing literature, that joint action of CCK, OT and leptin on hypothalamic brain areas and their descending control signals may underlie the weight gain characteristic of lactation. In addition, the results suggest that obese individuals may cope with the energetic demands of lactation differently than lean mothers.
We found that body weight of the control LETO strain gradually increased postpartum, reaching significance compared to NP rats at the end of the second week of lactation (Lac15). This weight difference was reflected in inguinal fat. In the PW period, inguinal fat depots decreased. R-WAT and BAT mass hardly changed during lactation. Furthermore, the morphology of the inguinal fat tissue was very different in nursing vs nonlactating female rats, as previously described.37 During lactation, the tissue was rich in blood capillaries and little milk vesicles (as observed when analyzing the fat cells). The texture was not uniform, with adipocytes cropped together in-between the blood capillaries and milk-containing structures. Since adipocyte size was not increased in the first lactation week, although fat tissue weight was greater, compared to NP LETO rats, we speculate that the difference in tissue weight between week-1 lactating and the nonlactating rats not only reflects differences in size of adipocytes, but also a greater variety (and probably number) of cells, including adipocytes and other lactationrelated cell types. In contrast, in the second and third lactation week, a hypertrophy process also occurred, with increased fat cell size accounting, at least partially, for the larger tissue weight.
In LETO rats, plasma leptin levels were negatively correlated with adipocyte size (Table 2). However, leptin levels during the lactating period were not significantly different from the levels found for NP and PW LETO dams. This is according to the previous reports,38,39 whereas others have reported hypoleptinemia during lactation.8,12,13 We note that leptin levels of OLETF and LETO NP dams in our present study were in the same range as that reported for 12 weeks postpartum dams.45 In women, serum leptin in the 36th week of pregnancy was significantly higher than 3 and 6 months postpartum. At those (later) time points, leptin was highly correlated with fat mass of the women, and was not influenced by lactation.40
In lactating OLETF rats, I-WAT mass and overall body weight were lower than in NP OLETF rats. In addition, the percentage of I-WAT fat utilization exceeded the percent reduction in body weight (as evident from the top panel of Figure 1 and Table 1). A similar reduction was observed for R-WAT. Lactating is an energy-draining process. It would appear that OLETF rats utilized not only their I-WAT store but also the R-WAT depot for the energetic demands of producing milk (and warmth) for the suckling pups. This may be at least partially a response to the demands of their pups. Examination of the body weights of the pups born to the dams in the current study shows that the OLETF pups were significantly heavier than same-age LETO pups at all lactating ages studied (data not shown), as previously reported.41,42
Adipocyte size, in OLETF dams, appeared to decrease as lactation progressed, according to the findings on I-WAT size. At 2 months after weaning, their fat mass and adipocyte size appeared to return to ‘expected’ obese levels, as observed in NP rats. Leptin levels were highly correlated with OLETF body weight, fat mass and adipocyte size (Table 2). In general, Bailey33 reported that I-WAT mass decreased as a function of both reduced size and number of fat cells, following exercise. Thus, this tissue appears to be an energy reservoir that responds to the body’s energetic needs, not only after exercise, but also in lactation.
It appears that OLETF dams exhibit a relatively negative energy balance, using their energy stores for nursing, with leptin levels decreasing accordingly. In fact, the energetic demand on OLETF dams is greater than that of LETO controls, because OLETF pups are heavier than same-age LETO pups from birth through weaning,41 OLETF dams nurse their pups for longer durations, and OLETF pups gain more weight from a nursing bout.43 Our data show that in the face of this energetic challenge, OLETF dams manage, nevertheless to achieve (lean) lactating LETO-levels of fat stores. This may be interpreted either as indicating a negative energy balance, or as adaptation at a lean-level set-point, just as is the case when OLETF male rats have the opportunity to exercise.44
In OLETF rats, BAT tissue weight and leptin levels were highly correlated; both were significantly lower than in nonlactating rats. The reduced BAT levels during lactation (Figure 1e) may be due to the dam’s negative energetic balance. Alternatively, OLETF rats may not reduce uncoupled proteins (UCPs) in this tissue (an energy-saving strategy characteristic of lactation).9
During lactation, hypothalamic NPY/AGRP increases.8,46 DMH NPY has been shown to be important in modulating lactation-associated hyperphagia.14 In male OLETF rats, NPY mRNA is overexpressed in the DMH, suggested a primary deficit in NPY signaling that may contribute to their hyperphagia and obesity.22 In response to long-term exercise, DMH NPY was overexpressed in LETO but not in OLETF male rats.44 After prolonged exercise, leptin levels, epidydimal fat and body mass of OLETF and LETO male rats were similar: the OLETF phenotype was ‘normalized’ to a more lean profile.44
Can we compare the energetic demands of lactation to those of exercise? The current results show that during the 3 weeks of lactation, LETO dams increased body weight and fat depots, whereas OLETF reduced weight, fat stores and leptin levels, the two strains reaching similar levels on Lac15. Adipocyte cell surface area is even smaller in OLETF than LETO rats on weaning day. Thus, OLETF become leaner in response to both exercise and lactation, whereas LETO controls presented opposite patterns: weight reduction following exercise and increase during lactation. In addition, after locking the running wheels for 6 weeks, OLETF male rats did not fully recover,44 whereas after 8 weeks PW OLETF female rats appear to be fully recovered in the present study. Thus, the energetic demands of lactation produce a different pattern of physiological adaptation. It appears that OLETF dams do not manage to meet the high energetic demands of nursing rapidly growing OLETF pups. They may not sufficiently compensate by increased feeding, and thus utilize their excessive fat stores in addition. Either their regulatory processes are inadequate, or they adapt to lactation as if their pups were ‘normal’ (LETO): their fat stores are at lean, LETO levels.
Denis et al.13 speculated that lactation-hyperphagia is accounted for by additional orexigenic factors, beyond the decrease in leptin levels. The current findings showed an accompanying decrease in plasma OT levels in the lactating OLETF dams. Leptin appears to regulate OT secretion through leptin receptors on the PVN and/or in the brainstem.47,48 Sensory information regarding suckling is transferred by afferent nerves from the nipple to the brainstem, and from there to various other brain regions, including the PVN, which mediate the effect of suckling on OT and prolactin secretion. This suckling stimulation could also transmit signals regulating food intake.13 It appears that this regulation may have failed in the case of the OLETF.
The remarkable morphological plasticity of OT neurons during the progression from pregnancy to lactation is relevant. The excitatory effect of OT neurons (in slices from SON) was maximal in lactating rats, intermediate in virgin and lowest in pregnant rats. Excitation by CCK was high in both lactating and virgin rats, and was minimal in the pregnant group.4
The PVN is the most likely candidate for mediating downstream leptin signaling because the anorectic peptides CRH and OT, expressed in this region, are known to project to CNS regions involved in regulation of meal size, and because PVN lesions induce hyperphagia.2 OT axons within the descending pathway from the PVN to the NTS are anatomically positioned to interact with NTS neurons that respond to vagally-mediated peripheral CCK signals such as those occur, following ingestion of meal.5 These findings support the hypothesis that OT exerts a tonic stimulatory effect on the response of key neurons within the NTS to CCK and further reduces meal size.5
PVN OT projections could either modulate the activity of intrinsic brain stem reflex arcs, or exert a direct control over vagal efferents that project to the gut and inhibit gastric motility. Regarding CCK, hyperphagia in lactating female rats was associated with decreased sensitivity to the satiety effect of IP CCK, similar to that in hyperphagic obese rats.1 Stimulation of gastric vagal afferents by systematic administration of CCK inhibited gastric motility, reduced food intake and stimulated pituitary secretion of OT in rats. Note that in lactating rats, OT secretion did not decrease gastric motility.3 Blevins et al.5 research supports a model in which oxytocinergic PVN neurons transmit descending input from the hypothalamus to NTS neurons involved in meal-related control of food intake. Later on Blevins et al.48 showed that release of OT from the descending parvocellular neurones of the PVN (pPVN) to NTS pathway contributes to leptin’s attenuation of food intake. This was explained by a mechanism that involves the activation of pPVN OT neurons by leptin, resulting in increased sensitivity of NTS neurons to satiety signal.
According to the literature reviewed above, it appears that lactation is characterized by increased hypothalamic NPY levels contributing to hyperphagia and weight gain, and decreased UCP BAT expression, reducing energetic expenditure. Another accompanying process, which is likely lacking in OLETF rats, is the decrease in sensitivity to CCK and OT of OT neurons from the PVN to the NTS. On the basis of our findings, we speculate that this last process is important in adaptation to lactation in ‘normal’ rats. It is relevant to note in this context that research in patients with anorexia or Prader–Willi syndrome suggests that OT is important in regulating ingestive behavior in the human hypothalamus.3
The OLETF pattern of adaptation to lactation may indeed be accounted for by the lack of functional CCK-1 receptors directly interfering with a relevant pathway, as speculated about in the previous paragraphs. However, an alternative possibility is that the OLETF’s obese phenotype, following life-long hyperphagia (a secondary result of the lack of CCK-1 receptors) can account for the differential adaptation pattern. One way to examine this is to see if a different, environmentally induced rat model of hyperphagia-induced obesity, without mutations in the CCK (or NPY) systems, shows a similar pattern. Bayol et al.49 provided rat dams with a ‘cafeteria diet’, which consisted of eight different types of palatable foods, together with their normal balanced chow from the first day of pregnancy. These dams exhibited hyperphagia and increased intake of foods rich in fat throughout pregnancy and lactation, compared to chowfed controls. At the end of gestation, these ‘junk food’-fed dams were 13% heavier than controls-fed chow alone. Nevertheless, both groups had similar body weights on the day of weaning (Lac21). The researchers suggest that the lack of body mass increase, despite consuming more energy, suggests that the mothers fed the ‘cafeteria diet’ during lactation may have invested more energy in milk production and therefore their milk may have been richer in energy and fat. In another study, Wistar rats were fed a mixture of chow, sucrose and sweetened condensed milk from the age of 10 weeks, mated on week 14 and switched back to standard chow at 2 days postpartum: although these dams weighed more than control dams during gestation, there was no longer a significant difference in body weight between them and chow-fed control dams by Lac7 and on throughout lactation.50 Levin and Govek51 fed high-energy (HE) diets to selected strains of rats susceptible to development of DIO or diet resistant, for a month, then throughout gestation and lactation. Comparison of dam body weight before mating and in the second lactation week (their Table 1) shows that although the chow-fed rats from both strains were heavier when lactating than before pregnancy, the HE-fed dams from both strains were not. Furthermore, within each strain there were no diet-induced effects on dam body weight on Lac15.51 In a similar study design, HE-fed DIO rats gained only half as much body weight than chow-fed DIO rats, when comparing premating and second lactation week data.52 In Wistar rats fed control or HF diet for weeks prior to mating: ‘during gestation, those fed the HF diet maintained their overweight compared with normally fed dams. After delivery, HF dams lost relatively more weight than did C dams, mainly during the second half of the lactation period, and then the body weight became identical in the two groups at the end of the weaning period’.53 Overall, these patterns of weight differences are very similar to those described in the current study, in which OLETF rats were much heavier than LETO controls as NP and on Lac1, although this difference dramatically decreased on Lac15 and 22 (Table 1). This similarity suggests that the pattern of OLETF adaptation to lactation may reflect their general hyperphagia-obesity phenotype, rather than, or possibly, in addition to, its specific CCK-1 mutant status.
Summary
In conclusion, the present study contributes to our understanding of body mass regulation during lactation and after weaning. It appears that the CCK-1 mutation (and related alterations, neurochemical, for example, in NPY levels, and physiological, for example, obesity) prevents the ability of the OLETF dam to compensate for the large energetic demands of nursing preobese OLETF pups. Instead she uses her ample body fat stores as a resource. This strategy appears to work well, as OLETF pups are heavier and more obese than LETO controls at weaning.
Acknowledgments
We thank Dr Kawano of the Otsuka Tokushima Research Institute for the generous gift of the OLETF and LETO rats. This work was supported by the US-Israel Binational Research Foundation (AWand THM).
A portion of this research was presented at the 13th Annual Meeting of the Society for the Study of Ingestive Behavior, Pittsburgh, PA, USA.
References
- 1.McLaughlin CL, Baile CA, Peikin SR. Hyperphagia during lactation: satiety response to CCK and growth of the pancreas. Am J Physiol. 1983;244:E61–E65. doi: 10.1152/ajpendo.1983.244.1.E61. [DOI] [PubMed] [Google Scholar]
- 2.Blevins JE, Schwartz MW, Baskin DG. Peptide signals regulating food intake and energy homeostasis. Can J Physiol Pharmacol. 2002;80:396–406. doi: 10.1139/y02-035. [DOI] [PubMed] [Google Scholar]
- 3.Gimpl G, Fahrenholz F. The oxytocin receptor system: structure, function, and regulation. Physiol Rev. 2001;81:629–683. doi: 10.1152/physrev.2001.81.2.629. [DOI] [PubMed] [Google Scholar]
- 4.Carter SJ, Richardson CM, Wakerley JB. Excitatory effects of oxytocin and cholecystokinin on oxytocin neurones: differences between virgin, pregnant and lactating rats. Neurosci Lett. 2003;351:13–16. doi: 10.1016/s0304-3940(03)00913-3. [DOI] [PubMed] [Google Scholar]
- 5.Blevins JE, Eakin TJ, Murphy JA, Schwartz MW, Baskin DG. Oxytocin innervation of caudal brainstem nuclei activated by cholecystokinin. Brain Res. 2003;993:30–41. doi: 10.1016/j.brainres.2003.08.036. [DOI] [PubMed] [Google Scholar]
- 6.Kokay IC, Bull PM, Davis RL, Ludwig M, Grattan DR. Expression of the long form of the prolactin receptor in magnocellular oxytocin neurons is associated with specific prolactin regulation of oxytocin neurons. Am J Physiol Regul Integr Comp Physiol. 2006;290:R1216–R1225. doi: 10.1152/ajpregu.00730.2005. [DOI] [PubMed] [Google Scholar]
- 7.Altemus M, Fong J, Yang R, Damast S, Luine V, Ferguson D. Changes in cerebrospinal fluid neurochemistry during pregnancy. Biol Psychiatry. 2004;56:386–392. doi: 10.1016/j.biopsych.2004.06.002. [DOI] [PubMed] [Google Scholar]
- 8.Brogan RS, Mitchell SE, Trayhurn P, Smith MS. Suppression of leptin during lactation: contribution of the suckling stimulus versus milk production. Endocrinology. 1999;140:2621–2627. doi: 10.1210/endo.140.6.6802. [DOI] [PubMed] [Google Scholar]
- 9.Xiao XQ, Grove KL, Grayson BE, Smith MS. Inhibition of uncoupling protein expression during lactation: role of leptin. Endocrinology. 2004;145:830–838. doi: 10.1210/en.2003-0836. [DOI] [PubMed] [Google Scholar]
- 10.Xiao XQ, Grove KL, Lau SY, McWeeney S, Smith MS. Deoxyribonucleic acid microarray analysis of gene expression pattern in the arcuate nucleus/ventromedial nucleus of hypothalamus during lactation. Endocrinology. 2005;146:4391–4398. doi: 10.1210/en.2005-0561. [DOI] [PubMed] [Google Scholar]
- 11.Woodside B, Abizaid A, Walker C. Changes in leptin levels during lactation: implications for lactational hyperphagia and anovulation. Horm Behav. 2000;37:353–365. doi: 10.1006/hbeh.2000.1598. [DOI] [PubMed] [Google Scholar]
- 12.Denis RG, Bing C, Naderali EK, Vernon RG, Williams G. Lactation modulates diurnal expression profiles of specific leptin receptor isoforms in the rat hypothalamus. J Endocrinol. 2003;178:225–232. doi: 10.1677/joe.0.1780225. [DOI] [PubMed] [Google Scholar]
- 13.Denis RG, Williams G, Vernon RG. Regulation of serum leptin and its role in the hyperphagia of lactation in the rat. J Endocrinol. 2003;176:193–203. doi: 10.1677/joe.0.1760193. [DOI] [PubMed] [Google Scholar]
- 14.Chen P, Williams SM, Grove KL, Smith MS. Melanocortin 4 receptor-mediated hyperphagia and activation of neuropeptide Y expression in the dorsomedial hypothalamus during lactation. J Neurosci. 2004;24:5091–5100. doi: 10.1523/JNEUROSCI.0588-04.2004. [DOI] [PMC free article] [PubMed] [Google Scholar]
- 15.Oken E, Taveras EM, Kleinman KP, Rich-Edwards JW, Gillman MW. Gestational weight gain and child adiposity at age 3 years. Am J Obstet Gynecol. 2007;196:322e1–e8. doi: 10.1016/j.ajog.2006.11.027. [DOI] [PMC free article] [PubMed] [Google Scholar]
- 16.Gunderson EP, Abrams B, Selvin S. Does the pattern of postpartum weight change differ according to pregravid body size? Int J Obes Relat Metab Disord. 2001;25:853–862. doi: 10.1038/sj.ijo.0801631. [DOI] [PubMed] [Google Scholar]
- 17.Stein TP, Scholl TO, Schluter MD, Schroeder CM. Plasma leptin influences gestational weight gain and postpartum weight retention. Am J Clin Nutr. 1998;68:1236–1240. doi: 10.1093/ajcn/68.6.1236. [DOI] [PubMed] [Google Scholar]
- 18.Takiguchi S, Takata Y, Funakoshi A, Miyasaka K, Kataoka K, Fujimura Y, et al. Disrupted cholecystokinin type-A receptor (CCKAR) gene in OLETF rats. Gene. 1997;197:169–175. doi: 10.1016/s0378-1119(97)00259-x. [DOI] [PubMed] [Google Scholar]
- 19.Moran TH, Katz LF, Plata-Salaman CR, Schwartz GJ. Disordered food intake and obesity in rats lacking cholecystokinin A receptors. Am J Physiol. 1998;274:R618–R625. doi: 10.1152/ajpregu.1998.274.3.R618. [DOI] [PubMed] [Google Scholar]
- 20.Schwartz GJ, Whitney A, Skoglund C, Castonguay TW, Moran TH. Decreased responsiveness to dietary fat in Otsuka Long-Evans Tokushima fatty rats lacking CCK-A receptors. Am J Physiol. 1999;277:R1144–R1151. doi: 10.1152/ajpregu.1999.277.4.R1144. [DOI] [PubMed] [Google Scholar]
- 21.Bi S, Scott KA, Kopin AS, Moran TH. Differential roles for cholecystokinin a receptors in energy balance in rats and mice. Endocrinology. 2004;145:3873–3880. doi: 10.1210/en.2004-0284. [DOI] [PubMed] [Google Scholar]
- 22.Bi S, Ladenheim EE, Schwartz GJ, Moran TH. A role for NPY overexpression in the dorsomedial hypothalamus in hyperphagia and obesity of OLETF rats. Am J Physiol Regul Integr Comp Physiol. 2001;281:R254–R260. doi: 10.1152/ajpregu.2001.281.1.R254. [DOI] [PubMed] [Google Scholar]
- 23.Moran TH, Lee P, Ladenheim EE, Schwartz GJ. Responsivity to NPY and melanocortins in obese OLETF rats lacking CCK-A receptors. Physiol Behav. 2002;7:397–402. doi: 10.1016/s0031-9384(01)00667-9. [DOI] [PubMed] [Google Scholar]
- 24.Moran TH. Unraveling the obesity of OLETF rats. Physiol Behav. 2008;94:71–78. doi: 10.1016/j.physbeh.2007.11.035. [DOI] [PMC free article] [PubMed] [Google Scholar]
- 25.Miller LJ, Holicky EL, Ulrich CD, Wieben ED. Abnormal processing of the human cholecystokinin receptor gene in association with gallstones and obesity. Gastroenterology. 1995;109:1375–1380. doi: 10.1016/0016-5085(95)90601-0. [DOI] [PubMed] [Google Scholar]
- 26.Kesterson RA, Huszar D, Lynch CA, Simerly RB, Cone RD. Induction of neuropeptide Y gene expression in the dorsal medial hypothalamic nucleus in two models of the agouti obesity syndrome. Mol Endocrinol. 1997;11:630–637. doi: 10.1210/mend.11.5.9921. [DOI] [PubMed] [Google Scholar]
- 27.Guan XM, Yu H, Trumbauer M, Frazier E, Van der Ploeg LH, Chen H. Induction of neuropeptide Y expression in dorsomedial hypothalamus of diet-induced obese mice. Neuroreport. 1998a;9:3415–3419. doi: 10.1097/00001756-199810260-00015. [DOI] [PubMed] [Google Scholar]
- 28.Guan XM, Yu H, Van der Ploeg LH. Evidence of altered hypothalamic pro-opiomelanocortin/neuropeptide Y mRNA expression in tubby mice. Brain Res Mol Brain Res. 1998b;59:273–279. doi: 10.1016/s0169-328x(98)00150-8. [DOI] [PubMed] [Google Scholar]
- 29.Tritos NA, Elmquist JK, Mastaitis JW, Flier JS, Maratos-Flier E. Characterization of expression of hypothalamic appetite-regulating peptides in obese hyperleptinemic brown adipose tissuedeficient (uncoupling protein-promoter-driven diphtheria toxin A) mice. Endocrinology. 1998;139:4634–4641. doi: 10.1210/endo.139.11.6308. [DOI] [PubMed] [Google Scholar]
- 30.Kawano K, Hirashima T, Mori S, Saitoh Y, Kurosumi M, Natori T. Spontaneous long-term hyperglycemic rat with diabetic complications. Otsuka Long-Evans Tokushima Fatty (OLETF) strain. Diabetes. 1992;41:1422–1428. doi: 10.2337/diab.41.11.1422. [DOI] [PubMed] [Google Scholar]
- 31.Levine A, Zagoory-Sharon O, Feldman R, Weller A. Oxytocin during pregnancy and early postpartum: individual patterns and maternal-fetal attachment. Peptides. 2007;28:1162–1169. doi: 10.1016/j.peptides.2007.04.016. [DOI] [PubMed] [Google Scholar]
- 32.Kramer KM, Cushing BS, Carter CS, Ottinger MA. Sex and species differences in plasma oxytocin using an enzyme immunoassay. Can J Zool. 2004;82:1194–1200. [Google Scholar]
- 33.Bailey JW, Barker RL, Beauchene RE. Age-related changes in rat adipose tissue cellularity are altered by dietary restriction and exercise. J Nutr. 1993;123:52–58. doi: 10.1093/jn/123.1.52. [DOI] [PubMed] [Google Scholar]
- 34.Youngstrom TG, Bartness TJ. White adipose tissue sympathetic nervous system denervation increases fat pad mass and fat cell number. Am J Physiol. 1998;275:R1488–R1493. doi: 10.1152/ajpregu.1998.275.5.R1488. [DOI] [PubMed] [Google Scholar]
- 35.Casabiell X, Pineiro V, Peino R, Lage M, Camina J, Gallego R, et al. Gender differences in both spontaneous and stimulated leptin secretion by human omental adipose tissue in vitro: dexamethasone and estradiol stimulate leptin release in women, but not in men. J Clin Endocrinol Metab. 1998;83:2149–2155. doi: 10.1210/jcem.83.6.4849. [DOI] [PubMed] [Google Scholar]
- 36.Li J, Yu X, Pan W, Unger RH. Expression profile of rat adipose tissue at the onset of high-fat-diet obesity. Am J Physiol Endocrinol Metab. 2002;282:E1334–E1341. doi: 10.1152/ajpendo.00516.2001. [DOI] [PubMed] [Google Scholar]
- 37.Martin-Hidalgo A, Huerta L, Alvarez N, Alegria G, Del Val Toledo M, Herrera E. Expression, activity, and localization of hormonesensitive lipase in rat mammary gland during pregnancy and lactation. J Lipid Res. 2005;46:658–668. doi: 10.1194/jlr.M400370-JLR200. [DOI] [PubMed] [Google Scholar]
- 38.Garcia MD, Casanueva FF, Dieguez C, Senaris RM. Gestational profile of leptin messenger ribonucleic acid (mRNA) content in the placenta and adipose tissue in the rat, and regulation of the mRNA levels of the leptin receptor subtypes in the hypothalamus during pregnancy and lactation. Biol Reprod. 2000;62:698–703. doi: 10.1095/biolreprod62.3.698. [DOI] [PubMed] [Google Scholar]
- 39.Herrera E, Lasuncion MA, Huerta L, Martin-Hidalgo A. Plasma leptin levels in rat mother and offspring during pregnancy and lactation. Biol Neonate. 2000;78:315–320. doi: 10.1159/000014286. [DOI] [PubMed] [Google Scholar]
- 40.Butte NF, Hopkinson JM, Nicolson MA. Leptin in human reproduction: serum leptin levels in pregnant and lactating women. J Clin Endocrinol Metab. 1997;82:585–589. doi: 10.1210/jcem.82.2.3731. [DOI] [PubMed] [Google Scholar]
- 41.Schroeder M, Zagoory-Sharon O, Lavi-Avnon Y, Moran TH, Weller A. Weight gain and maternal behavior in CCK1 deficient rats. Physiol Behav. 2006;89:402–409. doi: 10.1016/j.physbeh.2006.07.008. [DOI] [PubMed] [Google Scholar]
- 42.Schroeder M, Lavi-Avnon Y, Zagoory-Sharon O, Moran TH, Weller A. Pre-obesity in the infant OLETF rat: the role of suckling. Dev Psychobiol. 2007a;49:685–691. doi: 10.1002/dev.20235. [DOI] [PubMed] [Google Scholar]
- 43.Schroeder M, Lavi-Avnon Y, Dagan M, Zagoory-Sharon O, Moran TH, Weller A. Diurnal and nocturnal nursing behavior in the OLETF rat. Dev Psychobiol. 2007b;49:323–333. doi: 10.1002/dev.20206. [DOI] [PubMed] [Google Scholar]
- 44.Bi S, Scott KA, Hyun J, Ladenheim EE, Moran TH. Running wheel activity prevents hyperphagia and obesity in Otsuka Long-Evans Tokushima fatty rats: role of hypothalamic signaling. Endocrinology. 2005;146:1676–1685. doi: 10.1210/en.2004-1441. [DOI] [PubMed] [Google Scholar]
- 45.Watanobe H, Yoneda M, Kohsaka A, Kakizaki Y, Suda T, Schioth HB. Normalization of circulating leptin levels by fasting improves the reproductive function in obese OLETF female rats. Neuropeptides. 2001;35:45–49. doi: 10.1054/npep.2000.0842. [DOI] [PubMed] [Google Scholar]
- 46.Li C, Chen P, Smith MS. Neuropeptide Y (NPY) neurons in the arcuate nucleus (ARH) and dorsomedial nucleus (DMH), areas activated during lactation, project to the paraventricular nucleus of the hypothalamus (PVH) Regul Pept. 1998;75–76:93–100. doi: 10.1016/s0167-0115(98)00057-3. [DOI] [PubMed] [Google Scholar]
- 47.Schwartz MW, Woods SC, Porte D, Jr, Seeley RJ, Baskin DG. Central nervous system control of food intake. Nature. 2000;404:661–671. doi: 10.1038/35007534. [DOI] [PubMed] [Google Scholar]
- 48.Blevins JE, Schwartz MW, Baskin DG. Evidence that paraventricular nucleus oxytocin neurons link hypothalamic leptin action to caudal brain stem nuclei controlling meal size. Am J Physiol Regul Integr Comp Physiol. 2004;287:R87–R96. doi: 10.1152/ajpregu.00604.2003. [DOI] [PubMed] [Google Scholar]
- 49.Bayol SA, Farrington SJ, Stickland NC. A maternal ‘junk food’ diet in pregnancy and lactation promotes an exacerbated taste for ‘junk food’ and a greater propensity for obesity in rat offspring. Br J Nutr. 2007;98:843–851. doi: 10.1017/S0007114507812037. [DOI] [PubMed] [Google Scholar]
- 50.Caluwaerts S, Lambin S, van Bree R, Peeters H, Vergote I, Verhaeghe J. Diet-induced obesity in gravid rats engenders early hyperadiposity in the offspring. Metabolism. 2007;56:1431–1438. doi: 10.1016/j.metabol.2007.06.007. [DOI] [PubMed] [Google Scholar]
- 51.Levin BE, Govek E. Gestational obesity accentuates obesity in obesity-prone progeny. Am J Physiol Regul Integr Comp Physiol. 1998;275:R1374–R1379. doi: 10.1152/ajpregu.1998.275.4.R1374. [DOI] [PubMed] [Google Scholar]
- 52.Gorski JN, Dunn-Meynell AA, Hartman TG, Levin BE. Postnatal environment overrides genetic and prenatal factors influencing offspring obesity and insulin resistance. Am J Physiol Regul Integr Comp Physiol. 2006;291:R768–R778. doi: 10.1152/ajpregu.00138.2006. [DOI] [PubMed] [Google Scholar]
- 53.Férézou-Viala J, Roy AF, Sérougne C, Gripois D, Parquet M, Bailleux V, et al. Long-term consequences of maternal high-fat feeding on hypothalamic leptin sensitivity and diet-induced obesity in the offspring. Am J Physiol Regul Integr Comp Physiol. 2007;293:R1056–R1062. doi: 10.1152/ajpregu.00117.2007. [DOI] [PubMed] [Google Scholar]