

Abstract
Objectives
Self‐reported adherence assessment in HIV‐infected patients on antiretroviral therapy (ART) is challenging and may overestimate adherence. The aim of this study was to improve the ability of health care providers to elicit patients’ reports of nonadherence using a “patient‐centred” approach in a rural sub‐Saharan African setting.
Methods
A prospective interventional cohort study of HIV‐infected patients on ART for ≥ 6 months attending an HIV clinic in rural Tanzania was carried out. The intervention consisted of a 2‐day workshop for health care providers on patient‐centred communication and the provision of an adherence assessment checklist for use in the consultations. Patients’ self‐reports of nonadherence (≥ 1 missed ART dose/4 weeks), subtherapeutic plasma ART concentrations (< 2.5th percentile of published population‐based pharmacokinetic models), and virological and immunological failure according to the World Health Organization definition were assessed before and after (1–3 and 6–9 months after) the intervention.
Results
Before the intervention, only 3.3% of 299 patients included in the study reported nonadherence. Subtherapeutic plasma ART drug concentrations and virological and immunological failure were recorded in 6.5%, 7.7% and 14.5% of the patients, respectively. Two months after the intervention, health care providers detected significantly more patients reporting nonadherence compared with baseline (10.7 vs. 3.3%, respectively; P < 0.001), decreasing to 5.7% after 6–9 months. A time trend towards higher drug concentrations was observed for efavirenz but not for other drugs. The virological failure rate remained unchanged whereas the immunological failure rate decreased from 14.4 to 8.7% at the last visit (P = 0.002).
Conclusions
Patient‐centred communication can successfully be implemented with a simple intervention in rural Africa. It increases the likelihood of HIV‐infected patients reporting problems with adherence to ART; however, sustainability remains a challenge.
Keywords: antiretroviral therapy, HIV, patient‐centred communication, self‐reported adherence, sub‐Saharan Africa, therapeutic drug monitoring
Introduction
Antiretroviral treatment (ART) has dramatically decreased rates of HIV‐related morbidity and mortality, but these effects critically depend on successful lifelong treatment. Adherence to ART is essential for the success of HIV treatment. Without sufficient adherence, treatment failure is much more likely to occur, leading to avoidable HIV‐related morbidity and mortality, emergence of resistant HIV strains and ongoing HIV transmission 1, 2, 3, 4. Maintaining good adherence to ART is challenging for many HIV‐infected patients, making nonadherence a frequent and important problem globally 5, 6, 7, 8, 9. A meta‐analysis of 84 observational studies from high‐ and low‐income countries in 2011 found that only an average of 62% of HIV‐infected patients reported a sufficient intake of ≥ 90% of the prescribed ART drugs 7.
Interventions to improve, support and sustain adherence to ART are clearly needed. Adherence is crucial for the individual but also from a public health perspective, particularly in light of the new World Health Organization (WHO) recommendations to treat all patients living with HIV regardless of CD4 count and to implement treatment as prevention 10.
Different approaches to improve adherence exist 11, 12, 13, 14, 15. They are all based upon the reliable detection of nonadherence. Self‐reported adherence is most commonly used for adherence assessment because it is inexpensive and easy to apply in almost all settings 16, 17, 18. However, self‐reports tend to overestimate adherence because of recall or social desirability bias 3, 19, 20, 21, 22, 23.
In order to improve patients’ adherence, health care providers must encourage patients to talk about adherence problems 24, 25, 26. Patients must feel invited to talk about their personal views, including their perspective on medication adherence. Elicting the patient's perspective is a central element of patient‐centred communication 27. This approach, advocated as a central element of high‐quality medical care mainly in western settings 28, 29, 30, has received little attention in many low‐income countries including sub‐Saharan Africa where a “doctor‐centred” approach is still more commonly applied 31, 32.
The aim of this study was to examine whether a 2‐day workshop focussing on “patient‐centred” communication improves the ability of health care providers to elicit patients’ reports of problems with adherence in the rural setting of sub‐Saharan Africa 33, 34, 35.
Methods
Study setting
Our 1‐year prospective interventional cohort study was conducted at the Chronic Diseases Clinic of Ifakara (CDCI) at the St Francis Referral Hospital in rural Tanzania from October 2013 until September 2014.
The CDCI is a governmental accredited HIV clinic that provides free medical care and antiretroviral drugs for HIV‐infected patients in the framework of the Kilombero and Ulanga Antiretroviral Cohort (KIULARCO). At the time of the study, approximately 3000 patients at the CDCI were taking ART. Thirteen Tanzanian health care providers, that is, six physicians, four nurses, two adherence counsellors and one pharmacist, cared for an average of 73 HIV‐infected patients daily (range 36–133).
Study population
All consecutive HIV‐infected patients presenting at the CDCI between October and November 2013 fulfilling the inclusion criteria were enrolled in the study. Inclusion criteria were HIV‐infected adult ≥ 16 years, therapy with an efavirenz‐, nevirapine‐, lopinavir/ritonavir‐ or atazanavir/ritonavir‐based ART regime for at least 6 months, and provision of written informed consent. Patients on treatment with rifampicin or other drugs potentially inducing ART drug metabolism and patients from other HIV clinics were excluded.
Intervention
All the Tanzanian health care providers (n = 13) with direct patient contact, including all six HIV physicians, received 2 days of training in the basic elements of patient‐centred communication. Goals were defined as follows: to identify patients with nonadherenence, to identify their reasons for nonadherence, and to establish means to improve adherence. During the workshop, participants provided descriptions of difficult patient encounters and they identified their communication strategies when they had detected a patient with adherence problems, usually provision of information (see Fig. S1). Then, alternatives were offered and trained in role‐plays among participants. Seminars were held in December 2013 and were delivered by an experienced communication teacher working in the HIV field (author W. Langewitz) 33, 34, 35, 36. In addition, all physicians received a written two‐page adherence assessment checklist, adapted from the published European AIDS Clinical Society 2011 guidelines 37, to facilitate future consultations and adherence assessment (see Fig. S2).
Study evaluations
All study patients were assessed by their physicians during their routine visits at the CDCI at three different time‐points over 1 year (Fig. 1). No additional visits were scheduled for the study. The baseline visit (visit 1) took place at entry into the study. The communication training was performed shortly after completion of the baseline visits of all included patients. Follow‐up visits were 1–3 months (visit 2) and 6–9 months (visit 3) after the intervention. Adherence, clinical parameters, comedications and laboratory HIV surrogate markers were evaluated at each study visit.
Figure 1.

The study algorithm. V1, visit 1 (baseline visit); V2, visit 2; V3, visit 3; Questionnaire, self‐reported adherence questionnaire; TDM, therapeutic drug monitoring; days, days between the evaluation and the communication training (interquartile range); numbers represent numbers of patients.
Self‐reported adherence was assessed by the treating physicians using a validated short questionnaire that consisted of the following two questions as per the standard procedure in the CDCI 4, 38, 39: (1) “How often have you missed a dose of your HIV medication in the past 4 weeks: daily, more than once a week, once a week, once every second week, once a month, never?” and (2) “Did you miss ART ≥ 2 days in a row in the last 4 weeks: yes or no?”
At each study visit, we carried out therapeutic drug monitoring (TDM) by measuring the plasma ART drug concentrations of efavirenz, nevirapine, lopinavir and atazanavir to assess short‐term adherence. Plasma samples were analysed with a validated liquid chromatography tandem mass spectrometry method (LC‐MS/MS; API 4000 QTrap; AB Sciex, Massachusetts, USA) at the analytical laboratory of the Division of Clinical Pharmacology at the University Hospital Basel (Basel, Switzerland).
CD4 cell count and HIV RNA were measured at every study visit. CD4 cell counts were analysed using a flow cytometry system (FACS Calibur; BD Company, Franklin Lakes, NJ). HIV RNA was prepared using the semi‐automated extractor platform Prepito (PerkinElmer chemagen, Baesweiler, Germany) and quantified using a validated protocol 40 at the CDCI laboratory and a reference laboratory at the University of Basel (Basel, Switzerland).
All plasma sample aliquots for HIV RNA and ART TDM were stored at −80°C and shipped on dry ice to the reference laboratory in Switzerland for analysis.
HIV RNA and TDM results were not available to the health care providers before visit 3 for logistical reasons.
Definitions
Self‐reported nonadherence in the questionnaire was defined as having missed at least one dose of ART medication in the last 4 weeks. We considered other less strict definitions of nonadherence: having missed at least two ART doses and having missed at least two consecutive ART doses (drug holidays) in the last 4 weeks. For TDM, an inadequate subtherapeutic drug concentration as a marker for nonadherence was defined as any concentration below the 2.5th percentile of published population‐based pharmacokinetic models for efavirenz 600 mg once daily 41, nevirapine 200 mg twice daily 42, lopinavir/ritonavir 400/100 mg twice daily 43 and atazanavir/ritonavir 300/100 mg once daily 44. Clinical failure was defined as the occurence of any new WHO AIDS‐defining disease, death, or loss to follow‐up at visits 2 and 3. Virological failure was defined according to the WHO 2014 guidelines as a detectable HIV RNA of ≥ 1000 copies/ml. Immunological failure was defined as a decrease in CD4 count to below the baseline value at HIV diagnosis, a fall of > 50% from the value at the baseline study visit (visit 1), or persistent CD4 cell count < 100 cells/μl 45.
Primary and secondary endpoints
The primary endpoint was the rate of patients’ self‐reported nonadherence, defined as at least one missed ART dose in the last 4 weeks, detected by the physician after the teaching intervention (visits 2 and 3) compared with that detected at visit 1. Secondary endpoints were the rate of patients with subtherapeutic ART drug concentrations and the rate of patients with virological and immunological failure at the end of the study (visit 3) compared with those at visit 1.
Statistical analysis
A paired t‐test was performed for continuous normally distributed data and a sign test or Wilcoxon signed‐rank test was performed for nonparametric data to test the null hypothesis. For categorial variables, McNemar's test was used. A P‐value < 0.05 was considered significant. A kappa test was used to analyse the agreement between different adherence measurements.
In accordance with the published literature 6, 7, 8, 9, and assuming an adherence rate of 60%, a sample size of approximately 300 patients was calculated to be required to detect an increase to 70% (determined by TDM) with 90% power, α = 0.05 and an estimated drop‐out rate of 20%.
All analyses were performed using stata™ software version 11 for Windows (Stata Corp, College Station, TX, USA).
Patient data were extracted from electronic and paper‐based patient charts and anonymized before analysis.
Ethics
Research and ethical clearance was obtained from the Ifakara Health Institute Institutional Review Board (IHI/IRB/No.28‐2013), the Medical Research Coordination Board of the Tanzanian National Institute for Medical Research (NIMR/HQIR.8a/V01.IXlI762), and the Tanzanian Commission for Science & Technology (No.2014‐276‐NA‐2014‐195). Written informed consent was obtained from all participants enrolled in the study.
Results
Baseline participant characteristics and clinical outcome
Three hundred and four patients were evaluated for study enrolment. Five patients were excluded because they were on current tuberculosis treatment (n = 2) or had medical care provided at another HIV clinic (n = 3). Data for a total of 299 HIV‐infected patients on ART were finally analysed. Two hundred and 42 patients (80.9%) completed study evaluations at all three visits, including clinical and self‐reported adherence assessment, CD4 cell count, viral load measurement and TDM (Fig. 1). Baseline characteristics are summarized in Table 1. The median age was 41 years [interquartile range (IQR) 35–48 years] and 28.8% were male. Most patients lived < 5 km from the CDCI (72.9%) and worked as farmers (85.9%). Two‐thirds of the patients started ART because they had WHO stage IV disease or a CD4 cell count < 200 cells/μl. The median CD4 count nadir was 138 cells/μl (IQR: 59–220 cells/μl) and 59.2% had WHO stage III/IV disease. Median ART duration at baseline was 43 months (IQR: 22–64 months). Sixty‐seven per cent were taking an efavirenz‐based and 36.8% a one‐pill fixed‐dose combination ART regimen (efavirenz, tenofovir and emtricitabine or lamivudine). Nine per cent were on a second‐line protease inhibitor‐based ART regimen with lopinavir/ritonavir. One quarter of the patients had experienced at least one episode of nonadherence prior to the study. Only three patients reported signs of ART toxicity and one patient was newly diagnosed with Kaposi sarcoma at the baseline visit. Fifteen patients (5.4%) had an unfavourable outcome over the entire study period: six patients were diagnosed with a new AIDS‐defining disease (four with tuberculosis and two with Kaposi sarcoma), six patients died (one from tuberculosis and five for unknown reasons), and three were lost to follow‐up at visits 2 and 3 (Table 2).
Table 1.
Baseline characteristics of the 299 study patients
| Baseline characteristics | |
| Age (years) [median (IQR)] | 41 (35–48) |
| Sex, male [n (%)] | 86 (28.8) |
| Pregnant [n (%)] | 7 (2.3) |
| Distance from clinic [n (%)]* | |
| < 5 km | 218 (72.9) |
| 5–50 km | 56 (18.7) |
| > 50 km | 24 (8.0) |
| Marital status [n (%)] | |
| Married | 137 (45.8) |
| Not married | 162 (54.2) |
| Education [n (%)]* | |
| None | 27 (9.1) |
| Primary school | 252 (84.6) |
| Secondary school or higher | 19 (6.3) |
| Occupation [n (%)] | |
| Employed | 32 (10.7) |
| Farmer | 256 (85.6) |
| Other (e.g. unemployed) | 11 (3.7) |
| AIDS‐defining diseases (WHO stage III/IV) in the past [n (%)] | |
| Tuberculosis | 91 (30.4) |
| Cryptoccocus | 4 (1.3) |
| Kaposi sarcoma | 8 (2.7) |
| Reason for starting ART* | |
| CD4 < 200 cells/μl and/or WHO stage IV [n (%)] | 194 (65.1) |
| CD4 < 350 cells/μl and/or WHO stage III [n (%)] | 95 (31.9) |
| Time from ART initiation to start of study (months) [median (IQR)] | 43 (22–64) |
| ART regimen [n (%)]** | |
| Efavirenz‐based | 200 (66.9) |
| Nevirapine‐based | 73 (24.4) |
| Lopinavir/ritonavir‐based | 26 (8.7) |
| Atazanavir/ritonavir‐based | 0 (0.0) |
| Backbone tenofovir + emtricitabine | 135 (45.2) |
| Backbone zidvoduine + lamivudine | 164 (54.8) |
| One‐pill regimen (EFV + TDF + FTC or 3TC) | 110 (36.8) |
| ART toxicity at baseline visit [n (%)] | 3 (1.0) |
| Comedication [n (%)] | |
| Cotrimoxazole prophylaxis | 125 (41.8) |
| Other drugs | 66 (22.1) |
| WHO stage at baseline visit [n (%)] | |
| Stage I/II | 122 (40.8) |
| Stage III/IV | 177 (59.2) |
| Clinical/laboratory data [mean (SD)] | |
| BMI (kg/m2) | 23.2 (4.5) |
| Blood pressure systolic/diastolic (mmHg) | 122/76 (20.2/12.6) |
| White blood cells (×109/l) | 5.4 (1.6) |
| Haemoglobin (g/dl) | 12.1 (1.8) |
| Alanin aminotransferase (ALAT) (IU/l) | 21.9 (15.2) |
| Serum creatinine (μmol/l) | 58.5 (22.0) |
| History of self‐reported nonadherence prior to study | |
| Patients with ≥ 1 previous episode of ≥ 1 missed ART dose [n (%)] | 73 (24.4) |
| Absolute CD4 count (cells/μl) [median (IQR)] | |
| At HIV diagnosis | 174 (75–319) |
| Nadir | 138 (59–220) |
ART, antiretroviral therapy; BMI, body mass index; IQR, interquartile range; WHO, World Health Organization. *One patient had missing data. **Prescribed ART dosages were as follows: efavirenz (EVF) 600 mg once daily, nevirapine 200 mg twice daily, lopinavir/ritonavir 400 mg/100 mg twice daily, atazanavir/ritonavir 300 mg/100 mg once daily, tenofovir disoproxil fumarate (TDF) 300 mg once daily, emtricitabine (FTC) 200 mg once daily, lamivudine (3TC) 300 mg once daily or 150 mg twice daily, and zidovudine 300 mg twice daily.
Table 2.
Adherence assessment and outcome measures over the study period
| Visit 1 | Visit 2 | Visit 3 | P values | |
|---|---|---|---|---|
| Self‐reported adherence assessed using questionnaire | n = 299 | n = 291 | n = 280 | |
| ≥ 1 ART dose missed in last 4 weeks [n (%)] | 10 (3.3) | 31 (10.7) | 16 (5.7) |
V1 vs. V2: P < 0.001*
V1 vs. V3: P = 0.200* V2 vs. V3: P = 0.016* |
| ≥ 2 ART doses missed in last 4 weeks [n (%)] | 2 (0.7) | 16 (5.5) | 11 (3.9) |
V1 vs. V2: P = 0.001*
V1 vs. V3: P = 0.013* V2 vs. V3: P = 0.300* |
| ≥ 2 consecutive ART doses missed in last 4 weeks (n (%)] | 1 (0.3) | 8 (2.7) | 9 (3.2) |
V1 vs. V2: P = 0.020*
V1 vs. V3: P = 0.011* V2 vs. V3: P = 0.808* |
| Adherence assessment by TDM of ART: subtherapeutic drug concentrations† | n = 294 | n = 275 | n = 255 | |
| All ART compounds [n (%)] | 19 (6.5) | 20 (7.3) | 12 (4.7) | V1 vs. V3: P = 0.800* |
| Efavirenz‡ [n (%)] | 17 (8.7) | 12 (6.7) | 7 (4.2) | V1 vs. V3: P = 0.080§ |
| Nevirapine¶ [n (%)] | 1 (1.4) | 4 (5.9) | 1 (1.7) | |
| Lopinavir** [n (%)] | 1 (4.0) | 3 (12.0) | 3 (15.0) | |
| Atazanvir†† [n (%)] | NA | 1 (33.3) | 1 (11.1) | |
| HIV viral load | n = 297 | n = 286 | n = 284 | |
| HIV RNA ≥ 1000 copies/ml [n (%)] | 23 (7.7) | 26 (9.1) | 26 (9.2) | V1 vs. V3: P = 0.500‡‡ |
| CD4 cell count | n = 298 | n = 285 | n = 275 | |
| Absolute CD4 count (cells/μl) [median (IQR)] | 413 (268–610) | 464 (313–630) | 504 (329–647) | V1 vs. V3: P < 0.001§§ |
| CD4 percentage [median (IQR)] | 21 (14–21) | 22 (16–29) | 22 (17–29) | |
| Immunological failure [n (%)] | 43 (14.4) | 31 (10.9) | 24 (8.7) | V1 vs. V3: P = 0.002‡‡ |
| Clinical outcome for all visits | n = 299 | |||
| Unfavourable outcome, cumulative [n (%)] | 15 (5.0) | NA | ||
| AIDS‐defining disease¶¶ [n (%)] | 6 (2.0) | NA | ||
| Death*** [n (%)] | 6 (2.0) | NA | ||
| Loss to follow‐up††† [n (%)] | 3 (1.0) | NA |
NA, not applicable; V1, visit 1; V2, visit 2; V3, visit 3; IQR, interquartile range; TDM, therapeutic drug monitoring; ART, antiretroviral therapy. *McNemar test. †Subtherapeutic drug concentration was defined as any concentration below the 2.5th percentile of published population‐based pharmacokinetic models for efavirenz 41, nevirapine 42, lopinavir/ritonavir 43 and atazanavir/ritonavir 44. ‡Efavirenz: n = 196, 179 and 168 at visits 1, 2 and 3, respectively. §Chi‐squared trend analysis. ¶Nevirapine: n = 73, 68 and 58 at visits 1, 2 and 3 respectively. **Lopinavir: n = 25, 25 and 20 at visits 1, 2 and 3, respectively. ††Atazanavir: n = 0, 3 and 9 at visits 1, 2 and 3, respectively. ‡‡Repeated measures logistic regression.§§Paired Wilcoxon rank test., ¶¶Four patients with tuberculosis and two with Kaposi sarcoma. ***One patient died because of tuberculosis (not counted in AIDS‐defining diseases).†††Did not return to clinic for visits 2 and 3.
Self‐reported adherence assessed using the questionnaire
Only 3.3% of the patients reported nonadherence (missed at least one ART dose in the last 4 weeks) via the questionnaire at the baseline visit (visit 1) (Table 2). The median time from the intervention to visit 2 and visit 3 was 63 (IQR: 51–77) and 246 (IQR: 234–260) days, respectively. At visit 2, significantly more patients reported problems with adherence (10.7%) compared with baseline (P < 0.001). At visit 3, the detection rate decreased to 5.7%, which was not statistically different from that at baseline (P = 0.201). Similar results were obtained when stratifying for protease inhibitor and nonnucleoside reverse transcriptase inhibitor therapy as well as for one‐pill‐ and poly‐pill‐based ART regimens.
When alternative cut‐offs were used to define nonadherence (at least two missed ART doses and drug holidays in the last 4 weeks), the reported nonadherence rate was significantly higher at visit 2 (5.5 and 2.7%, respectively) and remained significantly higher at visit 3 (3.9 and 3.2%, respectively) compared with baseline (0.7% and 0.3%, respectively) (Table 2 and Fig. 2).
Figure 2.
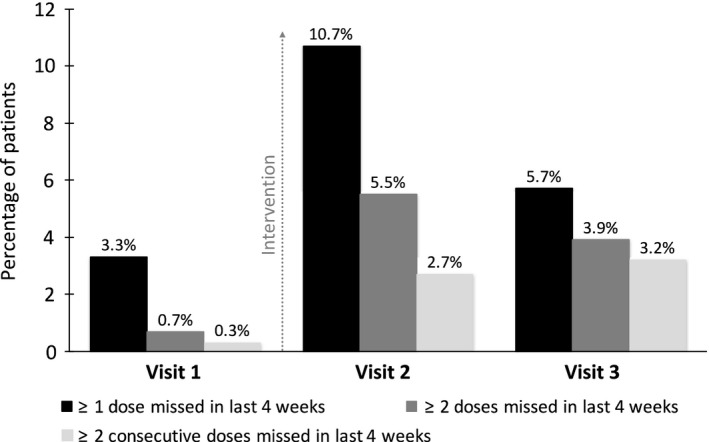
Percentage of patients with self‐reported nonadherence to antiretroviral therapy (ART) assessed using the questionnaire at each study visit. The y‐axis shows the percentage of patients with self‐reported nonadherence.
Reasons for missed ART doses were available in 28 of the 59 patients (47%) who reported nonadherence during the study period. The most common reasons for missed ART doses were running out of pills (64.3%), forgetting to take the pills (10.7%), travel problems (7.1%) and feeling depressed (3.6%).
Adherence assessment by plasma ART therapeutic drug monitoring
Plasma drug concentrations were measured for efavirenz (n = 543), nevirapine (n = 199), lopinavir (n = 70) and atazanavir (n = 12). Concentration−time plots for efavirenz, nevirapine and lopinavir are shown in Fig. 3. The mean time interval between last ART intake and drug concentration measurement was 14:40 h for efavirenz [standard deviation (SD) ± 2:50 h], 13:32 h for nevirapine (SD ± 3:46 h) and 12:48 h for lopinavir (SD ± 3:13 h) and was similar at each of the three visits. At visit 1, 6.5% of patients had a subtherapeutic drug concentration (< 2.5th percentile) for any of the ART compounds (Table 2). In univariate models, the only factors associated with a decreased likelihood of subtherapeutic drug concentrations at baseline were female gender (P = 0.03) and nevirapine‐based regimen (compared with efavirenz‐based regimen; P = 0.06). For all ART compounds, the rate of subtherapeutic drug concentrations did not change significantly over the study period despite the intervention (P = 0.80). For efavirenz only, there was a time trend towards fewer patients with subtherapeutic drug concentrations after the intervention (P = 0.08) (Table 2).
Figure 3.
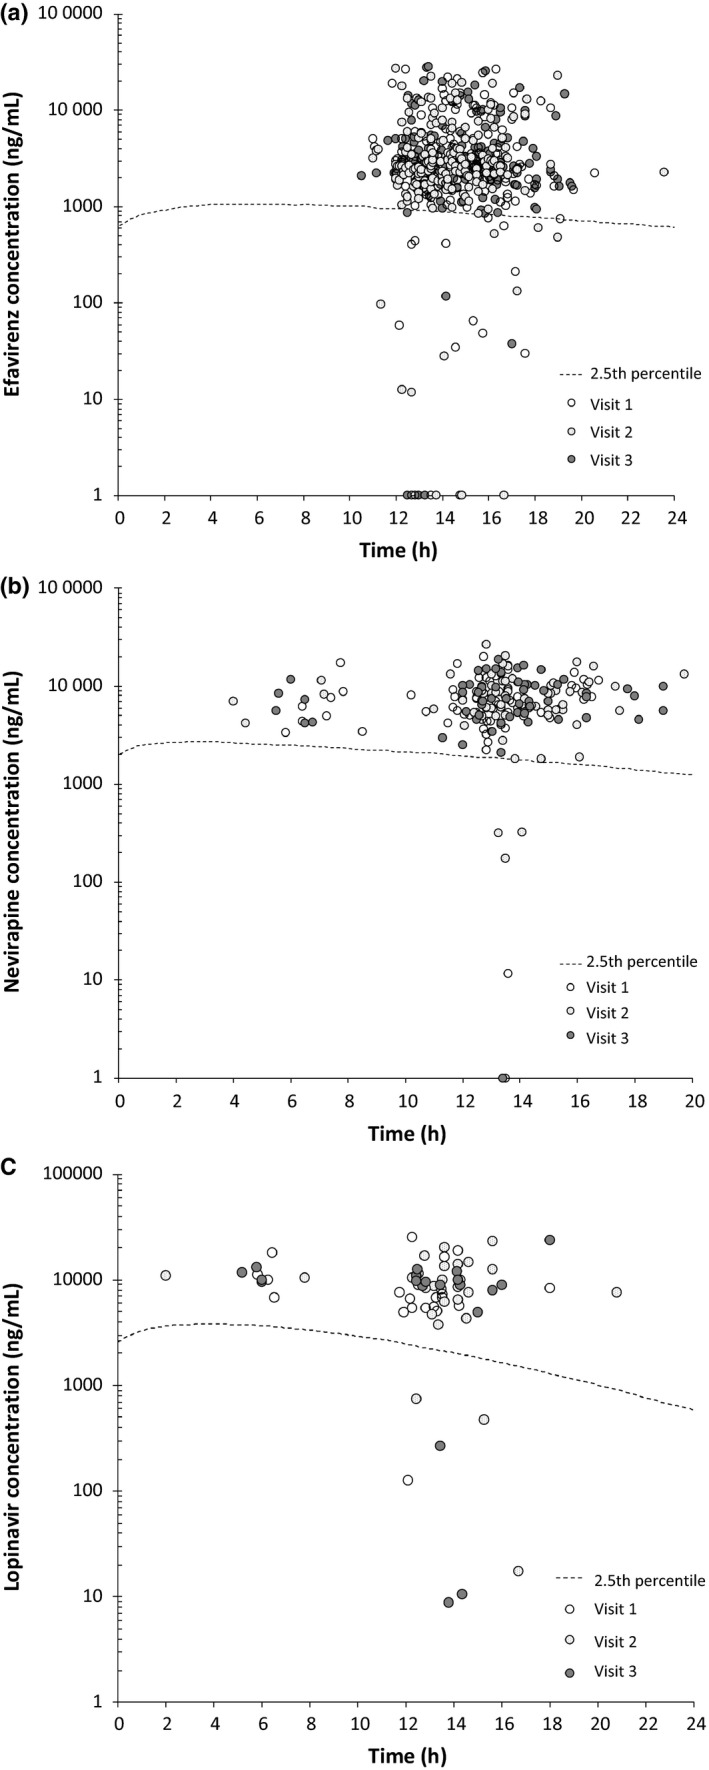
Plasma concentration−time plots for different antiretroviral therapy (ART) drugs. (a) Plasma concentration−time plots for patients receiving 600 mg efavirenz once daily for all three study visits. (b) Plasma concentration−time plots for patients receiving 200 mg nevirapine twice daily for all three study visits. (c) Plasma concentration−time plots for patients receiving 400/100 mg lopinavir/ritonavir twice daily for all three study visits. The y‐axis has a logarithmic scale. Circles represent patient samples. The dashed line represents the 2.5th percentile concentration curve derived from published population‐based pharmacokinetic models (efavirenz 41, nevirapine 42 and lopinavir 43). Concentrations of ART drugs below the 2.5th percentile are considered subtherapeutic. Circles on the x‐axis represent patient samples with drug concentrations below the lower limit of quantification or undetectable.
Three patients (two on efavirenz and one on lopinavir) had comedication with rifampicin at visit 3 because of newly diagnosed tuberculosis during the study. One of them had an undetectable efavirenz drug concentration.
Comedications other than rifampicin (e.g. antihypertensives, antibiotics, iron tablets, anti‐histaminics, anti‐malarials and vitamins) were more frequent in patients with lower drug concentrations (34.6%) compared with those with adequate drug concentrations (22.4%; P = 0.04); however, no significant drug−drug interactions with ART could be identified.
CD4 cell count and HIV viral load
The median CD4 cell count was 413 (IQR: 268–610) cells/μl at baseline, and increased significantly over time by 91 cells/μl to 504 cells/μl at visit 3 (P < 0.001 for the comparison of visit 1 with visit 3). Immunological failure was observed in 43 patients (14.4%) at baseline. The odds of immunological failure decreased over time (odds ratio 0.75; P = 0.002) (Table 2). Of the 53 patients with immunological failure at visit 1 and/or visit 2, only eight patients were switched to a second‐line treament with lopinavir or atazanavir.
Twenty‐three patients (7.7%) demonstrated virological failure, with HIV RNA ≥ 1000 copies/ml, at baseline (Table 2). Independent of the ART regimen, there was no significant change in the virological failure rate observed over time despite the intervention (odds ratio 1.09; P = 0.50). Of the 39 patients with virological failure at visit 1 and/or visit 2, five patients were switched to a second‐line ART regimen with lopinavir or atazanavir because of concurrent immunological failure.
In a sensitivity analysis including only the 242 patients with complete evaluations at all three visits (excluding all patients who missed visit 2 or 3; Fig. 1), very similar results were obtained (data not shown).
Test agreement between self‐reported adherence assessed using the questionnaire, plasma ART therapeutic drug monitoring and virological failure
Test agreement between adherence assessed using the questionnaire and subtherapeutic ART drug concentration measurements was moderate to weak and differed over the three visits and depending on the definition of self‐reported nonadherence (Table 3). The highest agreement was found at visit 2 when nonadherence was defined as at least two missed ART doses or at least two missed consecutive ART doses in the last 4 weeks (κ 0.11 and 0.18; both P < 0.05). Virological failure (HIV RNA ≥ 1000 copies/ml) was significantly correlated with subtherapeutic ART drug concentration across all three visits (κ 0.329; P < 0.0001) but not with self‐reported nonadherence assessed using the questionnaire (κ −0.0614 to 0.0099) (Table 3).
Table 3.
Test agreement between adherence questionnaire, therapeutic drug monitoring and viral load measurements
| Visit | κ | P‐value | ||
|---|---|---|---|---|
| Self‐reported adherence and therapeutic drug monitoring | ||||
| Adherence questions and subtherapeutic drug concentrations* | Missed ≥ 1 ART dose in last 4 weeks | V1 | −0.047 | 0.80 |
| V2 | 0.079 | 0.09 | ||
| V3 | 0.022 | 0.36 | ||
| Missed ≥ 2 ART doses in last 4 weeks | V1 | −0.013 | 0.65 | |
| V2 | 0.110 | 0.03 | ||
| V3 | 0.052 | 0.20 | ||
| Missed ≥ 2 consecutive ART doses in last 4 weeks | V1 | −0.007 | 0.60 | |
| V2 | 0.180 | < 0.001 | ||
| V3 | 0.058 | 0.17 | ||
| Self‐reported adherence and viral load | ||||
| Adherence questions and HIV RNA ≥ 1000 copies/ml | Missed ≥ 1 ART dose in last 4 weeks | V1–3 | 0.002 | 0.48 |
| Missed ≥ 2 ART doses in last 4 weeks | V1–3 | 0.010 | 0.37 | |
| Missed ≥ 2 consecutive ART doses in last 4 weeks | V1–3 | −0.061 | 0.73 | |
| Viral load and therapeutic drug monitoring | ||||
| HIV RNA ≥ 1000 copies/ml and subtherapeutic drug concentrations* | V1 | 0.385 | < 0.0001 | |
| V2 | 0.251 | < 0.0001 | ||
| V3 | 0.359 | < 0.0001 | ||
| V1–V3 | 0.329 | < 0.0001 | ||
ART, antiretroviral therapy; V1, visit 1; V2, visit 2; V3, visit 3. *< 2.5th percentile of published population‐based pharmacokinetic models.
Discussion
Interventional studies with the goal to specifically improve adherence in HIV‐infected patients in low‐income countries are rare 11, 12. Our intervention aimed to enhance health care providers’ ability to encourage HIV‐infected patients to talk about adherence problems, which is a unique approach for sub‐Saharan Africa. We demonstrated that “patient‐centred” communication can be taught within a limited period of time without the need for a month‐long run‐in phase as proposed by other authors 27, 31, 32, 46, 47, and substantially contributed to improving adherence assessment in a rural HIV clinic in Tanzania. Remarkably, the adherence and virological response rate, which was greater than 90% in our selected study population on ART at the beginning of the study, was excellent.
As an objective method to measure adherence, we used TDM of ART compounds, because self‐reported adherence assessment is frequently inaccurate when not properly performed, with the consequence of missing patients with nonadherence. The value of TDM in assessing mainly short‐term adherence has been shown in various studies 48, 49, 50, 51, 52. The high adherence rate in our study using this measurement contrasts with other studies from sub‐Saharan Africa 6, 7, 8, 9, in which the adherence rate, mainly assessed using patients’ self‐reported adherence, was found to be on average only 70%. Possible explanations for the high adherence rate in our study include a survivor treatment bias in our selected study population and the well‐organized and well‐staffed CDCI.
The low virological failure rate of only 7.7% at baseline using the HIV RNA cut‐off of ≥ 1000 copies/ml proposed by WHO is in line with multiple studies indicating that HIV infection can be very effectively treated in resource‐limited countries 53, 54, 55. With a lower cut‐off of ≥ 500 copies/ml, the failure rate was similar (9.1%; data not shown).
Assessment of self‐reported adherence revealed that only a small minority of the patients (3.3%) disclosed any adherence problems to the physicians at baseline, compared with a nonadherence rate of 6.9% as measured by TDM. The results of our study indicate that a patient‐centred communication approach has a significant impact on the ability of the health care provider to elicit patients’ reports of nonadherence (3‐fold increase in self‐reports of nonadherence at visit 2). However, the effect of the communication training seemed to decline over time, as measured after 6–9 months, although the significance depended on the cut‐off used to define nonadherence.
Adherence assessment, which is the first, fundamental step towards improving adherence, is challenging and may be inaccurate 56, 57, 58. Studies mainly from high‐income countries have shown that patient‐centred communication improves adherence and outcome by establishing a trusting and respectful patient−health care provider relationship 28, 29, 30, 59. In sub‐Saharan Africa, doctor‐centred concepts are still more commonly used. However, interpersonal interactions with health care providers are of central importance across different cultural settings, including African countries 31, 60, 61, suggesting that a patient‐centred approach is also likely to improve the quality of health care in resource‐limited countries.
No clear impact of our intervention on patients’ adherence assessed using TDM and virological response rate over time was shown. This may be explained by our sample size, which was too small in the setting of unexpectedly high baseline adherence and virological suppression rate. The target population of our study was patients on ART for ≥ 6 months (median 3.5 years), and therefore a survivor treatment bias could have led to selection of the most adherent patients. We tried to minimize the selection bias by enrolling all consecutive HIV‐infected patients presenting at the HIV‐clinic fulfilling the inclusion criteria. In addition, viral load results were not available during the study in a timely fashion for logistical reasons, impeding the ability of physicians to adapt ART appropriately in the case of virological failure.
Interestingly, we noted a significant decrease in the number of patients with immunological failure and an increase in the median CD4 cell count over time. Furthermore, although it was not significant, there was a trend towards higher drug concentrations in the subgroup of patients treated with efavirenz, the most commonly prescribed ART drug.
Further limitations include the following. (1) Our study was designed without a control group, that is, patients treated by health care providers not trained in basic communication skills. A control group was not included in view of ethical considerations and the risk of a contamination bias in a clinic where all health care providers work closely together. To minimize a potential Hawthorne effect, we compared self‐reported adherence at post‐intervention visits with that at the baseline visit before the intervention. (2) ART drug concentration measurements were compared with published mixed‐population based pharmacokinetic models (mainly for Caucasians), which could have influenced the interpretation of drug concentrations in an exclusively African population. However, our cut‐off (< 2.5th percentile) was set at a very low level which probably allowed discrimination between patients with good and those with insufficient ART intake. (3) Test agreement between adherence assessed using the questionnaire and subtherapeutic ART drug concentration measurements was rather low, which suggests that self‐reports of adherence might frequently be inaccurate. This is in line with the recent FEM‐PrEP study 62, in which rates of reports of nonadherence were very low compared with drug concentration measurements in an African setting. It is noteworthy that the inter‐test agreement in our study was best after the communication training at visit 2, supporting the conclusion that the effect of the communication training increased the validity of self‐reports.
Our study also has several strengths. (1) Our study was prospective with a unique intervention targeting the important issue of adherence in a rural sub‐Saharan African clinic. (2) Our intervention was intentionally kept simple and consisted of a short course of communication training and an easy‐to‐apply adherence assessment reminder checklist, making such an intervention feasible and appealing for use in other resource‐limited countries. (3) We used examiner‐independent TDM, which allowed a more reliable estimation of adherence.
In conclusion, our study results indicate that a simple intervention with a short course of training in basic patient‐centred communication for health care providers is successfully applicable in rural sub‐Saharan Africa and has significant benefits in empowering HIV‐infected patients to talk about their adherence problems. However, the findings suggest that health care providers need to be repeatedly trained in view of a loss of the training effect over time. This may be achieved, for example, by online teaching or repeated short training sessions delivered by dedicated local staff 47, 63, 64.
With the aim of achieving the goal of the “90‐90‐90” Joint United Nations Programme on HIV/AIDS (UNAIDS) to significantly reduce the HIV epidemic, ART coverage is to be scaled up rapidly in the near future 65, with more than 20 million HIV‐infected patients to be started on ART until 2020, most of them living in sub‐Saharan Africa. Efforts and interventions to improve and maintain patients’ adherence, which is critical for the success of scaling up ART, have to be reinforced. Implementing patient‐centred communication, as shown in our study, may contribute to the achievement of better adherence in resource‐limited countries.
Authors' contributions
M.B. contributed to the conception and design of the study, analysed and interpreted the data and contributed to writing the manuscript. S.E. contributed to the conception and design of the study, conducted the project onsite, collected, analysed and interpreted the data, and wrote the first draft of the manuscript. W.L. was responsible for the communication training onsite. E.L. contributed to the conduct of the study onsite, the analysis and interpretation of the data, and writing of the manuscript. T.R.G. performed all statistical analyses and contributed to the interpretation of the data. J.N., D.M. and L.M. performed the laboratory analyses onsite, including viral load and CD4 cell count measurements. H.M. contributed to the conduct of the project onsite. M.H., U.D. and B.B. performed and analysed all drug concentration measurements. J.B. and T.K. performed and analysed viral load measurements in Switzerland. C.M. contributed to the analyisis and intepretation of the data. L.E. contributed to the conception and design of the study. All authors contributed to development of the manuscript and have reviewed the final manuscript.
Supporting information
Fig. S1. Use of a blackboard during the communication training. The image shows four examples of health care provider strategies to convince a patient to start antiretroviral therapy (ART), written on a blackboard.
Fig. S2. Adherence assessment checklist.
Acknowledgements
We thank Beatrice Vetter, laboratory technician at the Division of Clinical Pharmacology and Toxicology, University Hospital Basel, Basel, Switzerland for performing all the drug concentration measurements.
Conflicts of interest: There are no conflicts of interest to report.
Funding: This work was supported by grants from the Swiss Tropical and Public Health Institute Basel, Basel, Switzerland; Gottfried‐Bangerter Stiftung, Basel, Switzerland; Freiwillige Akademische Gesellschaft FAG, Basel, Switzerland; OPO‐Stiftung, Zürich, Switzerland; Stiftung Forschung Infektionskrankheiten SFI, Basel, Switzerland; Gilead Sciences Europe Ltd, Abbvie, Switzerland and Böhringer Ingelheim, Basel, Switzerland.
The Kilombero and Ulanga Antiretroviral Cohort (KIULARCO) study group
Aschola Asantiel, Manuel Battegay, Adolphina Chale, Diana Faini, Ingrid Felger, Gideon Francis, Hansjakob Furrer, Anna Gamell, Tracy Glass, Christoph Hatz, Speciosa Hatz, Bryson Kasuga, Aneth V Kalinjuma, Namvua Kimera, Yassin Kisunga, Thomas Klimkait, Emilio Letang, Antonia Luhombero, Lameck B Luwanda Herry Mapesi, Leticia Mbwile, Mengi Mkulila, Julius Mkumbo, Margareth Mkusa, Dorcas K Mnzava, Germana Mossad, Dolores Mpundunga, Daimon Msami, Athumani Mtandanguo, Kim D Mwamelo, Selerine Myeya, Sanula Nahota, Regina Ndaki, Agatha Ngulukila, Alex John Ntamatungiro, Leila Samson, George Sikalengo, Marcel Tanner and Fiona Vanobberghen.
References
- 1. Bangsberg DR, Perry S, Charlebois ED et al Non‐adherence to highly active antiretroviral therapy predicts progression to AIDS. AIDS 2001; 15: 1181–1183. [DOI] [PubMed] [Google Scholar]
- 2. Nachega JB, Hislop M, Dowdy DW, Chaisson RE, Regensberg L, Maartens G. Adherence to nonnucleoside reverse transcriptase inhibitor‐based HIV therapy and virologic outcomes. Ann Intern Med 2007; 146: 564–573. [DOI] [PubMed] [Google Scholar]
- 3. Paterson DL, Swindells S, Mohr J et al Adherence to protease inhibitor therapy and outcomes in patients with HIV infection. Ann Intern Med 2000; 133: 21–30. [DOI] [PubMed] [Google Scholar]
- 4. Glass TR, Sterne JA, Schneider MP et al Self‐reported nonadherence to antiretroviral therapy as a predictor of viral failure and mortality. AIDS 2015; 29: 2195–2200. [DOI] [PubMed] [Google Scholar]
- 5. Lima VD, Harrigan R, Bangsberg DR et al The combined effect of modern highly active antiretroviral therapy regimens and adherence on mortality over time. J Acquir Immune Defic Syndr 2009; 50: 529–536. [DOI] [PMC free article] [PubMed] [Google Scholar]
- 6. Mills EJ, Nachega JB, Buchan I et al Adherence to antiretroviral therapy in sub‐Saharan Africa and North America: a meta‐analysis. JAMA 2006; 296: 679–690. [DOI] [PubMed] [Google Scholar]
- 7. Ortego C, Huedo‐Medina TB, Llorca J et al Adherence to highly active antiretroviral therapy (HAART): a meta‐analysis. AIDS Behav 2011; 15: 1381–1396. [DOI] [PubMed] [Google Scholar]
- 8. Bezabhe WM, Chalmers L, Bereznicki LR, Peterson GM. Adherence to Antiretroviral Therapy and Virologic Failure: a Meta‐Analysis. Medicine (Baltimore) 2016; 95: e3361. [DOI] [PMC free article] [PubMed] [Google Scholar]
- 9. Mills EJ, Nachega JB, Bangsberg DR et al Adherence to HAART: a systematic review of developed and developing nation patient‐reported barriers and facilitators. PLoS Med 2006; 3: e438. [DOI] [PMC free article] [PubMed] [Google Scholar]
- 10. WHO . Guideline on When to Start Antiretroviral Therapy and On Pre‐Exposure Prophylaxis for HIV. Geneva, WHO Library, 2015. [PubMed] [Google Scholar]
- 11. Chaiyachati KH, Ogbuoji O, Price M, Suthar AB, Negussie EK, Barnighausen T. Interventions to improve adherence to antiretroviral therapy: a rapid systematic review. AIDS 2014; 28 (Suppl 2): S187–S204. [DOI] [PubMed] [Google Scholar]
- 12. Barnighausen T, Chaiyachati K, Chimbindi N, Peoples A, Haberer J, Newell ML. Interventions to increase antiretroviral adherence in sub‐Saharan Africa: a systematic review of evaluation studies. Lancet Infect Dis 2011; 11: 942–951. [DOI] [PMC free article] [PubMed] [Google Scholar]
- 13. Simoni JM, Pearson CR, Pantalone DW, Marks G, Crepaz N. Efficacy of interventions in improving highly active antiretroviral therapy adherence and HIV‐1 RNA viral load. A meta‐analytic review of randomized controlled trials. J Acquir Immune Defic Syndr 2006; 43 (Suppl 1): S23–S35. [DOI] [PMC free article] [PubMed] [Google Scholar]
- 14. Ford N, Nachega JB, Engel ME, Mills EJ. Directly observed antiretroviral therapy: a systematic review and meta‐analysis of randomised clinical trials. Lancet 2009; 374: 2064–2071. [DOI] [PubMed] [Google Scholar]
- 15. Rueda S, Park‐Wyllie LY, Bayoumi AM et al Patient support and education for promoting adherence to highly active antiretroviral therapy for HIV/AIDS. Cochrane Database Syst Rev 2006. (3): CD001442. [DOI] [PMC free article] [PubMed] [Google Scholar]
- 16. Chesney MA. The elusive gold standard. Future perspectives for HIV adherence assessment and intervention. J Acquir Immune Defic Syndr 2006; 43 (Suppl 1): S149–S155. [DOI] [PubMed] [Google Scholar]
- 17. Nieuwkerk PT, Oort FJ. Self‐reported adherence to antiretroviral therapy for HIV‐1 infection and virologic treatment response: a meta‐analysis. J Acquir Immune Defic Syndr 2005; 38: 445–448. [DOI] [PubMed] [Google Scholar]
- 18. Glass T, Cavassini M. Asking about adherence ‐ from flipping the coin to strong evidence. Swiss Med Wkly 2014; 144: w14016. [DOI] [PubMed] [Google Scholar]
- 19. Pearson CR, Simoni JM, Hoff P, Kurth AE, Martin DP. Assessing antiretroviral adherence via electronic drug monitoring and self‐report: an examination of key methodological issues. AIDS Behav 2007; 11: 161–173. [DOI] [PMC free article] [PubMed] [Google Scholar]
- 20. Nieuwkerk PT, de Boer‐van der Kolk IM, Prins JM, Locadia M, Sprangers MA. Self‐reported adherence is more predictive of virological treatment response among patients with a lower tendency towards socially desirable responding. Antivir Ther 2010;15:913–916. [DOI] [PubMed] [Google Scholar]
- 21. Bangsberg DR. Less than 95% adherence to nonnucleoside reverse‐transcriptase inhibitor therapy can lead to viral suppression. Clin Infect Dis 2006; 43: 939–941. [DOI] [PubMed] [Google Scholar]
- 22. Schneider J, Kaplan SH, Greenfield S, Li W, Wilson IB. Better physician‐patient relationships are associated with higher reported adherence to antiretroviral therapy in patients with HIV infection. J Gen Intern Med 2004; 19: 1096–1103. [DOI] [PMC free article] [PubMed] [Google Scholar]
- 23. Williams AB, Amico KR, Bova C, Womack JA. A proposal for quality standards for measuring medication adherence in research. AIDS Behav 2013; 17: 284–297. [DOI] [PMC free article] [PubMed] [Google Scholar]
- 24. Altice FL, Mostashari F, Friedland GH. Trust and the acceptance of and adherence to antiretroviral therapy. J Acquir Immune Defic Syndr 2001; 28: 47–58. [DOI] [PubMed] [Google Scholar]
- 25. Mostashari F, Riley E, Selwyn PA, Altice FL. Acceptance and adherence with antiretroviral therapy among HIV‐infected women in a correctional facility. J Acquir Immune Defic Syndr Hum Retrovirol 1998; 18: 341–348. [DOI] [PubMed] [Google Scholar]
- 26. Stone VE, Clarke J, Lovell J et al HIV/AIDS patients’ perspectives on adhering to regimens containing protease inhibitors. J Gen Intern Med 1998; 13: 586–593. [DOI] [PMC free article] [PubMed] [Google Scholar]
- 27. Epstein R, Street RJ. Patient‐centered communication in cancer care: promoting healing and reducing suffering. NIH publication 2007; No. 07‐6225.
- 28. Flickinger TE, Saha S, Roter D et al Respecting patients is associated with more patient‐centered communication behaviors in clinical encounters. Patient Educ Couns 2016; 99: 250–255. [DOI] [PMC free article] [PubMed] [Google Scholar]
- 29. Flickinger TE, Saha S, Moore RD, Beach MC. Higher quality communication and relationships are associated with improved patient engagement in HIV care. J Acquir Immune Defic Syndr 2013; 63: 362–366. [DOI] [PMC free article] [PubMed] [Google Scholar]
- 30. Beach MC, Keruly J, Moore RD. Is the quality of the patient‐provider relationship associated with better adherence and health outcomes for patients with HIV? J Gen Intern Med 2006; 21: 661–665. [DOI] [PMC free article] [PubMed] [Google Scholar]
- 31. Nayiga S, DiLiberto D, Taaka L et al Strengthening patient‐centred communication in rural Ugandan health centres: A theory‐driven evaluation within a cluster randomized trial. Evaluation (Lond) 2014; 20: 471–491. [DOI] [PMC free article] [PubMed] [Google Scholar]
- 32. Mead N, Bower P. Patient‐centredness: a conceptual framework and review of the empirical literature. Soc Sci Med 2000; 51: 1087–1110. [DOI] [PubMed] [Google Scholar]
- 33. Rollnick S, Butler CC, Kinnersley P, Gregory J, Mash B. Motivational interviewing. BMJ 2010; 340: c1900. [DOI] [PubMed] [Google Scholar]
- 34. Miller ST, Beech BM. Rural healthcare providers question the practicality of motivational interviewing and report varied physical activity counseling experience. Patient Educ Couns 2009; 76: 279–282. [DOI] [PMC free article] [PubMed] [Google Scholar]
- 35. Miller WR, Rose GS. Toward a theory of motivational interviewing. Am Psychol 2009; 64: 527–537. [DOI] [PMC free article] [PubMed] [Google Scholar]
- 36. Langewitz W, Heydrich L, Nubling M, Szirt L, Weber H, Grossman P. Swiss Cancer League communication skills training programme for oncology nurses: an evaluation. J Adv Nurs 2010; 66: 2266–2277. [DOI] [PubMed] [Google Scholar]
- 37. EACS . European AIDS clinical society: EACS guidelines 6.1. EACS Guidelines 61, European AIDS Clinical Society, 2011.
- 38. Glass TR, De Geest S, Weber R et al Correlates of self‐reported nonadherence to antiretroviral therapy in HIV‐infected patients: the Swiss HIV Cohort Study. J Acquir Immune Defic Syndr 2006; 41: 385–392. [DOI] [PubMed] [Google Scholar]
- 39. Glass TR, De Geest S, Hirschel B et al Self‐reported non‐adherence to antiretroviral therapy repeatedly assessed by two questions predicts treatment failure in virologically suppressed patients. Antivir Ther 2008; 13: 77–85. [PubMed] [Google Scholar]
- 40. Masimba P, Kituma E, Klimkait T et al Prevalence of drug resistance mutations and HIV type 1 subtypes in an HIV type 1‐infected cohort in rural Tanzania. AIDS Res Hum Retroviruses 2013; 29: 1229–1236. [DOI] [PMC free article] [PubMed] [Google Scholar]
- 41. Csajka C, Marzolini C, Fattinger K et al Population pharmacokinetics and effects of efavirenz in patients with human immunodeficiency virus infection. Clin Pharmacol Ther 2003; 73: 20–30. [DOI] [PubMed] [Google Scholar]
- 42. Guidi M, Arab‐Alameddine M, Rotger M et al Dosage optimization of treatments using population pharmacokinetic modeling and simulation. Chimia 2012; 66: 291–295. [DOI] [PubMed] [Google Scholar]
- 43. Lubomirov R, di Iulio J, Fayet A et al ADME pharmacogenetics: investigation of the pharmacokinetics of the antiretroviral agent lopinavir coformulated with ritonavir. Pharmacogenet Genomics 2010; 20: 217–230. [DOI] [PubMed] [Google Scholar]
- 44. Colombo S, Buclin T, Cavassini M et al Population pharmacokinetics of atazanavir in patients with human immunodeficiency virus infection. Antimicrob Agents Chemother 2006; 50: 3801–3808. [DOI] [PMC free article] [PubMed] [Google Scholar]
- 45. WHO . Consolidated Guidelines on HIV Prevention, Diagnosis, Treatment and Care for Key Populations. Geneva, WHO Library, 2014. [PubMed] [Google Scholar]
- 46. Haaland A, Molyneux S. Quality information in field research: Training manual on practical communication skills for field researchers and project personnel. Geneva, Special Programme for Research and Training in Tropical Diseases (TDR) World Health Organization, 2006.
- 47. Penn C, Watermeyer J, Evans M. Why don't patients take their drugs? The role of communication, context and culture in patient adherence and the work of the pharmacist in HIV/AIDS. Patient Educ Couns 2011; 83: 310–318. [DOI] [PubMed] [Google Scholar]
- 48. Thompson MA, Mugavero MJ, Amico KR et al Guidelines for improving entry into and retention in care and antiretroviral adherence for persons with HIV: evidence‐based recommendations from an International Association of Physicians in AIDS Care panel. Ann Intern Med 2012; 156: 817–833. [DOI] [PMC free article] [PubMed] [Google Scholar]
- 49. Murri R, Ammassari A, Gallicano K et al Patient‐reported nonadherence to HAART is related to protease inhibitor levels. J Acquir Immune Defic Syndr 2000; 24: 123–128. [DOI] [PubMed] [Google Scholar]
- 50. Hugen PW, Langebeek N, Burger DM et al Assessment of adherence to HIV protease inhibitors: comparison and combination of various methods, including MEMS (electronic monitoring), patient and nurse report, and therapeutic drug monitoring. J Acquir Immune Defic Syndr 2002; 30: 324–334. [DOI] [PubMed] [Google Scholar]
- 51. Liechty CA, Alexander CS, Harrigan PR et al Are untimed antiretroviral drug levels useful predictors of adherence behavior? AIDS 2004; 18: 127–129. [DOI] [PubMed] [Google Scholar]
- 52. Yasuda JM, Miller C, Currier JS et al The correlation between plasma concentrations of protease inhibitors, medication adherence and virological outcome in HIV‐infected patients. Antivir Ther 2004; 9: 753–761. [PubMed] [Google Scholar]
- 53. McMahon JH, Elliott JH, Bertagnolio S, Kubiak R, Jordan MR. Viral suppression after 12 months of antiretroviral therapy in low‐ and middle‐income countries: a systematic review. Bull World Health Organ 2013; 91: 377–385E. [DOI] [PMC free article] [PubMed] [Google Scholar]
- 54. Ivers LC, Kendrick D, Doucette K. Efficacy of antiretroviral therapy programs in resource‐poor settings: a meta‐analysis of the published literature. Clin Infect Dis 2005; 41: 217–224. [DOI] [PubMed] [Google Scholar]
- 55. Djomand G, Roels T, Ellerbrock T et al Virologic and immunologic outcomes and programmatic challenges of an antiretroviral treatment pilot project in Abidjan, Cote d'Ivoire. AIDS 2003; 17 (Suppl 3): S5–S15. [DOI] [PubMed] [Google Scholar]
- 56. Ahoua L, Guenther G, Rouzioux C et al Immunovirological response to combined antiretroviral therapy and drug resistance patterns in children: 1‐ and 2‐year outcomes in rural Uganda. BMC Pediatr 2011; 11: 67. [DOI] [PMC free article] [PubMed] [Google Scholar]
- 57. Olds PK, Kiwanuka JP, Nansera D et al Assessment of HIV antiretroviral therapy adherence by measuring drug concentrations in hair among children in rural Uganda. AIDS Care 2015; 27: 327–332. [DOI] [PMC free article] [PubMed] [Google Scholar]
- 58. Arnsten JH, Demas PA, Farzadegan H et al Antiretroviral therapy adherence and viral suppression in HIV‐infected drug users: comparison of self‐report and electronic monitoring. Clin Infect Dis 2001; 33: 1417–1423. [DOI] [PMC free article] [PubMed] [Google Scholar]
- 59. Arbuthnott A, Sharpe D. The effect of physician‐patient collaboration on patient adherence in non‐psychiatric medicine. Patient Educ Couns 2009; 77: 60–67. [DOI] [PubMed] [Google Scholar]
- 60. Chandler CI, Kizito J, Taaka L et al Aspirations for quality health care in Uganda: how do we get there? Hum Resour Health 2013; 11: 13. [DOI] [PMC free article] [PubMed] [Google Scholar]
- 61. Kizito J, Kayendeke M, Nabirye C, Staedke SG, Chandler CI. Improving access to health care for malaria in Africa: a review of literature on what attracts patients. Malar J 2012; 11: 55. [DOI] [PMC free article] [PubMed] [Google Scholar]
- 62. Van Damme L, Corneli A, Ahmed K et al Preexposure prophylaxis for HIV infection among African women. N Engl J Med 2012; 367: 411–422. [DOI] [PMC free article] [PubMed] [Google Scholar]
- 63. Ong LM, de Haes JC, Hoos AM, Lammes FB. Doctor‐patient communication: a review of the literature. Soc Sci Med 1995; 40: 903–918. [DOI] [PubMed] [Google Scholar]
- 64. Ellis C. Communicating with the African patient. Scottsville, University of KwaZulu‐Natal Press, 2004. [Google Scholar]
- 65. UNAIDS (ed.). 90‐90‐90 An Ambitious Treatment Target to Help End the AIDS Epidemic. In: UNAIDS , ed. Geneva, Switzerland, Joint United Nations Programme on HIV/AIDS (UNAIDS), 2014. [Google Scholar]
Associated Data
This section collects any data citations, data availability statements, or supplementary materials included in this article.
Supplementary Materials
Fig. S1. Use of a blackboard during the communication training. The image shows four examples of health care provider strategies to convince a patient to start antiretroviral therapy (ART), written on a blackboard.
Fig. S2. Adherence assessment checklist.