Abstract
Purpose:
Silent magnetic resonance imaging (MRI) scans produce reduced acoustic noise and are considered more gentle for sedated children. The aim of this study was to compare the validity of T1- (T1W) and T2-weighted (T2W) silent sequences for myelination assessment in children with conventional spin-echo sequences.
Materials and Methods:
A total of 30 children (21 boys, 9 girls; age range: 1–83 months, mean age: 35.5 months, median age: 28.5 months) were examined using both silent and spin-echo sequences. Acoustic noise levels were analyzed and compared. The degree of myelination was qualitatively assessed via consensus, and T1W and T2W signal intensities were quantitatively measured by percent contrast.
Results:
Acoustic noise levels were significantly lower during silent sequences than during conventional sequences (P < 0.0001 for both T1W and T2W). Inter-method comparison indicated overall good to excellent agreement (T1W and T2W images, κ = 0.76 and 0.80, respectively); however, agreement was poor for cerebellar myelination on T1W images (κ = 0.14). The percent contrast of silent and conventional MRI sequences had a strong correlation (T1W, correlation coefficient [CC] = 0.76; T1W excluding the middle cerebellar peduncle, CC = 0.82; T2W, CC = 0.91).
Conclusions:
For brain MRI, silent sequences significantly reduced acoustic noise and provided diagnostic image quality for myelination evaluations; however, the two methods differed with respect to cerebellar delineation on T1W sequences.
Keywords: silent sequence, myelination, acoustic noise
Introduction
During acquisition scans, magnetic resonance imaging (MRI) generates a high level of acoustic noise as a result of rapid current alterations within the gradient coils. This noise is stressful for patients, particularly children,1 most of whom must be sedated to obtain good images.2 Unfortunately, the noise often wakes sedated children, leading to suspended examinations and additional sedatives. Additionally, some adults, including those with hearing apparatus or inner ear disorders, depression, or autism, have hyperacusis and are sensitive to acoustic noise.
Some methods for reducing acoustic noise have been introduced and are used clinically. From the side of hardware enclosing the whole gradient coil in a vacuum chamber or the use of buffer materials avoids the vibration transmission and reduced the noise. They can be used for all imaging sequences but increased manufacturing cost.3 From the side of MR sequences to use the lower gradient amplitude and slew rates of the gradient waves reduce the vibration of the gradient coils and lower an acoustic noise.4 However, long gradient application time is a problem, and it cannot be used for some sequences, which need a rapid switching of magnetic field gradient. Pierre et al. have reported that optimizing the gradient waveforms with a 10% increase in bandwidth in turbo spin-echo sequence achieved an 11 dB sound pressure level reduction with no statistically significant difference in image quality.3
The recently introduced silent MRI technique dramatically reduces acoustic noise by employing fewer changes in gradient excitation levels. T1-weighted (T1W) images are based on a three-dimensional (3D) gradient-echo imaging technique with a very short TE and an inversion preparation pulse,5,6 and T2-weighted (T2W) images use 2D periodically-rotated overlapping parallel lines with enhanced reconstruction (PROPELLER) acquisition.7 They use radial center-out sampling scheme.5,7
These silent methods are therefore beneficial not only for patients, their doctors, and technicians, but also for an increasing number of researchers involved in functional MRI studies of brain activation because reduced noise facilitates communication during scans.1
However, to avoid compromising image quality for patient comfort, we must confirm the equivalence or superiority of silent MRI through comparisons with the conventional technique, similar to comparisons previously used to validate newly introduced MRI sequences such as fast spin echo (FSE), fluid-attenuated inversion recovery, and turbo inversion recovery spin echo.8–11 Accordingly, the present study aimed to compare T1W and T2W silent and conventional spin-echo MRI sequences, thus evaluating the efficacy of this new method for myelination signal assessment in children.
Materials and Methods
Imaging methods
MRI scans were performed on a 3T MRI system (Discovery MR750W; General Electric Healthcare, Milwaukee, WI, USA) using a 24-channel-head coil with T1W silent, T2W silent (PROPELLER), T2W FSE and T1W spin-echo (SE) sequences in that order. T1W silent is based on a 3D gradient-echo imaging technique with a very short TE and low flip angles,12 which uses a 3D radial center-out sampling scheme where the endpoints of each spoke follow a spiral path in time. An inversion preparation pulse is used to generate T1 contrast.
We compared T1W images produced using different techniques: gradient and spin-echo sequences, because the T1W silent sequence used in our study was not similar to any sequence with a normal acoustic noise level. Therefore, we adopted a standard spin-echo sequence, which has been widely used for myelination evaluation as a reference. When an examination was difficult to continue, for example, the patient woke up or the patient’s condition got worse during conventional sequences, we did not proceed with the rest of the sequences.
Three-dimensional data were acquired in the sagittal plane during the T1W silent sequence and reconstructed as an axial-plane image. The sequence parameters are shown in Table 1. An interleaved acquisition was used for the T1W SE images. We used different parameters in patients aged 44 weeks or younger to optimize the signal-to-noise ratio and contrast for the water-rich neonatal brain as we routinely and clinically do.
Table 1.
Sequence parameters
| Corrected ages (weeks) | Sequence | Imaging plane | ST (mm) | TR (ms) | TE (ms) | FOV (cm) | NEX | Matrix | Time (min:s) |
|---|---|---|---|---|---|---|---|---|---|
| >44 | Silent T1W | sagittal | 1 | 880 | 1.600E−2 | 24 | 1 | 240*240 | 5:10 |
| Silent T2W | axial | 5 | 5700 | 105–109 | 22 | 1 | 320*320 | 2:13 | |
| SE T1W | axial | 4–5 | 500 | 10 | 22 | 1 | 256*224 | 3:16 | |
| FSE T2W | coronal | 3 | 6500 | 100–102 | 22 | 1 | 512*320 | 3:09 | |
| <44 | Silent T1W | sagittal | 0.8 | 911 | 1.600E−2 | 20 | 1 | 250*250 | 5:45 |
| Silent T2W | axial | 4–5 | 7600–8000 | 109–142 | 18–22 | 1 | 320*320 | 2:32 | |
| SE T1W | axial | 4 | 500 | 10 | 18–20 | 1 | 256*256 | 3:42 | |
| FSE T2W | coronal | 3–4 | 5800–7000 | 102–128 | 18–20 | 1 | 512*320 | 2:55 |
ST, slice thickness; TR, repetition time; TE, echo time; FOV, field of view; NEX, number of excitations; T1W, T1-weighted; T2W, T2-weighted.
Subjects
We used a prospective within-subject study design. All children aged ≤83 months who underwent routine brain MRI with silent MR system from January to September 2014 were included in this study. We decided the patient age limit because myelination is expected to have been completed by the age of 83 months, and older children are often able to bear the loud acoustic noise during conventional MR scanning. MRI was indicated for epilepsy, convulsion, cerebral palsy, low birth weight, short stature, neurologic manifestation, autism, megalencephaly, ventricular distention, etc. During the scans, most patients received a sedation agent such as oral triclofos sodium, intravenous thiopental, or intravenous midazolam.
A total of 135 children aged ≤83 months underwent brain MRI studies from January to September 2014. We excluded 111 patients from T1W image study: 106 because of a lack of required sequences, 4 because they had so diffuse pathological findings that we could not pick up sites for a proper myelination assessment, and 1 because of delayed myelination. Similarly, we excluded 110 patients from the T2W image study: 95 because of a lack of required sequences, 13 because of pathological findings on MRI, one because of delayed myelination, and one because of severe motion artifacts.
Consequently, we acquired both T1W silent and SE sequences from 24 of the 135 children, and both T2W silent and FSE sequences from 25 children, without pathological findings or severe motion artifacts on MRI that would preclude a proper myelination assessment. As we could acquire all four sequences (T1W silent, T2W silent, T2W FSE and T1W SE sequences) from 19 patients, 30 patients (21 boys, 9 girls; age range: 1–83 months; mean age, 35.5 months; median, 28.5 months) were selected for the subjective image analysis. The patients’ age intervals were as follows: 0–3 months, 5 patients; 4–12 months, 5 patients; 13–24 months, 4 patients; 25–36 months, 2 patients; 37–48 months, 1 patient; 49–66 months, 7 patients; 67–83 months, 6 patients. In cases of preterm birth, the patients’ ages were corrected for prematurity.
From the objective image analysis, we excluded a 71-month-old girl from the T1W image group and a 1-month-old boy from the T2W image group because of moderate motion artifacts that did not allow proper ROI assessments. In the subjective image analysis, we included these two children because we could apply a comparative assessment visually with the adjacent gray matter.
All aspects of this prospective study were approved by the ethics review board at our institution, and written informed consent was obtained from the parents of all subjects.
Acoustic noise measurement
The acoustic noise levels were measured 10 times for each sequence, using a sound level meter (NL-18; RION CO., LTD., Tokyo, Japan) and a microphone. The microphone was placed at a distance of 2 meters from the front panel of the unit. We measured the background noise level (i.e. the noise level in the scanner room without any active scanning) 10 times before measuring the noise levels for each sequence.
Subjective image analysis
We designated seven anatomical locations of the brain for evaluation: (1) the anterior temporal subcortical white matter, (2) middle cerebellar peduncle, (3) posterior limb of the internal capsule, (4) genu and (5) splenium of the corpus callosum, and the (6) anterior frontal and (7) posterior occipital subcortical white matter at the level of the foramen of Monro. We initially selected the right hemisphere for evaluation, but if abnormal findings were observed on the right side, we evaluated the left side. If abnormal findings were observed on both sides, we excluded that location from evaluation.
The signal intensities of these regions were compared visually with the adjacent gray matter. The images obtained from conventional SE and silent sequences were analyzed independently. On T1W images, each region was graded according to a four-point scale: hypointense, 0; isointense, 1; slightly hyperintense, 2; and hyperintense, 3. On T2W images, each region was graded as follows: hypointense, 0; slightly hypointense, 1; isointense, 2; hyperintense, 3.
We also graded the motion artifacts. The four-point scale was as follows: unable to read, 0; very difficult to read, 1; able to read despite the artifacts, 2; no artifact, 3.
Subjective image assessments were conducted independently by two radiologists (with 6 and 20+ years of experience), and the final results were achieved by consensus.
Objective image analysis
We measured the T1W and T2W signal intensities by manually tracing oval regions of interest (ROI) in the following regions: centrum semiovale, genu of the corpus callosum, anterior frontal subcortical white matter, middle cerebellar peduncle and each adjacent gray matter region (Fig. 1). We also calculated the percent contrast using the following formula as described by Shaw et al.8:
where SI is the signal intensity.
Fig 1.
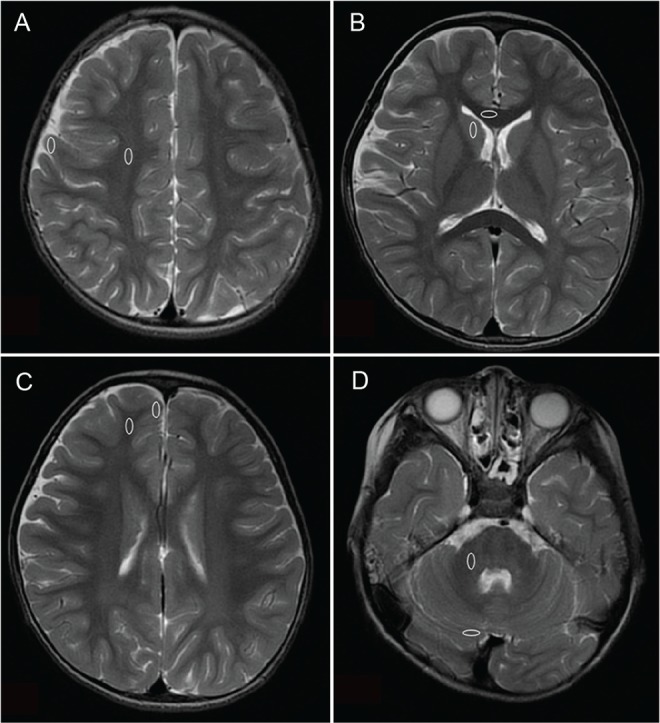
Four pairs of regions of the brain selected for objective comparison (ovals). (A) Centrum semiovale and the adjacent gray matter region. (B) Genu of the corpus callosum and the adjacent gray matter region. (C) Anterior frontal subcortical white matter and the adjacent gray matter region. (D) Middle cerebellar peduncle and the adjacent gray matter region.
As severe motion artifacts were observed at the level of the middle cerebellar peduncle on T1W SE image in a 1-month-old boy, we did not measure T1 values there. Overall, we had 91 and 96 evaluation points on T1W and T2W images, respectively.
These assessments were conducted by one radiologist.
Statistical analysis
An unpaired t-test was used for the statistical analysis of noise level differences. Inter-rater and inter-method (spin-echo and silent sequences) agreements in subjective assessment scoring were calculated using kappa coefficients. A paired t-test was used for the statistical analysis of motion artifacts. For the objective image analysis, Pearson’s product moment CCs were used to determine the correlation between silent and conventional MRI.
Results
Acoustic noise
The mean acoustic noise levels of each sequence and the differences compared to baseline levels are shown in Table 2. The acoustic noise levels of T1W silent and SE sequences were 0.25 dB and 29.74 dB higher than the baseline noise level, respectively. The noise of T2W silent and FSE sequences were 6.60 dB and 32.21 dB higher than the baseline noise level, respectively. In summary, the noise levels were significantly lower during silent sequences than during conventional sequences (P <0.0001 for both T1W and T2W sequences).
Table 2.
Mean noise levels of each sequence and the baseline
| Mean noise level ± SD (dB) | Baseline sound level ± SD (dB) | Difference ± SD (dB) | |
|---|---|---|---|
| T1W SE | 82.28 ± 0.77 | 52.54 ± 0.42 | 29.74 ± 0.98 |
| T1W silent | 52.62 ± 0.08 | 52.37 ± 0.10 | 0.25 ± 0.13 |
| T2W FSE | 84.56 ± 0.27 | 52.35 ± 0.11 | 32.21 ± 0.33 |
| T2W silent | 59.00 ± 0.22 | 52.40 ± 0.18 | 6.60 ± 0.32 |
SD, standard deviation; T1W, T1-weighted; T2W, T2-weighted.
Subjective image analysis
Kappa coefficients for the estimations of the inter-rater and inter-method agreements are shown in Table 3. Most kappa coefficients for the estimations of the inter-method agreements were good to excellent. The kappa coefficient for the posterior internal capsule on T1W images was undefined because both radiologists rated all cases as grade 3 (high intensity compared to adjacent gray matter). Representative images are shown in Figs. 2 and 3.
Table 3.
Kappa coefficients of agreement
| T1W | T2W | |||||
|---|---|---|---|---|---|---|
| Inter-rater | Inter-method | Inter-rater | Inter-method | |||
| SE | Silent | FSE | Silent | |||
| Anterior temporal SWM | 0.83 | 1.0 | 0.82 | 0.82 | 0.84 | 0.76 |
| MCP | 1.0 | −0.04 | 0.14 | 1.0 | 1.0 | 1.0 |
| Posterior internal capsule | NaN | NaN | NaN | 0.48 | 0.82 | 0.48 |
| Genu of CC | 0.72 | 0.88 | 1.0 | 1.0 | 0.64 | 0.73 |
| Splenium of CC | 0.77 | 0.67 | 0.67 | 1.0 | 0.64 | 0.82 |
| Anterior frontal SWM | 0.86 | 0.79 | 1.0 | 0.90 | 0.90 | 0.91 |
| Posterior occipital SWM | 0.90 | 0.90 | 1.0 | 1.0 | 1.0 | 0.70 |
| Total | 0.84 | 0.85 | 0.79 | 0.96 | 0.87 | 0.80 |
SWM, subcortical white matter; MCP, middle cerebellar peduncle; CC, corpus callosum; T1W, T1-weighted; T2W, T2-weighted; NaN, not a number.
Fig 2.
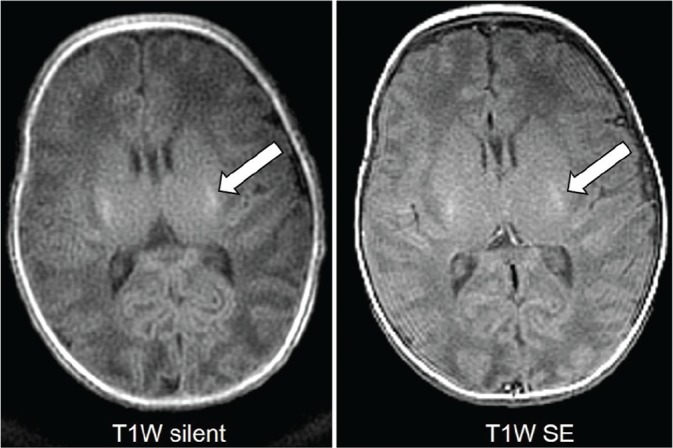
T1-weighted (T1W) images from a 1-month-old boy with respiratory distress syndrome showing high signal in the posterior limbs of the internal capsules on both sequences (arrows).
Fig 3.
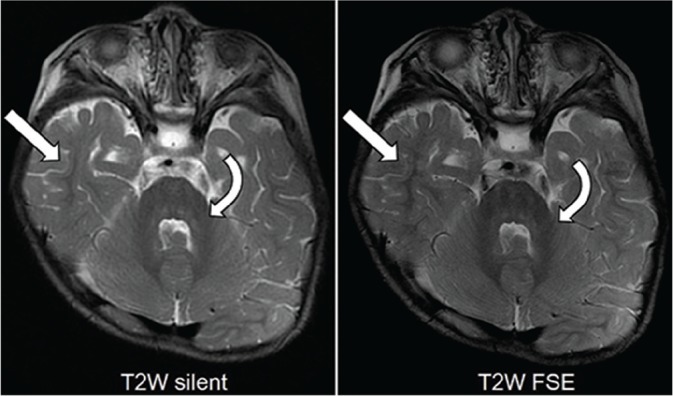
T2-weighted (T2W) images from an 18-month-old boy with achondroplasia demonstrating low-signal myelin in the middle cerebellar peduncles (curved arrows), deep cerebellar white matter, and extending into the temporal subcortical white matter (arrows).
When evaluating separate brain locations, the inter-method agreement on T1W images was poor in the middle cerebellar peduncles (MCPs). This mismatch was observed in 88% of patients aged 49 months or older (7/8) and 13% of patients aged 48 months or younger (2/16). Representative T1W images at the level of the MCP are shown in Fig. 4.
Fig 4.
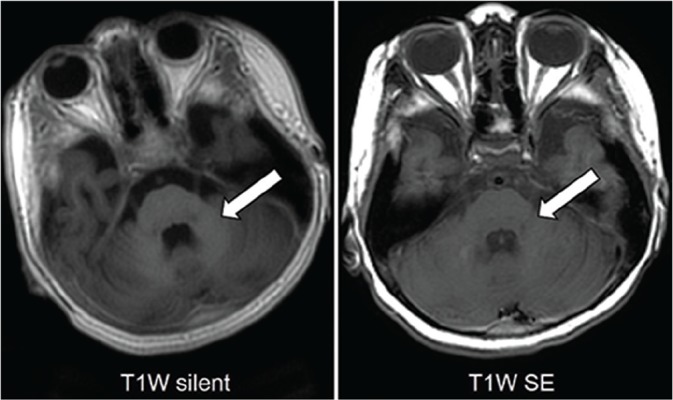
T1W images of a 5-year-old girl with intractable epilepsy at the level of the middle cerebellar peduncle. The high-signal myelin in the middle cerebellar peduncles is obvious on the silent image but obscure on the se image (arrows).
The motion artifacts on T1W silent sequence were stronger than those on SE images in one patient (the score on silent sequence was 2 and on SE 3), weaker in three patients (silent, 3; SE, 2), and the same (3 on both sequences) in the other 20 patients. The average score was 3.0 on silent and 2.9 on SE sequence. There was no significant difference between the two sequences (P = 0.30). The motion artifacts on T2W silent sequence were weaker than those on SE images in three patients (silent, 3; SE, 2), much weaker in one patient (silent, 3; SE, 1), and the same (3 on both sequences) in the other 21 patients. The average score was 3.0 on silent and 2.8 on SE sequence. There was no significant difference between the two sequences (P = 0.10).
Objective image analysis
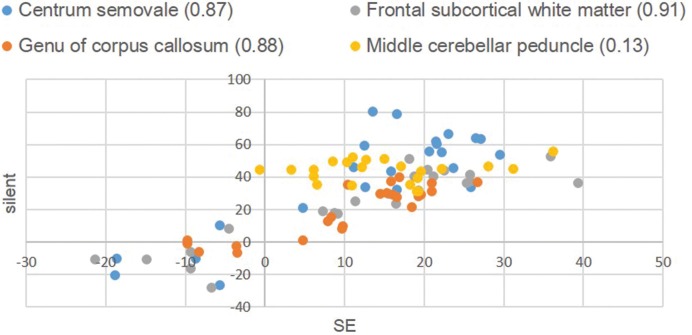
The scatter diagram in Fig. 5 illustrates a comparison of the percent contrast distribution on T1W images between silent and conventional MRI. The correlation coefficient (CC) was 0.76. When excluding the MCPs and evaluating only the other three regions, the CC of the percent contrast improved to 0.82.
Fig 5.
Percent contrast in T1-weighted images. The numbers in the caption are the correlation coefficients of each region.
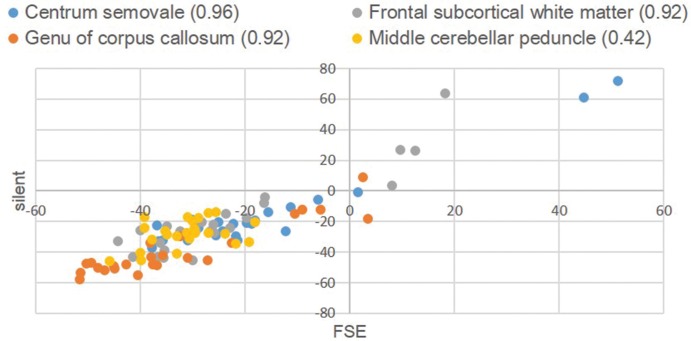
The scatter diagram in Fig. 6 illustrates the comparison of the percent contrast distribution on T2W images between silent and conventional MRI, for which a CC of 0.91 was calculated.
Fig 6.
Percent contrast in T2-weighted Images. The numbers in the caption are the correlation coefficients of each region.
Discussion
In the present study, we compared silent and conventional MRI sequences during brain imaging in children. We achieved a noise level during the T1W silent sequence that was nearly the same as the background noise, in accordance with a previous study.2 Additionally, we achieved approximately 80% reduction in noise level with the T2W silent sequence, compared with the conventional sequence, although the noise level was slightly higher than that achieved with the T1W silent sequence. A recent study assessed the noise level of silent and conventional PROPELLER T2W sequences on a clinical 1.5-T MR imaging system, similarly obtaining 26.4 dB noise reduction.7
Recently, Aida et al.13 reported quiet T1W sequence for pediatric myelination evaluation. Their quiet T1W sequence was 4.8 dB higher than that of ambient sound and the interrater agreement for myelination degree between quiet sequence and conventional T1W images were excellent. These results are consistent with our results.
To the best of our knowledge, no descriptions of T2W silent images for children on a 3T MR imaging system have been published previously. We evaluated myelination on both T1W and T2W silent images in this study. The white matter signals of silent sequences were very similar to those of conventional sequences, with kappa coefficients for inter-method agreement of 0.76 and 0.80 in T1W and T2W images respectively (good to excellent agreement). Previous reports for the adult population on a 1.5-T MR imaging system showed that quiet T2W and T2 FLAIR images were comparable in image quality with conventional acquisitions.7
In objective image analysis, a strong positive relationship was observed between silent and conventional MRI on T2W images. In T1W images, the cerebral assessment exhibited a strongly positive correlation. However, in the MCPs on T1W images, the inter-method agreement for myelination was poor, and inclusion of the MCPs lowered the CC in the objective analysis. Our results therefore suggest that silent sequences can achieve equivalent diagnostic images of non-cerebellar brain regions. Furthermore, in all cases with inter-method disagreement, the MCPs were scored higher (representing well myelinated white matter) on silent images than on SE on T1W images. As all MCPs received scores of zero (representing complete myelination) on T2W images, the T1W silent sequence delineated myelination correctly because myelin maturation is detected earlier on T1W images than on T2W images.9 Assuming that the T1W silent sequence delineates the cerebellum better than the SE sequence, the former might be more useful in the assessment of cerebellar involvement.
T1W silent images provided higher percent contrast values than SE images in 81 out of 91 evaluation points (89%) in objective image analyses. In other words, T1W silent images exhibited better gray–white differentiation. On the other hand, only 47 out of 96 (49%) of the points had higher percent contrast values on silent T2W images, indicating that the silent and SE images provided similar gray–white differentiation.
Notably, most cases of inter-method disagreement on T1W images regarding MCP evaluation involved patients aged 49 months or older. Hittmair et al.9 demonstrated that subcortical cerebellar white matter maturation reached completion at an age of approximately 7 months and that myelination was markedly worse on T1W SE images relative to T2W SE images obtained after this age. Accordingly, this age-related feature may have increased the difficulty of cerebellar gray matter identification on T1W SE images and rendered the assessment of MCP signal intensities inaccurate.
On the other hand, the T1W silent sequence might have yielded at least partial improvements in the gray-to-white matter contrast, whereas T1W SE sequences produced poorer contrast. T1W silent imaging is a gradient-echo inversion recovery sequence, and recent studies have shown that when compared with T1W SE images, 3T T1W gradient-echo images depict a higher degree of myelination in both full-term neonates and term-equivalent age infants.14,15 The results of our study are similar to those earlier reports; moreover, the use of an inversion recovery technique might have improved the T1 contrast in our study.
Unlike previous studies of silent MRI,5,7,16 we compared images produced using different techniques: gradient and spin-echo sequences. Taken together, the above-described factors may have emphasized the difference in contrast between the T1W SE and silent sequences used in this study. Our study results consequently suggest that 3T T1W silent images more precisely delineate myelination when compared with T1W SE images not only in neonates and infants, but also in preschool children.
T1W silent sequence is 3D imaging and takes about 2 minutes longer than conventional SE sequence. Long examination times increase a risk of motion artifact, though motion artifact did not increase in T1W silent sequence compared to SE sequence. We consider that the effect of acoustic noise reduction may keep the sedative state easily and have exceeded of longer scan time. The merit of 3D imaging is that we can reconstruct any cross section images after an examination to help the diagnosis.
We were not concerned about image blur in this study. Though alterations in multiecho sequence scan acquisition parameters can manifest as a blur, a prior study about T2W silent PROPELLER sequence has reported that no evidence of blur was noted in any case.7 In addition, the motion artifacts on T2W silent PROPELLER sequence were weaker than those on SE images (Mean score: silent = 3.0, SE = 2.8, P = 0.01), because PROPELLER technique improves image quality by reducing motion artifact.17
Our study had some limitations. Firstly, the age distribution of our cohort was limited. Images from patients aged 84 months or older need to be evaluated, particularly with respect to the cerebellum. Secondly, all subjects were children diagnosed with or suspected to have a disease, and no healthy children were included. However, healthy children seldom undergo MRI examinations and ethically it is difficult to perform the control study with sedated children. Thirdly, this prospective study was conducted in a normal clinical setting. We were unable to compare all sequences in the same image plane, and some additional sequences could not be obtained because of patient awakening. Fourthly, we evaluated only sites which seem to be normal. Further study is needed to evaluate abnormal signal lesions.
Conclusion
Silent sequences significantly reduced the acoustic noise levels during brain MRI scans while providing best diagnostic image quality for myelination evaluations. However, cerebellar delineation appeared to differ between T1W images obtained with the silent and spin-echo sequences. Further studies of the cerebellum in a cohort with a wider age distribution are needed to better evaluate this discrepancy.
Acknowledgments
The authors would like to acknowledge Dr Matthew Lukies for the English language proofreading of this manuscript.
Footnotes
Conflicts of Interest
The authors declare that they have no conflict of interest in this manuscript.
References
- 1.McJury M, Shellock FG. Auditory noise associated with MR procedures: a review. J Magn Reson Imaging 2000; 12:37–45. [DOI] [PubMed] [Google Scholar]
- 2.Edwards AD, Arthurs OJ. Paediatric MRI under sedation: is it necessary? What is the evidence for the alternatives? Pediatr Radiol 2011; 41:1353–1364. [DOI] [PubMed] [Google Scholar]
- 3.Pierre EY, Grodzki D, Heismann B, et al. Making MRI scanning quieter: optimized tse sequences with parallel imaging. MAGNETOM Flash 2013:30–34. [Google Scholar]
- 4.Hennel F, Girard F, Loenneker T. “Silent” MRI with soft gradient pulses. Magn Reson Med 1999; 42:6–10. [DOI] [PubMed] [Google Scholar]
- 5.Alibek S, Vogel M, Sun W, et al. Acoustic noise reduction in MRI using Silent Scan: an initial experience. Diagn Interv Radiol 2014; 20:360–363. [DOI] [PMC free article] [PubMed] [Google Scholar]
- 6.Ida M, Nielsen M. Quiet T1-weighted 3D Imaging of the central nervous system using PETRA. MAGNETOM Flash 2013:35–43. [Google Scholar]
- 7.Corcuera-Solano I, Doshi A, Pawha PS, et al. Quiet PROPELLER MRI techniques match the quality of conventional PROPELLER brain imaging techniques. AJNR Am J Neuroradiol 2015; 36:1124–1127. [DOI] [PMC free article] [PubMed] [Google Scholar]
- 8.Shaw DW, Weinberger E, Astley SJ, Tsuruda JS. Quantitative comparison of conventional spin echo and fast spin echo during brain myelination. J Comput Assist Tomogr 1997; 21:867–871. [DOI] [PubMed] [Google Scholar]
- 9.Hittmair K, Wimberger D, Rand T, et al. MR assessment of brain maturation: comparison of sequences. AJNR Am J Neuroradiol 1994; 15:425–433. [PMC free article] [PubMed] [Google Scholar]
- 10.Ashikaga R, Araki Y, Ono Y, Nishimura Y, Ishida O. Appearance of normal brain maturation on fluid-attenuated inversion-recovery (FLAIR) MR images. AJNR Am J Neuroradiol 1999; 20:427–431. [PMC free article] [PubMed] [Google Scholar]
- 11.Daldrup HE, Schuierer G, Link TM, et al. Evaluation of myelination and myelination disorders with turbo inversion recovery magnetic resonance imaging. Eur Radiol 1997; 7: 1478–1484. [DOI] [PubMed] [Google Scholar]
- 12.Madio DP, Lowe IJ. Ultra-fast imaging using low flip angles and FIDs. Magn Reson Med 1995; 34:525–529. [DOI] [PubMed] [Google Scholar]
- 13.Aida N, Niwa T, Fujii Y, et al. Quiet T1-weighted pointwise encoding time reduction with radial acquisition for assessing myelination in the pediatric brain. AJNR Am J Neuroradiol 2016; 37:1528–1534. [DOI] [PMC free article] [PubMed] [Google Scholar]
- 14.Sarikaya B, McKinney AM, Spilseth B, Truwit CL. Comparison of spin-echo T1- and T2-weighted and gradient-echo T1-weighted images at 3T in evaluating very preterm neonates at term-equivalent age. AJNR Am J Neuroradiol 2013; 34:1098–1103. [DOI] [PMC free article] [PubMed] [Google Scholar]
- 15.Tyan AE, McKinney AM, Hanson TJ, Truwit CL. Comparison of spin-echo and gradient-echo T1-weighted and spin-echo T2-weighted images at 3T in evaluating term-neonatal myelination. AJNR Am J Neuroradiol 2015; 36:411–416. [DOI] [PMC free article] [PubMed] [Google Scholar]
- 16.Ida M, Wakayama T, Nielsen ML, Abe T, Grodzki DM. Quiet T1-weighted imaging using PETRA: initial clinical evaluation in intracranial tumor patients. J Magn Reson Imaging 2015; 41:447–453. [DOI] [PubMed] [Google Scholar]
- 17.Forbes KP, Pipe JG, Bird CR, Heiserman JE. PROPELLER MRI: Clinical testing of a novel technique for quantification and compensation of head motion. J Magn Reson Imaging 2001; 14:215–222. [DOI] [PubMed] [Google Scholar]


