

Abstract
Purpose:
To evaluate morphological and signal intensity (SI) changes of placental insufficiency on magnetic resonance imaging (MRI) and to assess morphological changes and decreased flow voids (FVs) on T2-weighted rapid acquisition with relaxation enhancement (RARE) images for diagnosing placental insufficiency.
Methods:
Fifty singleton fetuses underwent MRI using a 1.5-T MR scanner. Placental thickness, area, volume, SI, amniotic fluid SI, and size of FVs between the uterus and the placenta were measured on MR images. Two radiologists reviewed T2-weighted RARE images for globular appearance of the placenta and FVs between the uterus and the placenta. Data were analyzed using t-tests, McNemar’s tests, and areas under the receiver operating characteristic curve (AUCs) at 5% level of significance.
Results:
Twenty-five of the 50 pregnancies were categorized as having an insufficient placenta. Significant differences were observed between insufficient and normal placentas in mean placental thickness, area, volume, placenta to amniotic fluid SI ratio, and size of FVs (49.0 mm vs. 36.9 mm, 1.62 × 104 mm2 vs. 2.67 × 104 mm2, 5.13 × 105 mm3 vs. 6.56 × 105 mm3, 0.549 vs. 0.685, and 3.4 mm vs. 4.3 mm, respectively). The sensitivity and accuracy using globular appearance plus decreased FVs were greater than those using decreased FVs (P < 0.01). There was no significant difference among AUCs using globular appearance and decreased FVs, and globular appearance plus decreased FVs.
Conclusions:
Placental insufficiency was associated with placental thickness, area, volume, placenta to amniotic fluid SI ratio, and size of FVs. Evaluating FVs on T2-weighted RARE images can be useful for detecting placental insufficiency, particularly in placentas without globular appearance on MR images.
Keywords: magnetic resonance imaging, fetus, placental insufficiency, flow void, fetal growth restriction
Introduction
Maternal uteroplacental blood flow increases during pregnancy. Normally, the uteroplacental arteries are invaded by endovascular trophoblast and remodeled into dilated, inelastic tubes without maternal vasomotor control. Disturbed remodeling is associated with maintenance of high uteroplacental vascular resistance and fetal growth restriction (FGR).1 FGR as a consequence of placental insufficiency is the second most frequent cause of perinatal mortality.2 The assessment of placental insufficiency is currently based on repetitive ultrasonography (US) of the placenta and the fetus and Doppler US of the umbilical vessels. However, the positive predictive value of US in placental insufficiency barely exceeds 50%.3 Several investigators have reported that perfusion and diffusion techniques on fetal MRI can be valuable for the assessment of placental insufficiency.4–9 Pregnancies complicated by FGR showed lower placental perfusion or lower perfusion fraction than that in the normal pregnancies7–9 and thus substantially lower uteroplacental blood flow would reduce size and number of flow voids (FVs) between the uterus and the placenta in placental insufficiency in fetuses with FGR.
We hypothesized that evaluating FVs between the uterus and the placenta on half-Fourier T2-weighted rapid acquisition with relaxation enhancement (RARE) images can be used as additional information to identify placental insufficiency in fetuses whose placental perfusion is substantially lower, leading to FGR. In this study, we aimed to evaluate the morphological and signal intensity (SI) changes of placental insufficiency on MR images and assessed the value of morphological changes and changes of FVs on T2-weighted half-Fourier RARE MR images for diagnosing placental insufficiency.
Materials and Methods
Patients
This retrospective study was approved by the Institutional Review Board and the requirement for informed consent was waived.
Our primary patient selection criteria were as follows: (a) fetuses of pregnant females with abnormal findings on obstetric US and (b) fetuses of pregnant females who underwent MRI examination, including T2-weighted half-Fourier RARE imaging and T1-weighted fast low-angle shot imaging, with a 1.5-T MR unit between February 2009 and November 2013. According to the primary criteria, 101 consecutive fetuses (96 pregnant females) were selected. Exclusion criteria were (1) multiple pregnancies, (2) aneuploidy, (3) in utero infection, (4) fetal anomalies that can cause FGR, and (5) the presence of additional structural abnormalities of the placenta or umbilical cord.
Five patients with twin pregnancies, six patients having fetuses with chromosomal aneuploidy, and eight patients with in utero infection were excluded. Patients found to have fetal anomalies of the central nervous system (n = 10), abdomen and pelvis (n = 8), and chest (n = 9) on obstetric US or MRI were also excluded. Finally, 50 pregnant females (50 fetuses) were eligible for this study. Twenty-five pregnant females had an insufficient placenta with FGR. The remaining 25 pregnant females had a normal functional placenta with no FGR. In 25 patients with no FGR, MR examinations were performed to evaluate placentas in 22 patients with placenta previa or low-lying placenta, two patients with hematomas in the placenta and one patient with a giant uterine leiomyoma. The mean gestational age at MRI was 29.3 weeks (range, 19–38 weeks of gestation). The pregnant patients ranged in age from 23–41 years (mean, 33.2 years).
MRI Protocol
All MRI examinations were performed using a 1.5-T MR scanner (MAGNETOM Avanto; Siemens Medical Solutions, Erlangen, Germany) with body-matrix and spine-matrix coils. Sagittal, transverse, and coronal T2-weighted half-Fourier RARE (repetition time ms/echo time ms/flip angle = 1500/60/150°; matrix, 168 × 320; field of view, 350 mm) and sagittal T1-weighted fast low-angle shot (150/4.76/90°; matrix, 173 × 256; field of view, 350 mm) sequences were performed with a 5-mm section thickness and 1.0-mm intersectional gap. The half-Fourier RARE images were obtained in an interleaved order with an acquisition time of 1.02 sec per section. Additional sequences were added depending on the indication.
Image Interpretation
All quantitative measurements and image interpretation sessions were performed on a Picture Archiving and Communication Systems workstation (SYNAPSE; FUJIFILM Medical System, Tokyo). All quantitative measurements were evaluated by one investigator with 18 years of experience reading body MRI and blinded to clinical data and outcome. Maximal placental thickness was defined as the thickness of the placental parenchyma at the point of central umbilical cord insertion on the image, where the placental parenchyma is thickest. When there was a marginal or velamentous cord insertion, we measured maximal placental thickness as thickness of the placental parenchyma at the center of the placenta. Maximal placental longitudinal length was defined as the length of the placental parenchyma at the half point of thickness on the sagittal image, where the placental parenchyma is largest. Maximal placental transverse length was defined as the length of the placental parenchyma at the half point of thickness on the transverse image, where the placental parenchyma is largest. Placental area was calculated as follows: placental area = π× maximal placental longitudinal length/2 × maximal placental transverse length/2. Placental volume was calculated as follows: placental volume = placental thickness × placental area × 2/3. When there was intraplacenta hemorrhage in the placenta, we measured the volume of the placenta including the intraplacenta hemorrhage and the volume of the intraplacenta hemorrhage in the same way. Placental volume with intraplacenta hemorrhage was calculated as follows: placental volume = volume of placenta including intraplacenta hemorrhage – volume of intraplacenta hemorrhage. Placental and amniotic fluid SIs were assessed by measuring the SI of the largest possible ellipsoidal region of interest on the slice that contained the maximal area of both placenta and amniotic fluids with no imaging artifact present. Placenta to amniotic fluid SI ratio was calculated as follows: placenta to amniotic fluid SI ratio = (SI of placenta)/(SI of amniotic fluid). A size of FVs between the uterus and the placenta in each placenta was measured on the sagittal image, where a minor axis of the FV is largest. A number of FVs between the uterus and the placenta in each placenta was measured on the sagittal image at the point of central umbilical cord insertion. When there was a marginal or velamentous cord insertion, we measured a number of FVs between the uterus and the placenta at the center of the placenta. Two image interpretation sessions were performed by two independent radiologists with 23 and 18 years of experience reading body MRI and who were blinded to the clinical and histological findings. Globular appearance was defined as a thickened appearance and no tapering of placental edges. Normal placentas typically show large surface areas of attachment to the uterus with tapering edges (Fig. 1). According to these findings, the probability for the presence of globular appearance of the placenta was estimated by using a five-point rating scale (5 = definitely present, 4 = probably present, 3 = indeterminate, 2 = probably absent, and 1 = definitely absent). For the calculation of sensitivity, specificity, and accuracy, the results were dichotomized; scores of 1 through 3 were rated as absence of globular appearance and scores of 4 and 5 were rated as presence of globular appearance.10
Fig. 1.
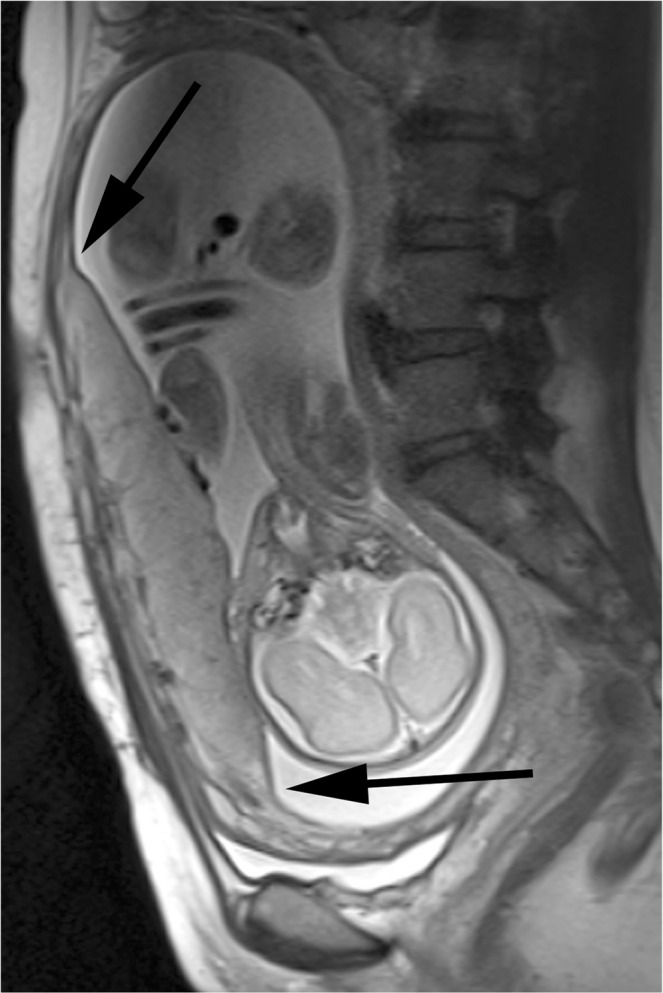
A 35-year-old female with a normal functional placenta with no fetal growth restriction. T2-weighted half-Fourier rapid acquisition with relaxation enhancement magnetic resonance image shows a large surface area of attachment to the uterus, with tapered edges (arrow).
Decreased FVs were defined as none or decreased size and number of FVs between the uterus and the placenta (Fig. 2). Normal placentas typically show several clear FVs between the uterus and the placenta (Fig. 3). According to these findings, the probability for the presence of decreased FVs was estimated by using a four-point rating scale (4 = definitely present, 3 = probably present, 2 = probably absent, and 1 = definitely absent). For the calculation of sensitivity, specificity, and accuracy, the results were dichotomized; scores of 1 through 2 were rated as absence of decreased FVs and scores of 3 and 4 were rated as presence of decreased FVs. To avoid recall in the readers, the images were randomly reviewed for decreased FVs 4 weeks after evaluation of globular appearance.
Fig. 2.
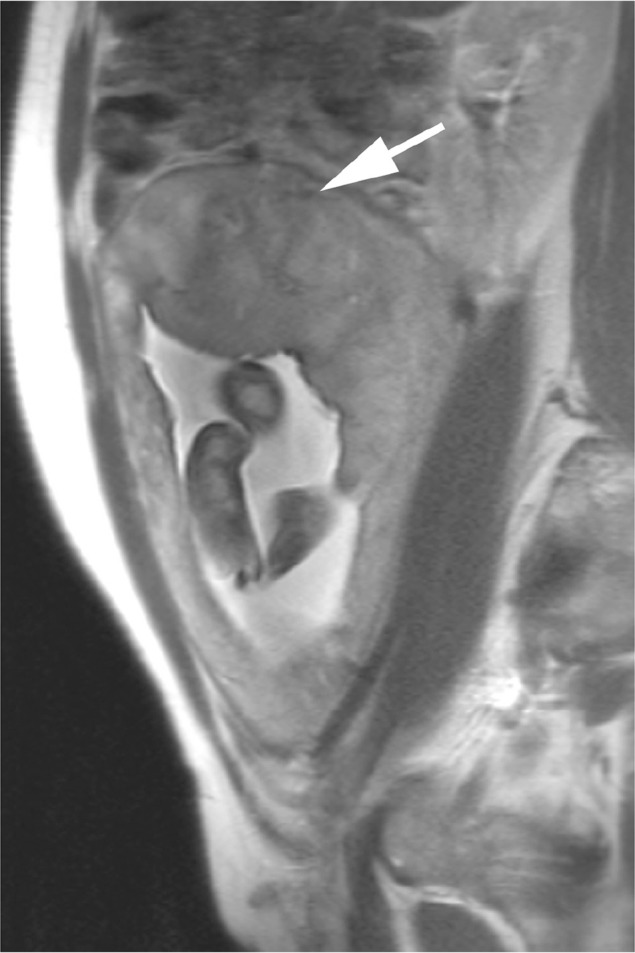
A 28-year-old female with insufficient placenta with fetal growth restriction. T2-weighted half-Fourier rapid acquisition with relaxation enhancement magnetic resonance image shows a decreased size and number of flow voids (arrow) between the uterus and the placenta.
Fig. 3.
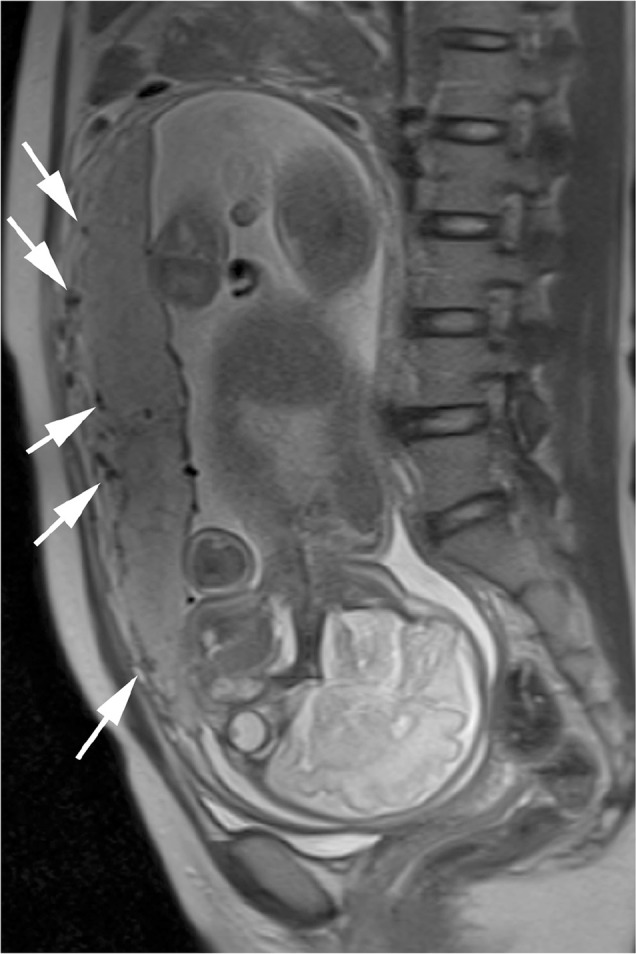
A 31-year-old female with a normal functional placenta with no fetal growth restriction. T2-weighted half-Fourier rapid acquisition with relaxation enhancement magnetic resonance image shows several clear flow voids (arrows) between the uterus and the placenta.
Obstetrics and Neonatology Data
All reports from obstetric US, delivery ward examination, and follow-up at the Department of Neonatology, including histopathological reports, were collected and evaluated by two obstetricians with more than 15 years of experience in obstetrics. Placental insufficiency was defined if the estimated fetal weight using obstetric US was below the 5th percentile. Abnormal histopathological findings suggestive of placental dysfunction (e.g., infarctions, hemorrhage, or signs of infection) were noted.
Statistical Analyses
The mean gestational age at MRI, mean placental thickness, placental area, volume, placenta to amniotic fluid SI ratio, birth weight, size of FVs, and number of FVs in fetuses with and without placental insufficiency were compared using two-sample Student’s t-tests. The mean placental volume of fetuses with and without placental insufficiency in less than 30 gestational weeks and 30 or more than 30 gestational weeks were also compared using two-sample Student’s t-tests. Differences in performance between globular appearance and decreased FVs were analyzed by comparing the area under the receiver operating characteristic curves (AUCs) of the two readers.11 The analyses were performed using a software (DBM-MRMC; C. E. Metz, University of Chicago, Chicago, Illinois, USA). Next, sensitivity, specificity, diagnostic accuracy, positive predictive value (PPV), and negative predictive value (NPV) were calculated for globular appearance and decreased FVs and for each reader. Differences in the diagnostic performance of the globular appearance and the decreased FVs were evaluated using the McNemar’s test with the SPSS software (version 17.0 for Windows; SPSS Japan, Tokyo). A P value ≤ 0.05 was considered to indicate statistical significance. Reader agreement for globular appearance and decreased FVs was assessed using Cohen’s kappa test. A value of 0.21–0.40 implied fair agreement, 0.41–0.60 moderate, 0.61–0.80 substantial, and 0.81–1.0 almost perfect agreement.
Results
Twenty-five of the 50 pregnancies were categorized as having an insufficient placenta with FGR and 25 as having a normal functional placenta with no FGR. The placentas were clearly imaged on MR images in all cases. On MRI, the mean gestational age of fetuses with placental insufficiency was not significantly different from fetuses without placental insufficiency (mean ± standard deviation, 29.4 weeks ± 4.2 vs. 29.2 weeks ± 4.0, respectively; P = 0.87). The mean gestational age at delivery of fetuses with placental insufficiency was not significantly different from fetuses without placental insufficiency (mean ± standard deviation, 33.8 weeks ± 3.4 vs. 33.1 weeks ± 3.6, respectively; P = 0.51). The mean birth weight of fetuses with placental insufficiency was significantly different from fetuses without placental insufficiency (mean ± standard deviation, 1444 g ± 542 vs. 2033 weeks ± 666, respectively; P = 0.0016). All actual body weights of fetuses with placental insufficiency were below 5th percentile. All actual body weights of fetuses without placental insufficiency were above 5th percentile. Histopathological placental examination was accessible for all fetuses. The histopathological examination showed subchorionic hemorrhage in one growth-restricted fetus and two normally grown fetuses, intraplacental hemorrhage in two growth-restricted fetuses and one normally grown fetus, retroplacental hemorrhage in two growth-restricted fetuses and placental infarction greater than 1 cm in five growth-restricted fetuses. In the remaining placentas, the histopathological examination did not show abnormal findings that can cause FGR such as infarction greater than 1 cm or hemorrhage.
Quantitative Evaluation Using MRI
Table 1 shows mean placental thicknesses, placental areas, placental volumes, and placenta to amniotic fluid signal intensity ratio (SIR), size of FVs, and number of FVs in fetuses with and without placental insufficiency. In fetuses without placental insufficiency, 11 fetuses were in less than 30 gestational weeks and 14 fetuses were in 30 or more than 30 gestational weeks. Table 2 shows mean placental volume of fetuses with and without placental insufficiency in less than 30 gestational weeks and 30 or more than 30 gestational weeks. Mean placental volume of fetuses in 30 or more than 30 gestational weeks is greater than that in less than 30 gestational weeks (P = 0.037). In fetuses with placental insufficiency, 12 fetuses were in less than 30 gestational weeks and 13 fetuses were in 30 or more than 30 gestational weeks. Mean placental volume of fetuses in 30 or more than 30 gestational weeks is greater than that in less than 30 gestational weeks (P = 0.026).
Table 1.
Mean placental thicknesses, placental areas, placental volumes, and placenta to amniotic fluid signal intensity ratio (SIR), size of flow voids (FVs), and number of FVs in fetuses with and without placental insufficiency
| Fetuses with placental insufficiency | Fetuses without placental insufficiency | P value | |
|---|---|---|---|
| Placental thickness (mm) | 49.0 (9.8) | 36.9 (6.8) | <0.001 |
| Placental area (mm2) | 1.62 × 10⁴ (7.1 × 10³) | 2.67 × 10⁴ (9.6 × 10³) | <0.001 |
| Placental volume (mm3) | 5.13 × 10⁵ (1.8 × 10⁵) | 6.56 × 10⁵ (2.8 × 10⁵) | 0.036 |
| Placental to amniotic fluid SIR | 0.549 (0.16) | 0.685 (0.19) | <0.01 |
| Size of FVs (mm) | 3.4 (0.5) | 4.3 (0.5) | <0.01 |
| Number of FVs | 5.8 (0.9) | 6.5 (0.9) | <0.01 |
Note: Data in parentheses are standard deviation. FVs, flow voids; SIR, signal intensity ratio.
Table 2.
Mean placental volume of fetuses with and without placental insufficiency in less than 30 gestational weeks and 30 or more than 30 gestational weeks
| Less than 30 gestational weeks | 30 or more than 30 gestational weeks | P value | |
|---|---|---|---|
| Placental volume (mm3) of fetuses without placental insufficiency | 5.31 × 10⁵ (2.2 × 10⁵) | 7.56 × 10⁵ (2.5 × 10⁵) | P = 0.037 |
| Placental volume (mm3) of fetuses with placental insufficiency | 4.63 × 10⁵ (1.6 × 10⁵) | 6.41 × 10⁵ (2.0 × 10⁵) | P = 0.026 |
Note: Data in parentheses are standard deviation.
Diagnostic Performance Using MRI
Table 3 shows diagnostic performance in the detection of placental insufficiency with globular appearance (κ = 0.80), decreased FVs (κ = 0.57), and globular appearance plus decreased FVs (κ = 0.76). The sensitivity of globular appearance plus decreased FVs was greater than with decreased FVs in reader 2 (P < 0.01). The accuracy of globular appearance plus decreased FVs was greater than with decreased FVs in both readers (P < 0.01). There was no significant difference among AUCs with globular appearance, decreased FVs, and globular appearance plus decreased FVs in the two readers.
Table 3.
Diagnostic performance and area under the receiver operating characteristic curves (AUCs) in detection of placental insufficiency with globular appearance, decreased flow voids (FVs), and globular appearance plus decreased FVs
| Sensitivity | Specificity | Accuracy | PPV | NPV | AUC | |
|---|---|---|---|---|---|---|
| Reader 1 | ||||||
| Globular appearance | 80 (20/25) | 88 (22/25) | 84 (42/50) | 87 (20/23) | 82 (22/27) | 0.89 (0.79, 0.99) |
| Decreased FVs | 76 (19/25) | 96 (24/25) | 86a (43/50) | 95 (19/20) | 80 (24/30) | 0.85 (0.74, 0.97) |
| Globular appearance plus decreased FVs | 96 (24/25) | 84 (21/25) | 90a (45/50) | 86 (24/28) | 96 (21/22) | 0.94 (0.88, 1.00) |
| Reader 2 | ||||||
| Globular appearance | 76 (19/25) | 80 (20/25) | 78 (39/50) | 79 (19/24) | 77 (20/26) | 0.80 (0.67, 0.92) |
| Decreased FVs | 52b (13/25) | 88 (22/25) | 70c (35/50) | 81 (13/16) | 65 (22/34) | 0.77 (0.62, 0.89) |
| Globular appearance plus decreased FVs | 88b (22/25) | 76 (19/25) | 82c (41/50) | 79 (22/28) | 86 (19/22) | 0.87 (0.77, 0.97) |
Note: Data in parentheses are percentages with values used to calculate percentages in the diagnostic performances and 95% confidence intervals in the AUCs.
P < 0.01 for comparison of accuracy between decreased FVs and globular appearance plus decreased FVs;
P < 0.01 for comparison of sensitivity between decreased FVs and globular appearance plus decreased FVs;
P < 0.01 for comparison of accuracy between decreased FVs and globular appearance plus decreased FVs; FVs, flow voids; NPV, negative predictive value; PPV, positive predictive value.
Discussion
Our clinical data demonstrated that addition of decreased FVs improved the sensitivity and accuracy for diagnosing placental insufficiency. Damodaram et al. reported that 19 placentas showed thickened globular appearance in 20 growth-restricted fetuses.12 Bonel et al. also reported diagnostic performance in detection of placental insufficiency using morphological MRI alone and morphological MRI with diffusion-weighted imaging.6 Their detection sensitivity with morphological imaging alone was similar to our sensitivity regarding globular appearance in both readers, although the sensitivity reported by Damodaram et al. was higher, possibly because they used a different method to evaluate globular appearance.
Globular appearance plus decreased FVs was found in 24 and 22 fetuses with placental insufficiency by readers 1 and 2, respectively. The accuracies regarding globular appearance plus decreased FVs were also greater than with decreased FVs for both readers. The addition of decreased FVs on T2-weighted RARE images can facilitate the detection of placental insufficiency. Decreased FVs between the uterus and the placenta were considered a reflection of reduced uteroplacental perfusion associated with FGR.7–9
Our results showed a significant increase in the placental thickness and significant reductions in placental area and volume associated with FGR. An increase in placental thickness and reductions in placental area and volume are consistent with histopathological, US, and MRI studies of placental insufficiency.12–14 Endovascular trophoblast invasion induces spiral artery remodeling, which increases uteroplacental perfusion to meet the requirements of the fetus.1 Placental surface area can become reduced in placental insufficiency when endovascular trophoblasts lose their focal adhesion. Globular appearance is thought to reflect the reduction in placental surface area and the increase in placental thickness that compensates for placental insufficiency.14 Focal loss of endovascular trophoblasts may also cause a smaller dysfunctional placenta in FGR.1,12
Blaicher et al.15 described a reduction in the placental to amniotic fluid SIR with increasing gestation in normal pregnancies, which was thought to be a reflection of the well-known morphological changes during placental aging that lead to a loss of placental tissue density which means calcification and infarction appear and may lead to reduced vascular supply in the placenta. Our results showed a trend towards reduction in the placenta to amniotic fluid SIR in the fetuses with placental insufficiency. Damodaram et al.10 described this finding may be a reflection of subtle microscopic changes such as perivillous fibrin deposition.
Doppler examinations of the uterine arteries seem to be comparable as predictors of outcome in pregnancies complicated by FGR in some previous studies.16–18 Abnormal Doppler profiles of placental vessels were detected in pregnancies complicated by FGR probably because of incomplete transformation of placental vessels early in pregnancy. Our results showed that the size and number of FVs in the fetuses without placental insufficiency is greater than those with placental insufficiency. These findings are in accordance with the results of the previous studies16–18 that showed a correlation between abnormal Doppler profiles of placental vessels and pregnancies complicated by FGR.
Our results showed a significant increase in the placental volume in 30 or more than 30 gestational weeks than less than 30 gestational weeks in both fetuses with placental insufficiency and without placental insufficiency. These results correspond to previous reports regarding placental volume and placental weight.19,20
Placental infarcts are found in approximately 25% of uncomplicated term pregnancies while increasing placental infarction is associated with placental dysfunction and FGR.21 A particular advantage of MRI is the high soft tissue contrast and thus placental MRI was useful to detect placental vascular abnormalities such as infarctions and hemorrhages in cases of FGR in previous reports.22,23 Linduska et al. reported that ischemic infarctions were able to be detected by MRI with high sensitivity (96%) and moderate specificity (63%).22 In fact, our obstetricians referred placental MRI to evaluate placental infarction in the patients with FGR. Decreased FVs in addition to morphological changes of placentas without placental infarctions or hemorrhages on MRI can support a clinical diagnosis of placental insufficiency by obstetricians.
Our study had several limitations. First, histological examination of the placenta was available for all pregnancies but there was a delay between antenatal MRI assessment and postnatal histological placental examination. Second, several studies reported that placental apparent diffusion coefficient (ADC) maps or perfusion fraction maps were useful for evaluating pregnancies with FGR. We did not perform diffusion-weighted imaging because of the retrospective design of the study; therefore, we could not compare decreased FVs with placental ADC maps or perfusion fraction maps. Finally, we did not follow individual pregnancies over time, thus we were unable to assess individual FV changes between the uterus and the placenta during pregnancy; therefore, further studies are needed.
Conclusion
Placental insufficiency is associated with placental thickness, placental area, placental volume, placenta to amniotic fluid SI ratio, and size of FVs between the uterus and the placenta on MR images. Globular appearance and decreased FVs on T2-weighted half-Fourier RARE images can support a clinical diagnosis of placental insufficiency by obstetricians. Evaluation of FVs between the uterus and the placenta on T2-weighted half-Fourier RARE images can facilitate detection of placental insufficiency, particularly in placentas without a globular appearance on MRI.
References
- 1.Kaufmann P, Black S, Huppertz B. Endovascular trophoblast invasion: implications for the pathogenesis of intrauterine growth retardation and preeclampsia. Biol Reprod 2003; 69:1–7. [DOI] [PubMed] [Google Scholar]
- 2.Lausman A, Kingdom J, Maternal Fetal Medicine Committee et al. Intrauterine growth restriction: screening, diagnosis, and management. J Obstet Gynaecol Can 2013; 35:741–757. [DOI] [PubMed] [Google Scholar]
- 3.Sarmandal P, Grant JM. Effectiveness of ultrasound determination of fetal abdominal circumference and fetal ponderal index in the diagnosis of asymmetrical growth retardation. Br J Obstet Gynaecol 1990; 97:118–123. [DOI] [PubMed] [Google Scholar]
- 4.Derwig I, Lythgoe DJ, Barker GJ, et al. Association of placental perfusion, as assessed by magnetic resonance imaging and uterine artery Doppler ultrasound, and its relationship to pregnancy outcome. Placenta 2013; 34:885–891. [DOI] [PubMed] [Google Scholar]
- 5.Javor D, Nasel C, Schweim T, Dekan S, Chalubinski K, Prayer D. In vivo assessment of putative functional placental tissue volume in placental intrauterine growth restriction (IUGR) in human fetuses using diffusion tensor magnetic resonance imaging. Placenta 2013; 34:676–680. [DOI] [PubMed] [Google Scholar]
- 6.Bonel HM, Stolz B, Diedrichsen L, et al. Diffusion-weighted MR imaging of the placenta in fetuses with placental insufficiency. Radiology 2010; 257:810–819. [DOI] [PubMed] [Google Scholar]
- 7.Moore RJ, Strachan BK, Tyler DJ, et al. In utero perfusing fraction maps in normal and growth restricted pregnancy measured using IVIM echo-planar MRI. Placenta 2000; 21:726–732. [DOI] [PubMed] [Google Scholar]
- 8.Francis ST, Duncan KR, Moore RJ, Baker PN, Johnson IR, Gowland PA. Non-invasive mapping of placental perfusion. Lancet 1998; 351:1397–1399. [DOI] [PubMed] [Google Scholar]
- 9.Sohlberg S, Mulic-Lutvica A, Olovsson M, et al. MRI estimated placental perfusion in fetal growth assessment. Ultrasound Obstet Gynecol. 2015. [Epub ahead of print] [DOI] [PMC free article] [PubMed] [Google Scholar]
- 10.Ohgiya Y, Suyama J, Seino N, et al. Diagnostic accuracy of ultra-high-b-value 3.0-T diffusion-weighted MR imaging for detection of prostate cancer. Clin Imaging 2012; 36:526–531. [DOI] [PubMed] [Google Scholar]
- 11.Dorfman DD, Berbaum KS, Metz CE. Receiver operating characteristic rating analysis. Generalization to the population of readers and patients with the jackknife method. Invest Radiol 1992; 27:723–731. [PubMed] [Google Scholar]
- 12.Damodaram M, Story L, Eixarch E, et al. Placental MRI in intrauterine fetal growth restriction. Placenta 2010; 31:491–498. [DOI] [PubMed] [Google Scholar]
- 13.Biswas S, Ghosh SK. Gross morphological changes of placentas associated with intrauterine growth restriction of fetuses: a case control study. Early Hum Dev 2008; 84:357–362. [DOI] [PubMed] [Google Scholar]
- 14.Fisteag-Kiprono L, Neiger R, Sonek JD, Croom CS, McKenna DS, Ventolini G. Perinatal outcome associated with sonographically detected globular placenta. J Reprod Med 2006; 51:563–566. [PubMed] [Google Scholar]
- 15.Blaicher W, Brugger PC, Mittermayer C, et al. Magnetic resonance imaging of the normal placenta. Eur J Radiol 2006; 57:256–260. [DOI] [PubMed] [Google Scholar]
- 16.Ghosh GS, Gudmundsson S. Uterine and umbilical artery Doppler are comparable in predicting perinatal outcome of growth-restricted fetuses. BJOG 2009; 116:424–430. [DOI] [PubMed] [Google Scholar]
- 17.Vergani P, Roncarglia N, Andreotti C, et al. Prognostic value of uterine artery Doppler velocimetry in growth-restricted fetuses delivered near term. Am J Obstet Gynecol 2002; 187:932–936. [DOI] [PubMed] [Google Scholar]
- 18.Severi FM, Bocchi C, Visentin A, et al. Uterine and fetal cerebral Doppler predict the outcome of third-trimester small-for-gestational age fetuses with normal umbilical artery Doppler. Ultrasound Obstet Gynecol 2002; 19:225–228. [DOI] [PubMed] [Google Scholar]
- 19.Thompson JM, Irgens LM, Skjaerven R, Rasmussen S. Placenta weight percentile curves for singleton deliveries. BJOG 2007; 114:715–720. [DOI] [PubMed] [Google Scholar]
- 20.Derwig IE, Akolekar R, Zelaya FO, Gowland PA, Barker GJ, Nicolaides KH. Association of placental volume measured by MRI and birth weight percentile. J Magn Reson Imaging 2011; 34:1125–1130. [DOI] [PubMed] [Google Scholar]
- 21.Astner A, Schwinger E, Caliebe A, Jonat W, Gembruch U. Sonographically detected fetal and placental abnormalities associated with trisomy 16 confined to the placenta. A case report and review of the literature. Prenat Diagn 1998; 18:1308–1315. [PubMed] [Google Scholar]
- 22.Linduska N, Dekan S, Messerschmidt A, et al. Placental pathologies in fetal MRI with pathohistological correlation. Placenta 2009; 30:555–559. [DOI] [PubMed] [Google Scholar]
- 23.Messerschmidt A, Baschat A, Linduska N, et al. Magnetic resonance imaging of the placenta identifies placental vascular abnormalities independently of Doppler ultrasound. Ultrasound Obstet Gynecol 2011; 37:717–722. [DOI] [PubMed] [Google Scholar]