Abstract
Purpose:
Heme and iron accumulation due to repeated hemorrhage in endometriosis may contribute to a pivotal role in carcinogenesis. We evaluate the clinical application of MR relaxometry in a series of ovarian endometriosis (OE) and endometriosis-associated ovarian cancer (EAOC).
Materials and Methods:
A prospective study of diagnostic accuracy was conducted among 82 patients (67 OE and 15 EAOC) to compare MR relaxometry and biochemical measurement of cyst fluid total iron concentration. Transverse relaxation rate R2 value was determined using a single-voxel, multi-echo MR sequence (HISTO) by a 3T-MR system. Phantom experiments were also performed to assess the correlation between the ex vivo R2 values and total iron concentrations.
Results:
Both the results of phantom experiments and in vivo human data confirmed that in vivo R2 values were highly correlated with total iron concentrations. Compared to OE, EAOC exhibit decreased in vivo R2 values and total iron levels, regardless of their age, menopausal status and cyst size. The use of in vivo R2 values retained excellent accuracy in distinguishing EAOC versus OE (sensitivity and specificity: 86% and 94%).
Conclusions:
We have demonstrated that MR relaxometry provides a noninvasive predictive tool to discriminate between EAOC and OE.
Keywords: endometriosis, carcinogenesis, magnetic resonance imaging, relaxometry, iron
Introduction
Endometriosis is one of the most common diseases in women of reproductive age.1 Symptoms of dysmenorrhea, chronic pelvic pain and infertility negatively affect patients’ quality of life.1 The ovarian cancer risk was found to be elevated among women with ovarian endometriosis (OE) (odd ratio, 3.43–8.95).2–5 Heme and iron accumulation due to repeated hemorrhage in endometriosis may contribute to carcinogenesis by a range of possible mechanisms, including oxidative damage and chronic inflammation.6,7 There is also evidence of an epidemiologic link between iron overload and various types of human carcinoma, including malignant mesothelioma, renal cell carcinoma, hepatocellular carcinoma, and endometriosis-associated ovarian cancer (EAOC).8 This evidence was also supported by a laboratory-based experimental study showing that the iron-induced persistent oxidative stress has been associated with carcinogenesis.9 A recent study showed that, compared to OE, EAOC exhibited decreased total iron concentrations in cyst fluids.10 This data led us to speculate that cyst fluid iron levels could be a marker for EAOC.
MR imaging is a widely used in the assessment of endometriosis.11 MR relaxometry is used in chemical and biological sciences as an analytical method that enables the identification and quantification of metabolites and the chemical contents in biological fluids and tissues samples.12 MR sequences such as multi-echo corrected single voxel spectroscopy is suited to analyze a small volume of in vivo tissue while avoiding any sample manipulation. This type of imaging has been used in clinical studies to estimate tissue iron deposition in the brain,13–17 liver18–23 and other tissues.24–26
Our objective was to investigate 1) whether the MR relaxometry-based parameter applied in OE and EAOC shows a significant correlation with the in vitro iron concentrations, and 2) whether this method provides the differential diagnosis of EAOC from OE.
Materials and Methods
Subjects and study design
This is a single-center, non-randomized, prospective cohort study to assess the accuracy of MR relaxometry for the estimation of cyst fluid total iron concentration and accurate diagnosis of malignant transformation of OE. The study was conducted under the guidelines that had been approved by the medical ethics committee of the Nara Medical University, Kashihara, Japan. Written informed consent was obtained from all patients. Data were acquired under regular clinical care conditions.
Patients who were pathologically diagnosed with OE or their malignant transformation (EAOC) between December 2012 and March 2014 in Nara Medical University Hospital were enrolled in this study. Two patient groups were recruited; 1) pathologically diagnosed benign OE patients within 3 months of the registration (the OE group) and 2) those with previously diagnosed OE with a pathologically proven malignant transformation (the EAOC group). Eligible patients were aged 20 years or older. All EAOC (n = 15) had synchronous endometriotic lesions according to Sampson and Scott’s criteria.27,28 A histological examination revealed a transition between the ovarian cancer and the directly adjacent endometriosis. Patients with contraindications to MR imaging (e.g. allergy to all suitable contrast agents, cardiac pacemaker), those with evidence of severe or uncontrolled systemic disease, those with severe psychiatric disorders that affect on informed consent and those with pregnancy or breastfeeding were excluded. Participants were recommended to undergo preoperative (in vivo) and/or postoperative (ex vivo) MR relaxometry in addition to conventional imaging tests, such as transvaginal ultrasonography, CT and routine MR imaging, performed as part of clinical care. MR relaxometry was scheduled as close as possible to the surgery. Mean (± standard deviation [SD]) interval between MR imaging examination and surgery was 26 ± 29 days (range 0–86 days). According to the above criteria, 82 patients were selected during the period of the study. Sixty-five premenopausal women and two postmenopausal women were selected for the OE group. The EAOC group ultimately consisted of ten premenopausal and five postmenopausal women. Cyst fluid samples were obtained from patients with OE (n = 67) and EAOC (n = 15).
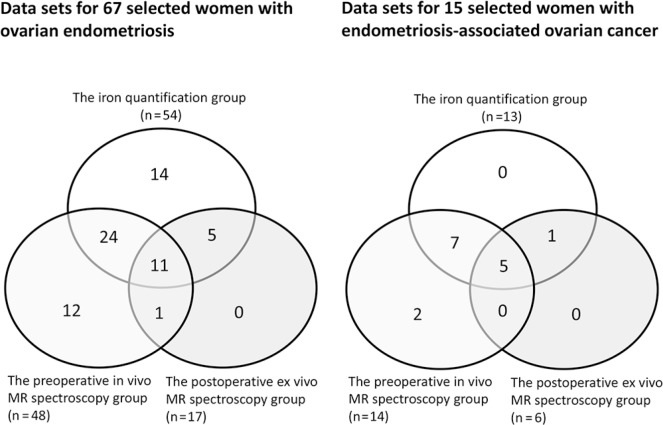
Cystic fluids harvested from surgical specimens with a syringe were collected into a plastic tube without an anticoagulant and centrifuged. Supernatants were kept frozen at −20°C within 1 hour of resection until the time of analysis. Samples were used for both biochemical analysis and ex vivo MR relaxometry. In some cases, the data were limited, since performing all procedures (quantification of iron levels, pre- and post-operative paired MR relaxometry imaging) was impossible. Among data sets for 67 selected women with OE, 54 (81%), 48 (72%) and 17 (25%) patients underwent in vitro quantification of iron levels, in vivo MR relaxometry and ex vivo MR relaxometry, respectively (Fig. 1). Among data sets for 15 selected patients with EAOC, there were 13 cases (87%) of the iron quantification group, 14 cases (93%) in the in vivo MR relaxometry group and 6 cases (40%) in the ex vivo MR relaxometry group (Fig. 1). EAOC patients include different histological subtypes of epithelial ovarian cancer; clear cell carcinoma (n = 9), endometrioid carcinoma (n = 3), mixed-type carcinoma (n = 1), seromucinous carcinoma (n = 1) and undifferentiated carcinoma (n = 1). These tumors were pathologically proven to have arisen from endometriotic epithelial cells. The results of the assays were not available to the clinicians and therefore did not influence subsequent patient management.
Fig 1.
Data sets for 67 selected women with Ovarian endometriosis (OE) and 15 selected patients with Endometriosis-associated ovarian cancer (EAOC). This figure shows distribution of the patients across experimental groups.
MR relaxometry for determining R2 value
All patients underwent routine MR imaging using T1W and T2W sequences. MR images were obtained on a 3T system (Magnetom Verio, Siemens Healthcare, Erlangen, Germany). After the routine clinical MR imaging, the registered patients underwent MR relaxometry by using single-voxel acquisition mode sequence at a multiple echo times and by fitting an exponential decay to the echo amplitude at different multiple echo times.22 A parameter R2 value (s−1) was calculated using high-speed -corrected multi-echo MR sequence (HISTO) by the 3T-MR system in vivo and ex vivo that has been described previously.22,29 The HISTO sequence was based on the single voxel steam sequences that could be used for relative fat quantification in the liver.30 This sequence allows estimation of liver iron deposition since T2 of water change with iron concentration. The pulse sequence design and programming were done with an imaging platform (Siemens Medical Systems, Erlangen, Germany) and applied to the 3T-system. The sequence used the same minimal TE on 1.5T MR system, reduced to 12 ms by increasing the gradient amplitude between the initial radio frequency pulses. The sequence has fixed number of five measurements with different TE; 12, 24, 36, 48 and 72 ms. The typical protocol is performed in breath hold, with a total acquisition time of 15 sec. The repetition time (TR) was fixed to 3000 ms which proved to be enough to compensate the effects of signal saturation while maintain an acceptable acquisition time. A 15 × 15 × 15-mm spectroscopy voxel (VOI) was placed to select a region encompassing the liquid portion, but not solid portion, of the cyst lumen. The largest cyst fluid was measured if there were any patients who had more than one cyst. The VOI could be located in the center of the OE or EAOC cyst by Dr. J.T. who had more than 15 years of experience in female pelvic MR imaging.
Quantification of iron concentrations
After the in vivo and ex vivo MR relaxometry, total iron concentration was quantified in each cyst fluid as described in reference 10. Briefly, cyst fluids were weighed and microwave digested with 50% HNO3 and 5% H2O2. The final sample solution after digestion of each sample was diluted to 0.1 mol/L HNO3. The amount of total iron was determined by inductively coupled plasma optical emission spectrometry (ICP-OES) method.
Preparation of the standard calibration curves
Calibration curve of iron working standards
Human oxygenated hemoglobin (oxyHb) was prepared as a standard from blood samples.31 Human methemoglobin (metHb) was prepared as a standard from oxyHb by treatment with sodium nitrite.31 Furthermore, saccharated ferric oxide was purchased from Nichiikou Inc., (Toyama, Japan). Stock solutions containing human hemoglobins (oxyHb, metHb) and saccharated ferric oxide as a control were prepared in water to mimic the effects of iron found in cyst fluid samples. We diluted the stock solution to produce calibration solutions with various concentrations of saccharated ferric oxide, oxyHb and metHb. Calibration solutions in the 30 ml plastic tubes fixed in agarose phantoms were placed in the MR apparatus and then measured.32
Calibration curve of ex vivo R2 value for iron estimation in cyst fluid samples
The cyst fluid collection comprises 22 samples from patients with OE (n = 16) or EAOC (n = 6) after surgery. The cyst fluid samples in the 30 ml plastic tube were then agar-embedded for ex vivo MR relaxometry. The same samples were also used for total iron quantifications by the biochemical ICP-OES method. A calibration curve for ex vivo R2 value and total iron concentration was constructed.
Calibration curve of in vivo R2 value for iron estimation in cyst fluid samples
MR relaxometry was employed for preoperative imaging in patients with OE (n = 35) and EAOC (n = 12). After in vivo MR relaxometry measurement, total iron concentrations were determined in the samples collected at the surgery.
Correlation between ex vivo R2 value and in vivo R2 value
We compared the R2 value of the cyst fluid samples (OE, n = 12; EAOC, n = 5) between in vivo and ex vivo MR relaxometry. A calibration curve for in vivo and ex vivo R2 value was constructed. Comparison of in vivo and ex vivo MR relaxometry can examine the effects of individual variability.
Evaluation of the diagnostic potential of total iron concentration and R2 value for EAOC
The receiver operating characteristics (ROC) curve analysis was conducted to ascertain the utility of total iron concentration and R2 value in discriminating between benign OE and EAOC.
Statistical analysis
Differences between groups of patients as defined in Fig. 1 were estimated by Mann-Whitney U test. Analyses were performed by SPSS (version 21.0, IBM Corp., Armonk, NY, USA). Multiple linear regression analysis was used to evaluate the contribution of each confounding factor for the R2 value. The ROC curve analysis was used to identify the best discriminating threshold of both parameters for differential diagnosis between EAOC and endometriosis. Statistical significance was assumed at a two-sided P-value lower than 0.05.
Results
Cyst fluid total iron concentrations
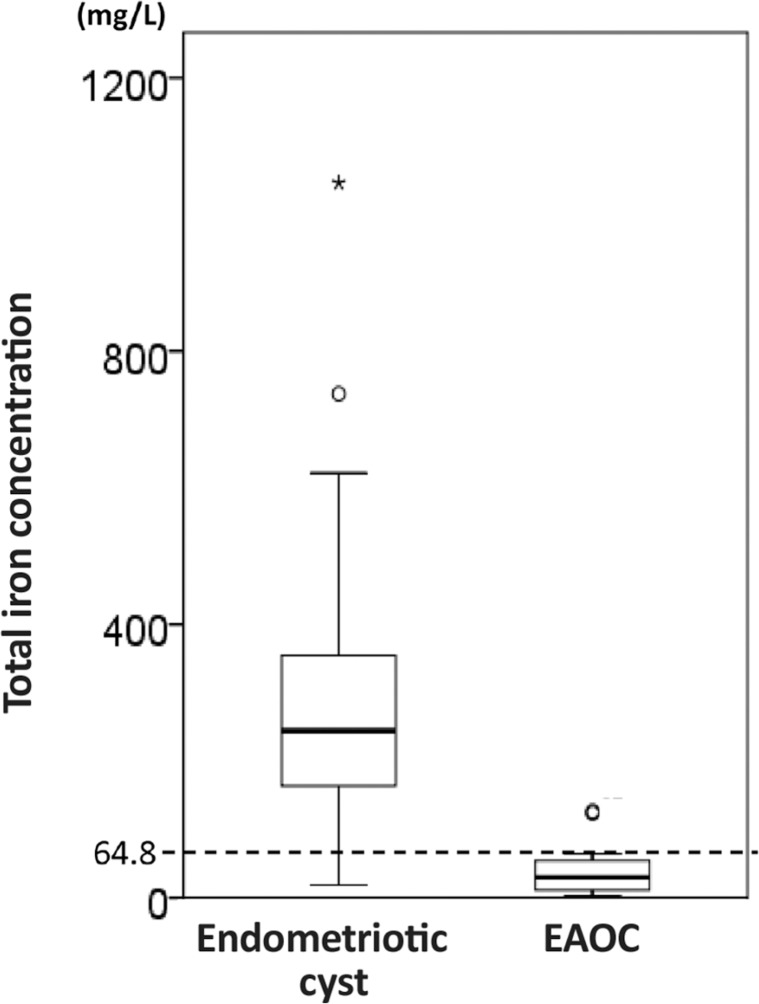
Patient demographic factors and tumor histology and characteristics have been summarized in Table 1. The coefficient of variation of total iron concentrations determined by biochemical ICP-OES analysis for samples was within 5.0%. Box and whisker plots of the total iron concentrations by cyst type (OE [n = 54] and EAOC [n = 13]) are shown in Fig. 2. Total iron concentration in all samples ranged from 3.0 to 1,046.3 mg/l. The mean (± SD) levels were 302.0 ± 203.2 (range, 65.3 – 1046.3 mg/l) and 33.0 ± 36.6 mg/l (range, 3.0–123.8 mg/l) in OE and EAOC, respectively. Cyst fluid total iron levels were significantly lower in patients with EAOC than in OE (P <0.001). The ROC curves were used to compare the power of total iron levels in predicting EAOC from OE. The optimal cutoff point was 64.8 mg/l (sensitivity, 85%; specificity, 98%). Total iron levels were not correlated with age or cyst size (data not shown).
Table 1.
Patient demographics and tumor characteristics
| Patient and clinical characteristics | Endometriotic cysts | EAOC | P-value |
|---|---|---|---|
| number | 67 | 15 | |
| age | |||
| median (range) | 39 (21–62) | 48 (38–69) | <0.001 |
| mean ± SD | 38.9 ± 7.7 | 49.2 ± 8.8 | |
| premenopause | 65 | 10 | 0.002 |
| nulliparous | 35 | 8 | >0.05 |
| cyst size (mm)* | |||
| median (range) | 65 (27–193) | 110 (42–225) | <0.001 |
| median (range) interval between in vivo MR examination and surgery (day) | 1 (0–157) | 1 (0–32) | >0.05 |
| median (range) interval between surgery and ex vivo MR examination (day) | 14.5 (1–83) | 22.5 (0–86) | >0.05 |
| FIGO stage | – | Ia (n = 8), Ib (n = 1), Ic (n = 6) | |
| Pathology | endometriosis | clear cell carcinoma (n = 9) endometrioid carcinoma (n = 3) mixed-type carcinoma (n = 1) seromucinous carcinoma (n = 1) undifferentiated carcinoma (n = 1) |
|
maximum diameter of tumors.
Fig 2.
Cyst fluid total iron levels in patients with OE and EAOC. Cyst fluid total iron levels were measured in patients with OE (n = 54) and EAOC (n = 13). This figure shows the distribution of total iron levels for each studied group. EAOC patients showed decreased cyst fluid total iron concentration compared to OE women by biochemical measurement (P <0.001).
The validation study
We investigated the potential of in vivo R2 value to quantitate the cyst fluid total iron concentration. The validation of the MR relaxometry was achieved in four independent examinations as described below.
Phantom experiments: The calibration curve of R2 value and total iron concentration
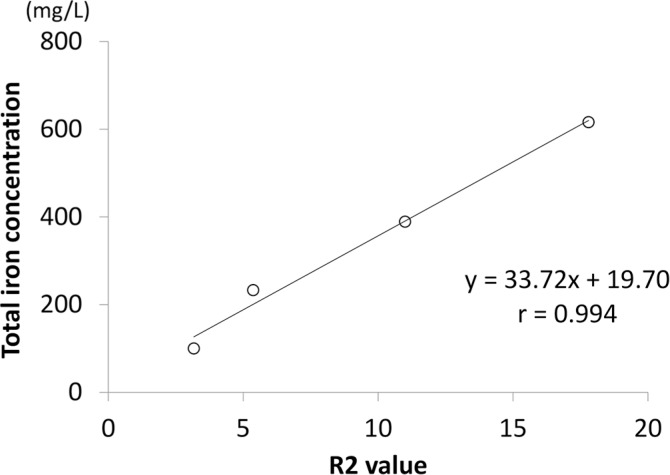
The R2 value showed a positive correlation with iron concentration of metHb (Fig. 3). We also confirmed a linear relationship between the R2 value and saccharated ferric oxide or human oxyHb (data not shown).
Fig 3.
Correlation between the ex vivo R2 value and iron working standards. This figure shows the calibration of R2 model for iron estimation. Plastic test tubes were filled with 30 ml of different concentrations of methemoglobin. Calibration solutions in the plastic tubes fixed in agarose phantoms were analyzed by the HISTO sequence applied to the 3T-system. There was a good correlation between R2 value and total iron concentration (r = 0.994). The strong linear correlation between R2 value and iron concentration led to the calibration equation y [total iron] = 33.72 × [ex vivo R2] + 19.70. These experiments were repeated twice.
Correlation between ex vivo R2 value and cyst fluid total iron concentration
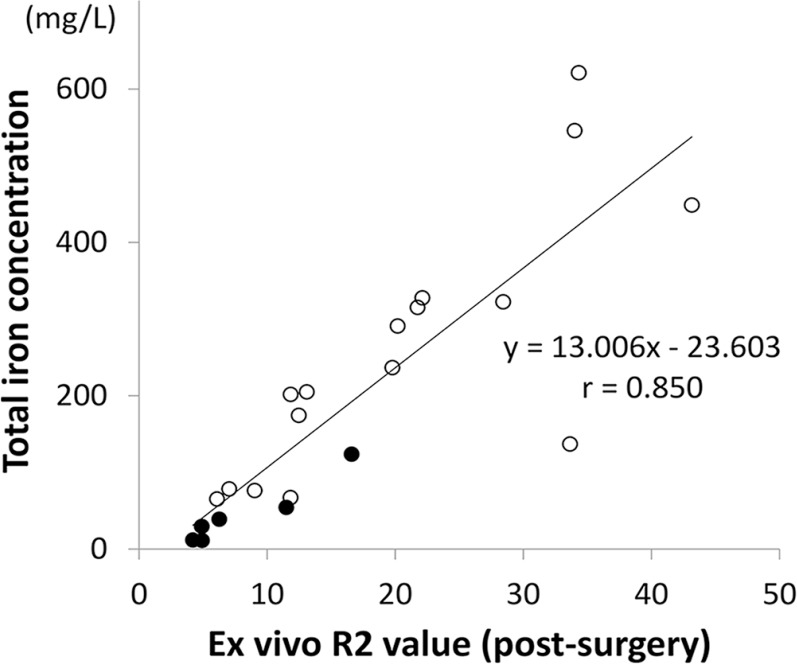
Ex vivo R2 value showed a strong positive correlation with total iron concentrations in cyst fluid samples [total iron] = 13.006 × [ex vivo R2] – 23.603 (r = 0.850) (Fig. 4).
Fig 4.
Comparison of the ex vivo R2 value and the cyst fluid total iron concentration. Cyst fluid samples (n = 22) were used for both biochemical analysis and ex vivo MR spectroscopic imaging scan. Plastic tubes filled with 30 ml of cyst fluids were also measured by the ex vivo MR spectroscopy data of a phantom. Ex vivo R2 values are shown on the x axes. The y axes represent the total iron concentrations quantitated by the ICP-OES method in OE or EAOC. Ex vivo R2 value showed good correlation with the cyst fluid total iron concentration (r = 0.850). ○, OE (n = 16); •, EAOC (n = 6).
Correlation between in vivo R2 value and total iron concentration
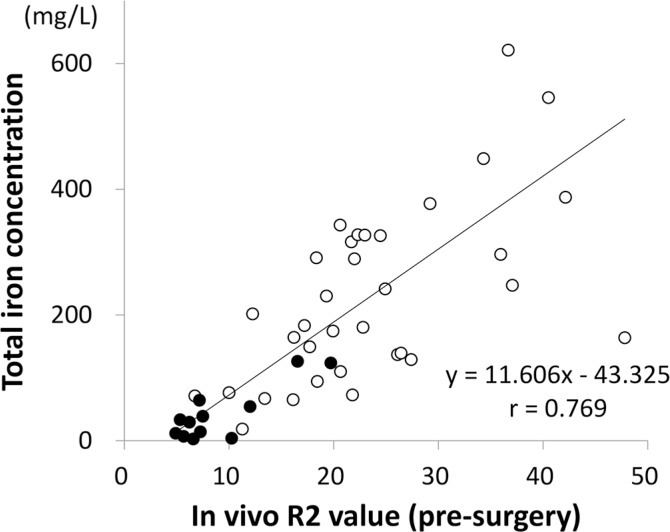
We evaluated the potential correlation between the in vivo R2 value of cyst fluid and the quantitation of total iron concentration through the biochemical measurement in 47 surgical samples. Total iron concentration positively correlated with the in vivo R2 value (Fig. 5).
Fig 5.
Correlation between in vivo R2 value and cyst fluid total iron concentrations. This figure shows the correlation between in vivo R2 value and cyst fluid iron concentrations. In vivo R2 value showed excellent correlation with the cyst fluid total iron concentration ([total iron] = 11.606 × [in vivo R2] – 43.325, r = 0.769). ○, OE (n = 35); •, EAOC (n = 16).
The relationship between in vivo R2 value and ex vivo R2 value
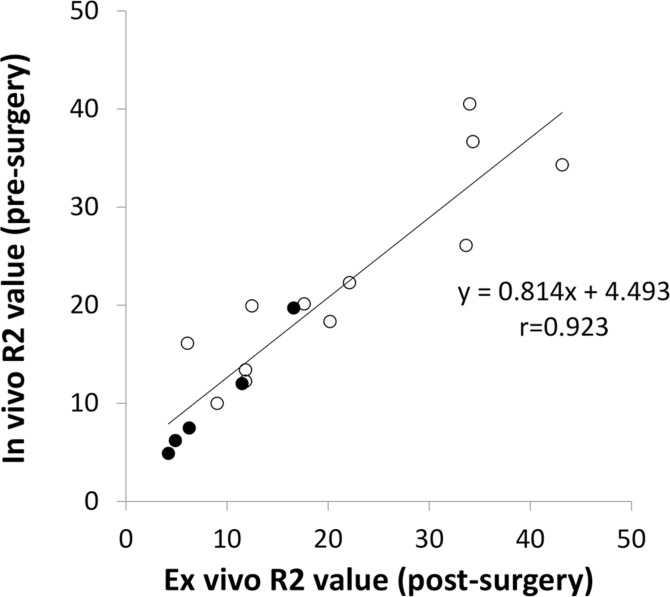
After the measurement of in vivo R2 value, cyst fluids were collected. We compared the in vivo and ex vivo R2 value of 17 cyst fluid samples from the same individuals (OE, n = 12; EAOC, n = 5) (Fig. 6). A positive correlation was observed between in vivo and ex vivo R2 values (r = 0.923). The in vivo R2 value was deduced to be 0.814 from the slope of the ex vivo R2 value.
Fig 6.
The relationship of cyst fluid R2 value between in vivo (pre-surgical) and ex vivo (post-surgical) studies. We examined the use of in vivo and ex vivo R2 values in patients with OE and EAOC. There were significant positive correlations between in vivo R2 value and ex vivo R2 value. The data were analyzed by linear regression to yield the equations: [in vivo R2 value] = 0.814 × [ex vivo R2 value] + 4.493. ○, OE (n = 12); •, EAOC (n = 5).
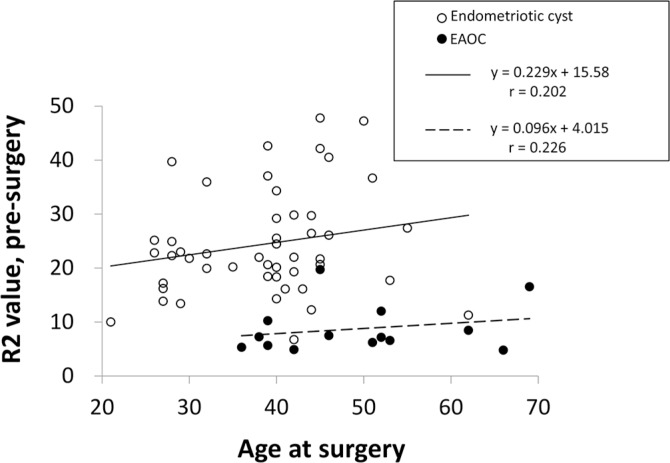
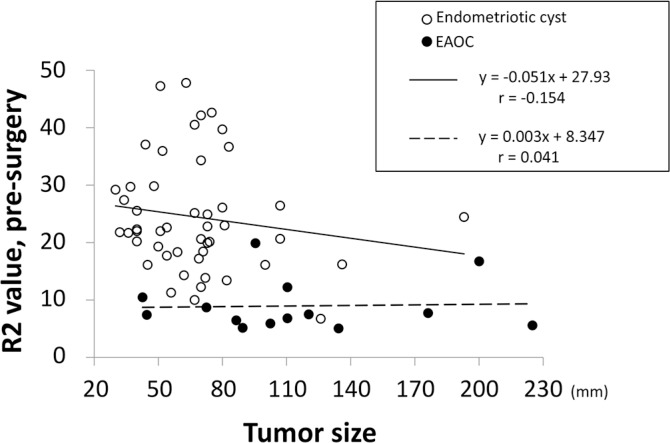
Since the two groups of patients are not homogeneous with respect to the age distribution, we analyzed the correlation between age and R2 value. In analyses of data from OE and EAOC subjects, the in vivo R2 value was unrelated to age: [in vivo R2 value for OE] = 0.229 × [age] + 15.58, r = 0.202. [in vivo R2 value for EAOC] = 0.096 × [age] + 4.015, r = 0.226, P = 0.709 (Fig. 7). We did not find any correlation between cyst fluid R2 value and age at surgery. Furthermore, no association of the R2 value with cyst size was also found: [in vivo R2 value for OE] = −0.051 × [cyst size] + 27.93, r = −0.154. [in vivo R2 value for EAOC] = 0.003 × [cyst size] + 8.347, r = 0.041 (Fig. 8).
Fig 7.
Correlation between cyst fluid R2 value and age at surgery in endometriosis and EAOC. In a subset of 62 patients, comprising endometriosis (open circle, n = 48) and EAOC (closed circle, n = 14), in vivo R2 values were measured in cyst fluids. No significant relations between cyst fluid R2 value and age at surgery are seen, exhibiting an adjusted r of 0.202 and 0.226. Compared to OE, EAOC exhibit a decreased level of in vivo R2 value, regardless of their age.
Fig 8.
Correlation between cyst fluid R2 value and cyst size in endometriosis and EAOC. In a subset of 62 patients, comprising endometriosis (open circle, n = 48) and EAOC (closed circle, n = 14), in vivo R2 values were measured in cyst fluids. No significant relations between cyst fluid R2 value and cyst size are seen, exhibiting an adjusted r of −0.154 and 0.041. Compared to OE, EAOC exhibit a decreased level of in vivo R2 value, regardless of their cyst size.
Evaluation of in vivo R2 value as a potential biomarker for differential diagnosis between EAOC and OE
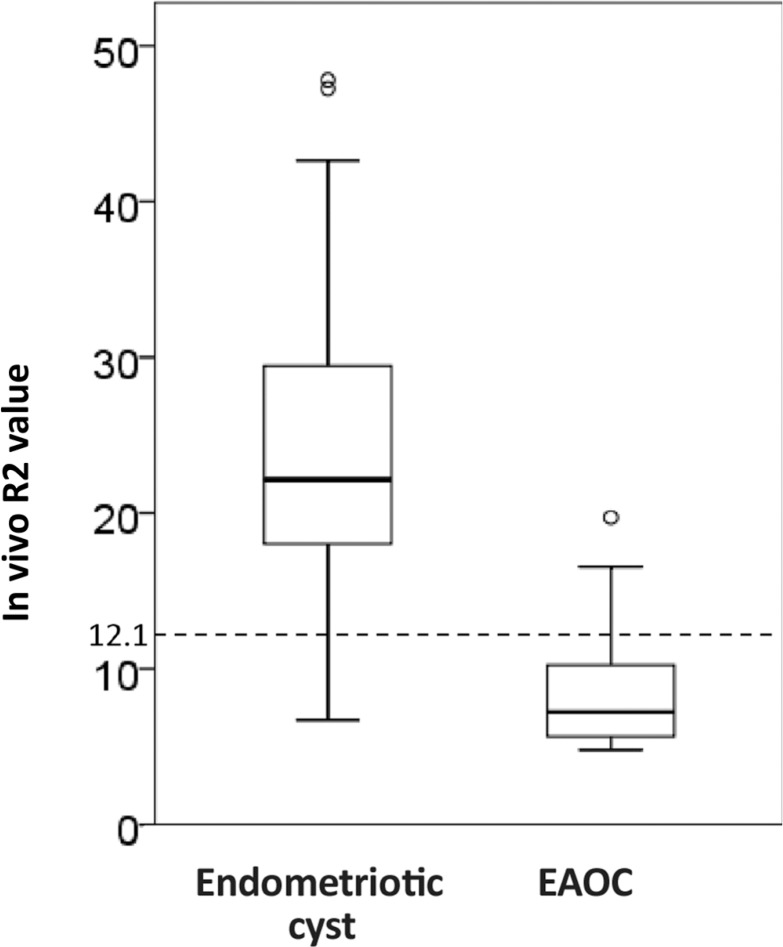
Box and whisker plots of in vivo R2 value by cyst type (OE, n = 48; EAOC, n = 14) were shown in Fig. 9. The median value and range for R2 value were 22.2 (6.73–47.8) and 7.2 (4.8–19.7) in the OE and EAOC groups, respectively. Mean values ± SD of these groups were also different (24.4 ± 9.8 vs. 8.7 ± 4.5). In vivo R2 value was significantly lower in the EAOC group compared with the OE group (P < 0.001).
Fig 9.
The distribution of cyst fluid in vivo R2 value in patients with OE cysts and EAOC. This figure shows the distribution of in vivo R2 values for patients with OE (n = 48) and EAOC (n = 14). The dashed horizontal line represents the cut-off level for in vivo R2 value. In vivo R2 value less than 12.1 was predictive for malignancy.
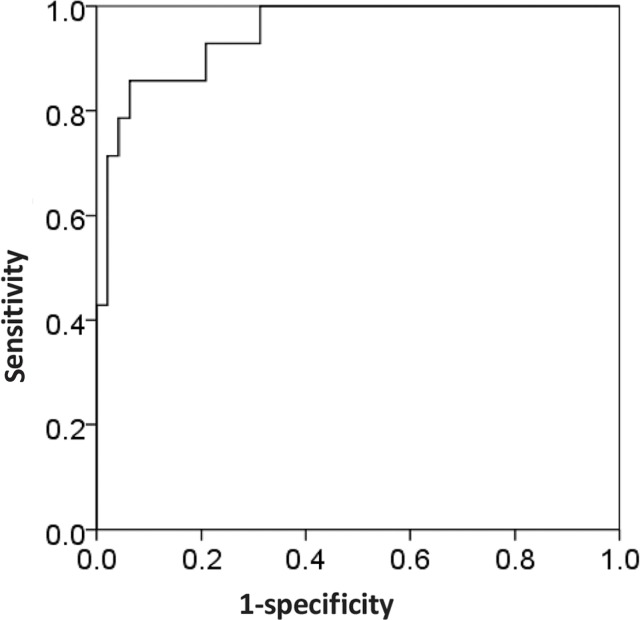
The ROC curve analysis was conducted to ascertain the utility of in vivo R2 value in discriminating between OE and EAOC (Fig. 10). The in vivo R2 value of 12.1 sec−1 yielded a sensitivity of 86%, a specificity of 94%, a positive predictive value of 80% and a negative predictive value of 96% for differential diagnosis of EAOC in benign OE patients.
Fig 10.
Receiver operating characteristic curves (ROC) of cyst fluid in vivo R2 value in patients with OE and EAOC. The best cut off point for malignant transformation of OE established by the ROC curve was 12.1, showing a sensitivity of 86%, specificity of 94%, positive predictive value of 80% and negative predictive value of 96%.
Discussion
This series reports the use of MR relaxometry to estimate total iron concentrations in the endometriotic cyst fluid. We compared the theoretical method (in vivo and ex vivo R2 value) and true iron quantification method (biochemical measurement) to assess the analytical validity of R2 value measurements. The validity of in vivo R2 value was supported by ex vivo R2 value and total iron concentration data (Figs. 4–6). We found a strong linear correlation between these two methods. A novel equation predicts the cyst fluid total iron concentration (mg of total iron/L of cyst fluid = 11.606 × [in vivo R2 value (sec−1)] − 43.325). MR relaxometry can potentially be a useful method for non-invasive estimation for total iron concentration. Importantly, no adverse events associated with multi-echo MR relaxometry were reported in any patient.
Next, EAOC patients showed significantly decreased R2 values compared to OE (Fig. 9). A cut-off value of 12.1 to classify patients as OE or having EAOC yielded 86% sensitivity, 94% specificity, 80% positive predictive value and 96% negative predictive value (Fig. 10). Our method provides that in vivo R2 value less than 12.1 may be a predictor of malignant transformation. The R2 measurement seems to be a safe, non-invasive and quantitative tool for prediction of malignant transformation of OE. Therefore, in vivo R2 value estimation can provide important new information about not only the accuracy of cyst fluid iron quantification, but also differential diagnosis between EAOC and OE.
Routine MR imaging has high sensitivity and specificity for the detection of hemorrhagic content and diagnosis of OE.33 The T2 shading sign is sensitive for OE.33 The presence of an enhancing component within a blood-filled ovarian cyst was considered as suggestive of malignant transformation of a pre-existing OE. The most sensitive MR imaging sign of malignancy in OE is a review of subtraction images.34 As described in previous studies,35,36 our results also show that EAOC patients have enhanced mural nodules. In addition, a majority of EAOC show large cysts and high or intermediate signal intensity on T2-weighted images. Previous studies have demonstrated that the sensitivity, specificity and accuracy for malignancy were 98%, 93%, and 95%, respectively, supporting that contrast-enhanced MR imaging is an accurate method for evaluating the malignancy of adnexal lesions.37 Collectively, transverse relaxation rate technology (sensitivity and specificity: 86% and 94%) might be equal to routine MRI as an imaging modality in the assessment of malignancy. Although dynamic contrast-enhanced MR imaging can help to differentiate malignant adnexal masses from benign OE, the diagnostic difficulty still remains in patients without the presence of mural nodules within a cystic mass. Therefore, alternative modalities such as transverse relaxation rate technology are needed. The possibility of a malignant change would be considered if a cyst fluid shows R2 value < 12.1 on transverse relaxation rate technique. However, a need exists for high quality trials with adequate sample sizes to establish clearly the effects of this modality. Future studies will be focused on the potential role of MR relaxometry as a marker for the early detection of borderline malignancy or to enhance our knowledge on a complex, multistep biological process driving OE carcinogenesis.
Evidence suggests that the major pathophysiology associated with OE carcinogenesis is local iron overload.3 The homeostatic redox control is achieved by a fine-tuned balance between oxidant and anti-oxidant molecules. Heme and iron overload in OE cysts results in oxidative stress and causes distortion in the redox balance. Oxidant/antioxidant balance function can serve as a double-edged sword, promoting cell death or carcinogenesis.38,39 OE patients showed significantly increased R2 values (Fig. 9) or higher iron levels compared to EAOC (Fig. 2). Excess iron-induced oxidative stress could trigger DNA damage and cell death, rather than malignant transformation.40 In contrast, patients with EAOC had significantly lower iron levels compared to women with OE. Thus, EAOC might be associated with an effective and optimal antioxidant defense. Upregulation of antioxidant functions in OE cyst may be a molecular event which results in restoration of cell survival, increased chances of accumulation of epigenetic and genetic alterations, and subsequent increase in malignant transformation potential.38 The changes of redox balance highlight diverse features involved in hemoglobin, heme and iron homeostasis and the pathogenesis of malignant transformation of OE.
Our study has several limitations. First limitation was the relatively small sample number of patients. Small patient numbers and other factors such as patient age, menopause state, other imaging features may affect our conclusion. Larger cohort studies comparing clinical applicability, discriminative potential, diagnostic accuracy and the predictive values are required to determine in future the optimal test in women with OE or patients with malignant potential. Second, what we actually measured are changes in the spin-spin relaxation time T2 (R2 = 1/T2) using a single-voxel, multi-echo MR sequence (HISTO). However, changes in T2 could be caused by any ferromagnetic substance in the cysts, not only iron. Therefore, we must test for other magnetic substances than iron. Finally, there is a wide range in the time interval between imaging and cyst fluid analysis, which would affect observations related to iron content.
In conclusion, MR relaxometry may be an accurate approach to determine the cyst fluid total iron concentration and represent a non-invasive method to predict malignant transformation of OE. This method might be clinically useful to differentiate EAOC from OE and to select patients for clinical decision making for surgical intervention instead of surveillance.
Footnotes
Disclosure Statement
The authors declare that the research was conducted in the absence of any commercial or financial relationships that could be construed as a potential conflict of interest.
References
- 1.Cramer DW, Missmer SA. The epidemiology of endometriosis. Ann N Y Acad Sci 2002; 955:11–22. [DOI] [PubMed] [Google Scholar]
- 2.Kobayashi H, Sumimoto K, Moniwa N, et al. Risk of developing ovarian cancer among women with ovarian endometrioma: a cohort study in Shizuoka, Japan. Int J Gynecol Cancer 2007; 17:37–43. [DOI] [PubMed] [Google Scholar]
- 3.Yamaguchi K, Mandai M, Toyokuni S, et al. Contents of endometriotic cysts, especially the high concentration of free iron, are a possible cause of carcinogenesis in the cysts through the iron-induced persistent oxidative stress. Clin Cancer Res 2008; 14:32–40. [DOI] [PubMed] [Google Scholar]
- 4.Acién P, Velasco I. Endometriosis: a disease that remains enigmatic. ISRN Obstet Gynecol 2013; 2013:242149. [DOI] [PMC free article] [PubMed] [Google Scholar]
- 5.Zafrakas M, Grimbizis G, Timologou A, Tarlatzis BC. Endometriosis and ovarian cancer risk: a systematic review of epidemiological studies. Front Surg 2014; 1:14. [DOI] [PMC free article] [PubMed] [Google Scholar]
- 6.Pirdel L, Pirdel M. Role of iron overload-induced macrophage apoptosis in the pathogenesis of peritoneal endometriosis. Reproduction 2014; 147:R199–R207. [DOI] [PubMed] [Google Scholar]
- 7.Koshiyama M, Matsumura N, Konishi I. Recent concepts of ovarian carcinogenesis: type I and type II. Biomed Res Int 2014; 2014:934261. [DOI] [PMC free article] [PubMed] [Google Scholar]
- 8.Toyokuni S. Iron overload as a major targetable pathogenesis of asbestos-induced mesothelial carcinogenesis. Redox Rep 2014; 19:1–7. [DOI] [PMC free article] [PubMed] [Google Scholar]
- 9.Toyokuni S. Mysterious link between iron overload and CDKN2A/2B. J Clin Biochem Nutr 2011; 48:46–49. [DOI] [PMC free article] [PubMed] [Google Scholar]
- 10.Yoshimoto C, Iwabuchi T, Shigetomi H, Kobayashi H. Cyst fluid iron-related compounds as useful markers to distinguish malignant transformation from benign endometriotic cysts. Cancer Biomark 2015; 15:493–499. [DOI] [PubMed] [Google Scholar]
- 11.Bianek-Bodzak A, Szurowska E, Sawicki S, Liro M. The importance and perspective of magnetic resonance imaging in the evaluation of endometriosis. Biomed Res Int 2013; 2013:436589. [DOI] [PMC free article] [PubMed] [Google Scholar]
- 12.Bezabeh T, Ijare OB, Nikulin AE, Somorjai RL, Smith IC. MRS-based Metabolomics in Cancer Research. Magn Reson Insights 2014; 7:1–14. [DOI] [PMC free article] [PubMed] [Google Scholar]
- 13.Bartzokis G, Aravagiri M, Oldendorf WH, Mintz J, Marder SR. Field dependent transverse relaxation rate increase may be a specific measure of tissue iron stores. Magn Reson Med 1993; 29:459–464. [DOI] [PubMed] [Google Scholar]
- 14.Mitsumori F, Watanabe H, Takaya N. Estimation of brain iron concentration in vivo using a linear relationship between regional iron and apparent transverse relaxation rate of the tissue water at 4.7T. Magn Reson Med 2009; 62:1326–1330. [DOI] [PubMed] [Google Scholar]
- 15.Adisetiyo V, Jensen JH, Ramani A, et al. In vivo assessment of age-related brain iron differences by magnetic field correlation imaging. J Magn Reson Imaging 2012; 36:322–331. [DOI] [PMC free article] [PubMed] [Google Scholar]
- 16.Moon HJ, Chang Y, Lee YS, et al. A comparison of MRI tissue relaxometry and ROI methods used to determine regional brain iron concentrations in restless legs syndrome. Med Devices 2015; 8:341–350. [DOI] [PMC free article] [PubMed] [Google Scholar]
- 17.Löbel U, Schweser F, Nickel M, et al. Brain iron quantification by MRI in mitochondrial membrane protein-associated neurodegeneration under iron-chelating therapy. Ann Clin Transl Neurol 2014; 1:1041–1046. [DOI] [PMC free article] [PubMed] [Google Scholar]
- 18.Bonkovsky HL, Rubin RB, Cable EE, Davidoff A, Rijcken TH, Stark DD. Hepatic iron concentration: noninvasive estimation by means of MR imaging techniques. Radiology 1999; 212:227–234. [DOI] [PubMed] [Google Scholar]
- 19.St Pierre TG, Clark PR, Chua-Anusorn W. Measurement and mapping of liver iron concentrations using magnetic resonance imaging. Ann N Y Acad Sci 2005; 1054:379–385. [DOI] [PubMed] [Google Scholar]
- 20.St Pierre TG, Clark PR, Chua-anusorn W, et al. Noninvasive measurement and imaging of liver iron concentrations using proton magnetic resonance. Blood 2005; 105:855–861. [DOI] [PubMed] [Google Scholar]
- 21.Gandon Y, Olivié D, Guyader D, et al. Non-invasive assessment of hepatic iron stores by MRI. Lancet 2004; 363:357–362. [DOI] [PubMed] [Google Scholar]
- 22.Pineda N, Sharma P, Xu Q, Hu X, Vos M, Martin DR. Measurement of hepatic lipid: high-speed T2-corrected multiecho acquisition at 1H MR spectroscopy—a rapid and accurate technique. Radiology 2009; 252:568–576. [DOI] [PubMed] [Google Scholar]
- 23.Tang H, Jensen JH, Sammet CL, et al. MR characterization of hepatic storage iron in transfusional iron overload. J Magn Reson Imaging 2014; 39:307–316. [DOI] [PMC free article] [PubMed] [Google Scholar]
- 24.Westwood M, Anderson LJ, Firmin DN, et al. A single breath-hold multiecho T2* cardiovascular magnetic resonance technique for diagnosis of myocardial iron overload. J Magn Reson Imaging 2003; 18:33–39. [DOI] [PubMed] [Google Scholar]
- 25.Wood JC, Ghugre N. Magnetic resonance imaging assessment of excess iron in thalassemia, sickle cell disease and other iron overload diseases. Hemoglobin 2008; 32:85–96. [DOI] [PMC free article] [PubMed] [Google Scholar]
- 26.Szumowski J, Bas E, Gaarder K, Schwarz E, Erdogmus D, Hayflick S. Measurement of brain iron distribution in Hallevorden-Spatz syndrome. J Magn Reson Imaging 2010; 31:482–489. [DOI] [PubMed] [Google Scholar]
- 27.Sampson JA. Endometrial carcinoma of the ovary, arising in endometrial tissue in that organ. Arch Surg 1925;10:1–72. [Google Scholar]
- 28.Scott RB. Malignant changes in endometriosis. Obstet Gynecol 1953; 2:283–289. [PubMed] [Google Scholar]
- 29.Hasegawa T, Inagaki K, Haraguchi H. Multielement correlation analysis of major-to-trace elements in human blood serum for medical diagnosis as studied by ICP-AES and ICP-MS. Anal Sci 2001; 17:i979–i982. [Google Scholar]
- 30.Wang ZJ, Haselgrove JC, Martin MB, et al. Evaluation of iron overload by single voxel MRS measurement of liver T2. J Magn Reson Imaging 2002; 15:395–400. [DOI] [PubMed] [Google Scholar]
- 31.Antonini E, Brunori M. Hemoglobin. Annu Rev Biochem 1970; 39:977–1042. [DOI] [PubMed] [Google Scholar]
- 32.Jensen JH, Tang H, Tosti CL, et al. Separate MRI quantification of dispersed (ferritin-like) and aggregated (hemosiderin-like) storage iron. Magn Reson Med 2010; 63:1201–1209. [DOI] [PMC free article] [PubMed] [Google Scholar]
- 33.Lo Monte G, Wenger JM, Petignat P, Marci R. Role of imaging in endometriosis. Cleve Clin J Med 2014; 81:361–366. [DOI] [PubMed] [Google Scholar]
- 34.McDermott S, Oei TN, Iyer VR, Lee SI. MR imaging of malignancies arising in endometriomas and extraovarian endometriosis. Radiographics 2012; 32:845–863. [DOI] [PubMed] [Google Scholar]
- 35.Tanaka YO, Yoshizako T, Nishida M, Yamaguchi M, Sugimura K, Itai Y. Ovarian carcinoma in patients with endometriosis: MR imaging findings. Am J Roentgenol 2000; 175:1423–1430. [DOI] [PubMed] [Google Scholar]
- 36.Tanaka YO, Okada S, Yagi T, et al. MRI of endometriotic cysts in association with ovarian carcinoma. Am J Roentgenol 2010; 194:355–361. [DOI] [PubMed] [Google Scholar]
- 37.Guerra A, Cunha TM, Félix A. Magnetic resonance evaluation of adnexal masses. Acta Radiol 2008; 49:700–709. [DOI] [PubMed] [Google Scholar]
- 38.Iwabuchi T, Yoshimoto C, Shigetomi H, Kobayashi H. Oxidative stress and antioxidant defense in endometriosis and its malignant transformation. Oxid Med Cell Longev 2015; 2015:848595. [DOI] [PMC free article] [PubMed] [Google Scholar]
- 39.Acharya A, Das I, Chandhok D, Saha T. Redox regulation in cancer: a double-edged sword with therapeutic potential. Oxid Med Cell Longev 2010; 3:23–34. [DOI] [PMC free article] [PubMed] [Google Scholar]
- 40.Ke Y, Ming Qian Z. Iron misregulation in the brain: a primary cause of neurodegenerative disorders. Lancet Neurol 2003; 2:246–253. [DOI] [PubMed] [Google Scholar]


