Abstract
Purpose
To investigate the ability of slip interface imaging (SII), a recently developed magnetic resonance elastography (MRE)‐based technique, to predict the degree of meningioma–brain adhesion, using findings at surgery as the reference standard.
Materials and Methods
With Institutional Review Board approval and written informed consent, 25 patients with meningiomas >2.5 cm in maximal diameter underwent preoperative SII assessment. Intracranial shear motions were introduced using a soft, pillow‐like head driver and the resulting displacement field was acquired with an MRE pulse sequence on 3T MR scanners. The displacement data were analyzed to determine tumor–brain adhesion by assessing intensities on shear line images and raw as well as normalized octahedral shear strain (OSS) values along the interface. The SII findings of shear line images, OSS, and normalized OSS were independently and blindly correlated with surgical findings of tumor adhesion by using the Cohen's κ coefficient and chi‐squared test.
Results
Neurosurgeons categorized the surgical plane as extrapial (no adhesion) in 15 patients, mixed in four, and subpial (adhesion) in six. Both shear line images and OSS agreed with the surgical findings in 18 (72%) cases (fair agreement, κ = 0.37, 95% confidence interval [CI]: 0.05–0.69), while normalized OSS was concordant with the surgical findings in 23 (92%) cases (good agreement, κ = 0.86, 95% CI: 0.67–1). The correlation between SII predictions (shear line images, OSS, and normalized OSS) and the surgical findings were statistically significant (chi‐squared test, P = 0.02, P = 0.02, and P < 0.0001, respectively).
Conclusion
SII preoperatively evaluates the degree of meningioma–brain adhesion noninvasively, allowing for improved prediction of surgical risk and tumor resectability.
Level of Evidence: 1
Technical Efficacy: Stage 1
J. Magn. Reson. Imaging 2017;46:1007–1016.
Keywords: magnetic resonance elastography, slip interface imaging, tumor–brain adhesion, surgical plane, meningioma, octahedral shear strain
Meningiomas are encapsulated brain tumors arising from the arachnoid cells that are typically treated with total resection.1 However, the absence of an arachnoid plane as well as the presence of adhesion between tumor and adjacent brain increases the risk of the surgery.2, 3 Meningioma–brain adhesion typically causes difficult dissection from involved structures including the cortex, vascular structures, and cranial nerves, substantially increasing the risk of stroke or damage to the adjacent brain that may result in permanent neurologic deficits.4 Therefore, the ability to preoperatively determine the presence of a surgically safe plane of dissection would benefit surgical planning, allowing neurosurgeons to more accurately counsel patients on potential surgical complications, length of surgery, and the likelihood of total tumor resection.
Whether or not a surgically safe plane is present depends on the degree of tumor adherence to the adjacent brain tissue. Currently, preoperative imaging methods including computed tomography (CT) and magnetic resonance imaging (MRI) attempt to predict the tumor–brain adhesion by assessing the tumor location, the presence of a peritumoral cerebrospinal fluid (CSF cleft), peritumoral edema, and/or tumor vascularity.5, 6, 7 However, these static methods are rarely effective in evaluating the presence and degree of adhesion, which requires determination of the dynamic relationship between the tumor and its surroundings.8
Slip interface imaging (SII), a recently developed technique, is capable of directly assessing tumor–brain adhesion noninvasively.8, 9 In response to an applied shear force, a tumor without adhesion will slip or move freely at a tumor–brain boundary compared to a tumor that is fixed to the surrounding brain where no relative motion will occur. SII utilizes the principles of MR elastography (MRE) to introduce and record such differential tumor–brain motion.10 The slip interface is reflected by a discontinuity in wave displacement across the tumor–brain boundary. In SII, wave displacement discontinuity can create MR phase variations across the interface that leads to magnitude signal loss within the voxels at the interface. Wave discontinuity can also be detected as large shear strain by the spatial gradient of the displacement. A recent study has shown that nonadherent vestibular schwannomas demonstrated low signal on shear line images and high octahedral shear strain (OSS)11 values along the tumor–brain interface, whereas adherent tumors had neither characteristic.8 However, the value of OSS is not only determined by the bonding at the interface, but is also influenced by the amplitude of the shear motion at the interface. Such amplitude variations exist within the brain because of stiffness contrast, wave attenuation, and scattering, as well as differences of the head positioning for each patient. In order to reduce these variations, a normalized OSS calculation has been developed where the OSS is normalized to the amplitude of the corresponding shear waves.
Hence, the goal of this study was to investigate the ability of SII methods (including shear line imaging, OSS mapping, and normalized OSS mapping) to predict the degree of meningioma–brain adhesion, using findings at surgery as the reference standard.
Materials and Methods
Patients
With Institutional Review Board approval and written informed consent, 25 patients with presumed meningiomas, pathologically proven at surgery, underwent preoperative SII assessment from April 2014 to June 2016. Recurrent tumors and tumors with a maximum diameter <2.5 cm were excluded.
Slip Interface Imaging (SII)
The SII technique is based on MRE pulse sequences and acquisition parameters that have been previously described.8, 10 SII was performed with a single‐shot, flow‐compensated, spin‐echo, echo‐planar‐imaging MRE pulse sequence on a 3T MRI system (Signa Excite, GE Healthcare, Waukesha, WI) with a standard 8‐channel receive‐only head coil. Low‐amplitude mechanical vibrations at 60 Hz were introduced intracranially with a soft, pillow‐like passive driver placed under the subject's head. The resulting displacement field in the brain was acquired with the following: repetition time (TR) / echo time (TE) = 3600/62 msec; field of view (FOV) = 24 cm; readout bandwidth = ±250 kHz; parallel imaging acceleration factor of 3; 48 continuous axial slices (slice thickness = 3 mm); 80 × 80 imaging matrix resulting in 3 mm isotropic resolution; six MRE motion encoding directions with ±x, ± y, ± z; eight MRE phase offsets sampled over one period of the 60‐Hz motion. The acquisition time was under 7 minutes. The coronal and sagittal planes of the displacement field were reconstructed from the axial plane to maximize the visibility of adherent or nonadherent areas during SII analysis.
To visualize and assess tumor adhesion, the shear line images and OSS maps in all three imaging planes were generated from the acquired displacement data by using previously reported algorithms.8 Briefly, shear line imaging is based on the phenomenon of motion‐induced signal loss at the tumor–brain interface caused by intravoxel phase dispersion (IVPD).9, 12 To differentiate the signal loss created by IVPD from the inherent MR signal contrast in the image, a pseudo‐magnitude filter analysis was performed by creating complex images with unit magnitude and phase equal to the phase of the complex images just acquired. Signal loss was then produced by lowpass filtering the new complex images using a Gaussian lowpass filter with a standard deviation of the point‐spread function of 1.88 mm. The final shear line image represents the magnitude of the filtered complex images. The presence of a low‐friction slip interface is visualized as low signal intensity on the shear line image. In addition to shear line images, OSS maps were calculated as previously described (eq. 7, Ref. 11). OSS provides a measure of the total shear deformation occurring at a point under a general 3D state of strain. A slip interface results in high values along the tumor contour on OSS maps due to large shear strain from the displacement discontinuity. To understand how wave amplitude, apart from bonding at the interface, affects the OSS predictions of adhesion, a normalized OSS map was generated by normalizing OSS to the combined amplitude (square root of sum of squares) of the first harmonic of the complex x‐, y‐, and z‐axis shear waves.
SII Prediction of Meningioma–Brain Adhesion
SII results including shear line images, OSS maps, and normalized OSS maps were evaluated blinded to the surgical results. The degree of tumor–brain adhesion was classified as follows: 1) complete slip interface, in which a clear low signal shear line or a high‐valued OSS contour could be traced on more than 2/3 of the meningioma–brain interface, indicating little or no adhesion (Fig. 2); 2) partial slip interface, in which a clear low signal shear line or a high‐valued OSS contour could be traced on more than 1/3 and less than 2/3 of the interface (Fig. 3), indicating partial adhesion; and 3) no slip interface, in which a clear low signal shear line or a high‐valued OSS contour could be traced on less than 1/3 of the interface, indicating near complete adhesion (Fig. 4). A tumor was considered as extrapial (non‐adherent) if it had a complete slip interface; mixed if a partial slip interface was detected; and subpial (adherent) if no slip interface was identified. Based on the above criteria, SII predictions of complete, partial, and no slip interface were evaluated prospectively by a neuroradiologist (J.H., with 26 years of experience in neuroradiology) blinded to the surgical findings.
Figure 2.
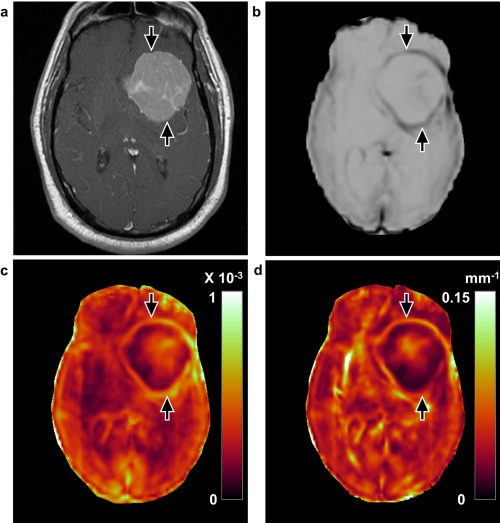
Concordant case with a complete slip interface at imaging and no adhesion at surgery (case 14, 63‐year‐old male). a: T 1‐weighted image with contrast enhancement shows a large left medial sphenoid wing meningioma. The tumor–brain interface is clearly defined with the (b) shear line image, (c) OSS map, and (d) normalized OSS map (arrows), indicating the presence of the slip interface and no adhesion. Surgical findings demonstrated that the dissection plane was nearly completely extrapial with no meningioma–brain adhesion encountered.
Figure 3.
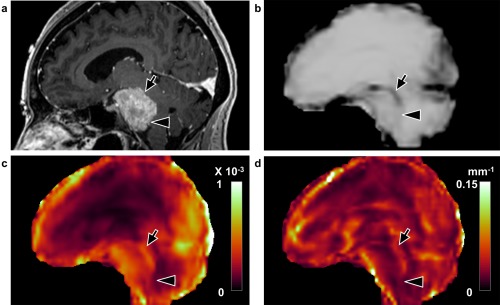
Concordant case with a partial slip interface at imaging and partial adhesion at surgery (case 17, 49‐year‐old female). a: Sagittal T 1‐weighted image with contrast enhancement shows a petroclival meningioma. The tumor–brain interface is partially defined in the (b) shear line image, (c) OSS map, and (d) normalized OSS map with arrows indicating the presence of a slip interface and arrowheads indicating the absence of a slip interface, suggesting the tumor was partially adherent to the brainstem. At surgery the dissection plane was also classified as mixed adhesion, corresponding to the SII findings.
Figure 4.
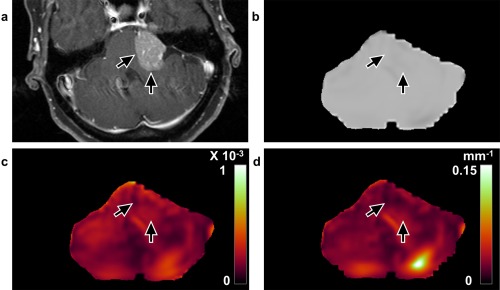
Concordant case with no slip interface on imaging and adhesion at surgery (case 22, 55‐year‐old, female). a: T 1‐weighted image with contrast enhancement shows a left cerebellopontine angle meningioma. No apparent slip interface is identified with the (b) shear line image, (c) OSS map, or (d) normalized OSS map (arrows), suggesting tumor–brainstem and tumor–cerebellum adhesion. Surgical findings demonstrated a subpial plane with meningioma–brain adhesion and a very difficult resection.
Surgical Grading of Meningioma–Brain Adhesion
The neurosurgeons' (J.J.V.G., with 10 years of experience in neurosurgery, and M.J.L., with 18 years of experience in neurosurgery) findings at resection, blinded to SII results, were considered the reference standard. All dissection features, including the degree of tumor adherence, the surgeon's impression of tumor dissection from the underlying brain, as well as the quality of the gross removal were recorded. The surgical plane as well as tumor adherence was graded as follows:
1) Extrapial: non‐adhesive tumor separated from the pial surface; a clear surgical plane was found between the tumor capsule and the nearby brain surface outside the pia mater layer in more than 2/3 of the overall tumor–brain interface;
2) Mixed: tumor with mixed areas of adhesion and non‐adhesion; a clear surgical plane was partially lost where the pial membrane was adherent to the tumor in more than 1/3 and less than 2/3 of the interface;
3) Subpial: adhesive tumor; separating the tumor from the brain was difficult and dissection had to be done in a subpial fashion on a surface of more than 2/3 of overall tumor–brain interface.
Statistical Analysis
The SII findings of shear line images, OSS maps, and normalized OSS maps were correlated with the surgical findings by using the chi‐squared test. The Cohen's κ coefficient was used to study the agreement between the SII prediction and surgical findings (<0.20, poor agreement; 0.21–0.40, fair agreement; 0.41–0.60, moderate agreement; and >0.60, good agreement). The pairwise differences between the prediction of adhesion degree that used OSS and normalized OSS were examined by McNemar's test. A P‐value below 0.05 was considered significant. The Wilson score confidence interval (CI) was computed for all proportions calculated in this study. All statistical analyses were performed using JMP software (v. 11.0.0, SAS Institute, Cary, NC).
Results
Table 1 lists the surgical findings of surgical plane and SII predictions of tumor slip interface for each of the 25 patients. Mean patient age was 61.2 ± 11.0 (38–80) years and 17 (68%) were female. The surgical plane between the tumor capsule and the adjacent brain tissue was determined to be extrapial in 15 (15/25) patients, mixed in four (4/25), and subpial in six (6/25). SII evaluated the degree of tumor adhesion with: 1) shear line images, 2) OSS maps, and 3) normalized OSS maps. Both shear line images and OSS maps characterized 22 tumors (22/25) as complete slip interface, one (1/25) as partial, and two (2/25) as no slip interface, whereas normalized OSS maps assessed 15 (15/25) as complete, four (4/25) as partial, and six (6/25) as no slip interface.
Table 1.
Summary of Slip Interface Imaging and Surgical Findings
| Case | Age | Sex | Surgical plane | Shear line image | OSS | Normalized OSS |
|---|---|---|---|---|---|---|
| 1 | 76 | F | Extrapial | Complete | Complete | Complete |
| 2 | 62 | F | Extrapial | Complete | Complete | Complete |
| 3 | 62 | F | Extrapial | Complete | Complete | Complete |
| 4 | 53 | F | Extrapial | Complete | Complete | Complete |
| 5 | 65 | F | Extrapial | Complete | Complete | Complete |
| 6 | 75 | F | Extrapial | Complete | Complete | Complete |
| 7 | 51 | F | Extrapial | Complete | Complete | Complete |
| 8 | 56 | M | Extrapial | Complete | Complete | Complete |
| 9 | 61 | F | Extrapial | Complete | Complete | Complete |
| 10 | 38 | F | Extrapial | Complete | Complete | Complete |
| 11 | 59 | F | Extrapial | Complete | Complete | Complete |
| 12 | 47 | F | Extrapial | Complete | Complete | Complete |
| 13 | 57 | M | Extrapial | Complete | Complete | Complete |
| 14 | 63 | M | Extrapial | Complete | Complete | Complete |
| 15 | 76 | M | Extrapial | Complete | Complete | Partial |
| 16 | 73 | F | Mixed | Complete | Complete | Partial |
| 17 | 49 | F | Mixed | Partial | Partial | Partial |
| 18 | 65 | M | Mixed | Complete | Complete | Partial |
| 19 | 80 | F | Mixed | Complete | Complete | Complete |
| 20 | 79 | M | Subpial | Complete | Complete | No |
| 21 | 66 | F | Subpial | No | No | No |
| 22 | 55 | F | Subpial | No | No | No |
| 23 | 54 | M | Subpial | Complete | Complete | No |
| 24 | 46 | F | Subpial | Complete | Complete | No |
| 25 | 63 | M | Subpial | Complete | Complete | No |
OSS: octahedral shear strain.
As shown in Fig. 1, shear line images and OSS maps agreed with surgical findings in 18 (72%, 95% CI: 52–86%) of 25 cases. At surgery, 15 of the 22 tumors with complete slip interface were found to have an extrapial surgical plane, three with a mixed plane, and the remaining four with a subpial plane. The one case with partial slip interface was reported to be mixed, and the two cases with no slip interface were subpial. All 15 tumors with extrapial planes were predicted correctly by shear line images and OSS maps; however, in patients with non‐extrapial planes (ie, mixed or subpial), 7 of 10 tumors were misinterpreted as extrapial.
Figure 1.

Bar graphs showing the correlation between slip interface imaging and surgical findings. Left: shear line imaging (P = 0.02, chi‐squared test); Middle: OSS (P = 0.02, chi‐squared test); Right: normalized OSS (P < 0.0001, chi‐squared test).
Normalized OSS maps were concordant with the surgical findings in 23 (92%, 95% CI: 75–98%) of 25 cases. Of the 15 cases with complete slip interface, 14 were extrapial at surgery, and one had a mixed surgical plane. For the four tumors with partial slip interface, the surgical plane was mixed in three and extrapial in one. For the tumors with no slip interface, all six were subpial on normalized OSS maps. Normalized OSS maps correctly predicted 14 of 15 tumors with an extrapial plane and 9 of 10 tumors with a non‐extrapial plane.
In the overall assessment, the κ coefficient indicates fair agreement (0.37, 95% CI: 0.05–0.69) between the surgical findings and shear line images as well as OSS maps, but good agreement (0.86, 95% CI: 0.67–1) between the surgical findings and normalized OSS maps (Table 2). The correlation between the surgical findings and shear line images, OSS, and normalized OSS maps were statistically significant (chi‐squared test, P = 0.02, P = 0.02, and P < 0.0001, respectively). However, the differences between the normalized OSS and shear line images as well as OSS were not significant (P = 0.07, McNemar's test).
Table 2.
Correlation of Slip Interface Imaging and Surgical Findings
| Surgical plane | κ Coefficienta | |||
|---|---|---|---|---|
| Extrapial | Mixed | Subpial | ||
| Shear line image | ||||
| complete | 15 | 3 | 4 | 0.37 (0.05, 0.69) |
| partial | 0 | 1 | 0 | |
| no | 0 | 0 | 2 | |
| OSS | ||||
| complete | 15 | 3 | 4 | 0.37 (0.05, 0.69) |
| partial | 0 | 1 | 0 | |
| no | 0 | 0 | 2 | |
| Normalized OSS | ||||
| complete | 14 | 1 | 0 | 0.86 (0.67, 1) |
| partial | 1 | 3 | 0 | |
| no | 0 | 0 | 6 | |
OSS: octahedral shear strain.
Cohen κ coefficients: < 0.20, poor agreement; 0.21–0.40, fair agreement; 0.41–0.60, moderate agreement; and > 0.60, good agreement. Data in parentheses are 95% CI range.
Figures 2, 3, 4 are examples of concordant cases of complete, partial, and no slip interface, correlated with surgical findings of extrapial, mixed, and subpial planes, respectively. Figure 5 is an example where normalized OSS correlated better with the surgical findings than either shear line image or OSS. Figure 6 is an example of both shear line image and OSS correlating better with surgery than normalized OSS. An example where all three SII results, shear line image, OSS, and normalized OSS, were discordant with surgical findings is presented in Fig. 7.
Figure 5.
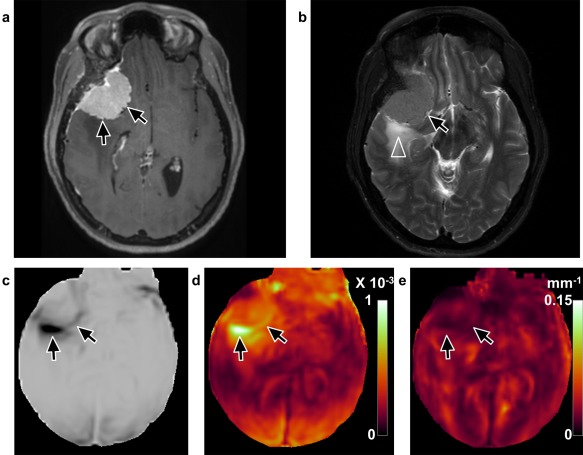
Discordant case of a tumor that was predicted correctly by normalized OSS but not by shear line image or OSS (case 24, 46‐year‐old, female). a: T 1‐weighted image with contrast enhancement shows a right lateral sphenoid wing meningioma. b: T 2‐weighted image reveals peritumoral edema (arrowhead). (c) Shear line image with low signal and (d) high values on the OSS map predicted complete slip interface with no adhesion (arrows). Normalized OSS map (e) suggested no slip interface with adhesion, as no apparent tumor outline was identified. Intraoperatively, the meningioma was very adherent, with the pia largely invaded completely around the tumor.
Figure 6.
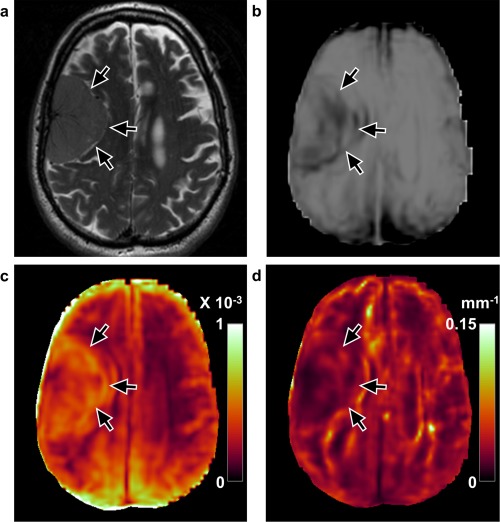
Discordant case by normalized OSS but correctly predicted with shear line image and OSS (case 15, 76‐year‐old, male). a: T 2‐weighted image shows a right frontal convexity meningioma. b: Shear line image with low surrounding signal and (c) high values on the OSS map predicted a complete slip interface with no adhesion (arrows). However, half of the contour was not seen in the normalized OSS map (d), suggesting partial adhesion. Surgical findings demonstrated an extrapial plane with no meningioma–brain adhesion.
Figure 7.
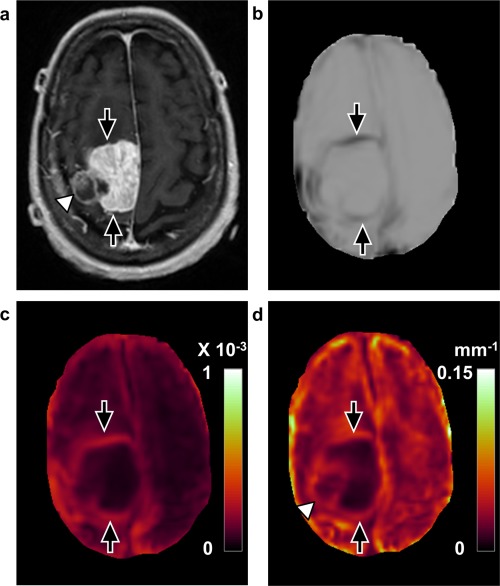
Discordant case between SII and surgical findings (case 19, 80‐year‐old, female). a: T 1‐weighted image with contrast enhancement shows a right parasagittal meningioma with a lateral portion that was noncontrast‐enhancing (arrowhead). The rim of the tumor is clearly defined with (b) shear line image, (c) OSS map, and (d) normalized OSS map (arrows), suggesting no adhesion. However, surgical findings demonstrated that the tumor was adherent to the anterior and posterior cortex.
Of the tumors that shear line image and OSS map did not predict correctly, seven tumors with mixed or subpial planes were predicted as extrapial. All seven had mild to severe peritumoral edema (Fig. 5b), and exhibited a wide dark band on the shear line image (Fig. 5c) and a large area of high value on the OSS map at the tumor–edema interface (Fig. 5d). However, six of these seven discordant cases were correctly predicted by normalized OSS. After normalization to the wave amplitude, the apparent large OSS contour was absent (Fig. 5e). Normalized OSS maps failed in two cases. In one case (case 15) with extrapial plane, part of the slip interface was not seen medially (Fig. 6). In another case (case 19) with mixed plane, a high value of OSS contour was seen after normalization (Fig. 7). It was noted that the former (case 15) was a soft tumor, and the latter one (case 19) was reported as a “rock hard” tumor.
Discussion
In this study we demonstrated that SII provides a noninvasive method to evaluate meningioma–brain adhesion preoperatively. Among three SII methods (shear line imaging, OSS, and normalized OSS), assessment of tumor slip interface with normalized OSS has the best agreement with the surgical assessment of tumor adhesion.
With recent developments in brain MRE techniques, SII provides a dynamic measure of tumor adherence based on the characteristic differences between the tumor and adjacent brain mobility under applied shear force. Shear energy is introduced into the brain using a soft, pillow‐like driver. The existence of an extrapial plane creates a slip boundary between the tumor and the surrounding brain, i.e., the tumor has the ability to move relative to the brain. It should be noted that the sharp displacement across the interface occurs at a submicron level but can be measured with the MRE pulse sequence. The displacement discontinuity results in low signal with shear line image and large OSS values. Such results can be observed at the tumor–brain interface in patients with no adhesion at surgery. The tumors with a slip interface were easily dissected with a clear surgical plane where the tumor “fell away” from the brain. In contrast, when the meningioma is adherent to the adjacent brain a non‐slip boundary occurs where mobility is restricted due to the tight conjunction. No visible contours surrounding the tumor can be seen in shear line images, OSS, and normalized OSS maps as a result of continuous displacement across the adherent interface. These tumors often required sharp tedious dissection away from the underlying structures in a subpial fashion.
The discordant tumors that shear line images and OSS maps predicted to be non‐adherent but were found to be adherent at surgery had mild or severe edema and exhibited large displacement amplitude near the tumor‐edema interface. This edema was thought to contribute to the “apparent” artificial slip interface. The large displacement can lead to IVPD during an MRE acquisition,12 and shear strain is proportional to the shear displacement amplitude. It is not unexpected that if the amplitude variation across a non‐slip interface is large enough, it could cause signal attenuation in shear line images, and a large shear strain on OSS maps. Thus, an artificial slip interface can be seen on both the shear line images and OSS maps as a result of the large wave amplitude within the edema. This higher wave amplitude could be explained by decreased stiffness of brain parenchyma from increased fluid content in the region of edema, possibly resulting in some loss of tissue structural integrity.13 Therefore, normalizing OSS maps to the wave amplitude can partially remove this effect of amplitude variation within these regions, and provide a more accurate prediction of a non‐slip interface in the setting of peritumoral edema.
Despite good agreement between the normalized OSS and surgical findings, two tumors were outliers. Interestingly, these two tumors were characterized as “rock hard” and soft during surgery, respectively. These discrepancies imply that the inherent tumor stiffness may also affect the SII results. OSS is calculated from the spatial gradient of shear displacement. Besides a slip interface and a large amplitude variation due to edema, a sharp contrast in stiffness with distinct wavelengths on two sides of a well‐bonded interface could result in high OSS values, which could distort the OSS value even after normalizing to the wave amplitude. It has been shown that the strain contrast is related to modulus contrast in both firmly bounded and loosely bounded interfaces.14 Future work will focus on understanding how these factors (such as modulus contrast and amplitude/wavelength variations) affect the behavior of SII results. The goal would be to develop a more generalized normalization algorithm to remove the effects from the non‐slip shear strain.
It should also be noted that in normalized OSS maps, there are several regions outside the tumor with low displacement that cause high normalized OSS even though a boundary does not exist in these regions. This may be explained by wave reflection and interference. The formation of standing waves from wave interference can lead to amplitude nulls at regions of nodes. By normalizing OSS to the amplitude nulls, these regions could be depicted as high normalized OSS values. Applying shear stress from different vibrational directions or at different vibration frequencies in future studies may mitigate such artifacts and help to understand the true slip interface behavior.
OSS calculation including normalization requires unwrapped 3D phase data. This process can be time‐consuming, depending on the amount of the acquired data, the degree of phase wrapping, and the type of unwrapping algorithm. In contrast, the image processing for shear line imaging does not require that the phase data be unwrapped and can be performed quickly using standard algorithms. Shear line images can be obtained directly from the scanner with minimal data processing time, and performed well in patients without edema surrounding the meningioma. For the above reasons, it is important to develop an optimized scheme for tumor adhesion prediction for our future studies with a larger number of patients.
The measurement of bonding connected media under an extrinsic/intrinsic force has been studied previously.15, 16, 17, 18 To date, one MRE‐based study calculated scattering coefficients to assess the weldedness of tissue interfaces in a gel phantom by inducing and encoding planar shear waves within the gel.15 The feasibility and utility of this approach in brain tumors has not been examined. Another MRI‐based technique has been reported that characterized the meningioma–brain adhesion by subtracting two MR images obtained in different phases of the cardiac cycle.16 The pulsatile‐dependent motion limits its ability in cases with reduced CSF movement. Several other ultrasound groups have studied the bonding conditions of benign and malignant breast lesions using axial shear strain.17, 18 Extending its application to brain tumors preoperatively is difficult because ultrasound can only be used once the skull is removed during surgery.
SII is still a developing technology and there are several limitations in this study. First, with 3‐mm resolution the involvement of critical vascular and neural structures adherent to the meningioma cannot be determined with SII. Improvements in MRE sequences including true 3D imaging acquisition at a higher spatial resolution may address this in the future. Second, surgical excision of brain tumors is generally performed piece‐by‐piece in a small visual field, making it difficult at times to accurately quantify the percentage of tumor cleavage. A prospective quantitative scale carefully mapped to the location of adherence would be helpful. Third, current SII is not fully quantitative. Absolute quantification would require measurement of the stress applied to the slip boundary and an analysis of constraints applied to the slip boundary in all three dimensions, which are difficult to perform in vivo. Fourth, SII focuses on the detection of tumor–brain adhesion and is not sensitive to the surgical difficulties caused by varied arterial supply to the tumor. Therefore, it is important that SII be used in combination with conventional preoperative imaging techniques for a comprehensive preoperative evaluation. Finally, the patient number was relatively small in this study. Although our results suggest that the normalized OSS map had better agreement with surgical findings than shear line imaging and OSS, McNemar's test showed that these differences were not significant, presumably because of the small sample size in this study. Further studies are needed in a larger population to confirm the predictive value of SII in a variety of intracranial tumors. Despite these limitations, SII has demonstrated potential usefulness in providing surgeons preoperatively with the degree of tumor–brain adhesion, information that was previously unavailable noninvasively.
SII, a new technique based on MRE, provides a method to noninvasively evaluate the degree of meningioma adhesion to adjacent brain tissue, hence predicting the surgical plane of tumor cleavage. SII has the potential to become a valuable tool for preoperative planning to help predict procedure length and surgical risk.
Acknowledgment
Contract grant sponsor: National Institutes of Health; contract grant number: RO1 EB001981; Contract grant sponsor: Office of Naval Research; contract grant number: N00173–15–P–0618
Paper presented in part at the 24th Annual Meeting of International Society of Magnetic Resonance in Medicine.
References
- 1. Mirimanoff RO, Dosoretz DE, Linggood RM, Ojemann RG, Martuza RL. Meningioma: analysis of recurrence and progression following neurosurgical resection. J Neurosurg 1985;62:18–24. [DOI] [PubMed] [Google Scholar]
- 2. Couldwell WT, Fukushima T, Giannotta SL, Weiss, MH . Petroclival meningiomas: surgical experience in 109 cases. J Neurosurg 1996;84:20–28. [DOI] [PubMed] [Google Scholar]
- 3. Sekhar LN, Swamy NKS, Jaiswal V, et al. Surgical excision of meningiomas involving the clivus: preoperative and intraoperative features as predictors of postoperative functional deterioration. J Neurosurg 1994;81:860–868. [DOI] [PubMed] [Google Scholar]
- 4. van Alkemade H, de Leau M, Dieleman EM, et al. Impaired survival and long‐term neurological problems in benign meningioma. Neuro Oncol 2012;14:658–666. [DOI] [PMC free article] [PubMed] [Google Scholar]
- 5. Ýldan F, Tuna M, Göcer AÝ, et al. Correlation of the relationships of brain‐tumor interfaces, magnetic resonance imaging, and angiographic findings to predict cleavage of meningiomas. J Neurosurg 1999;91:384–390. [DOI] [PubMed] [Google Scholar]
- 6. Alvernia JE, Sindou MP. Preoperative neuroimaging findings as a predictor of the surgical plane of cleavage: prospective study of 100 consecutive cases of intracranial meningioma. J Neurosurg 2004;100:422–430. [DOI] [PubMed] [Google Scholar]
- 7. Celikoglu E, Suslu HT, Hazneci J, Bozbuga M. The relation between surgical cleavage and preoperative neuroradiological findings in intracranial meningiomas. Eur J Radiol 2011;80:e109–115. [DOI] [PubMed] [Google Scholar]
- 8. Yin Z, Glaser KJ, Manduca A, et al. Slip interface imaging predicts tumor‐brain adhesion in vestibular schwannomas. Radiology 2015;277:507–517. [DOI] [PMC free article] [PubMed] [Google Scholar]
- 9. Mariappan YK, Glaser KJ, Manduca A, Ehman RL. Cyclic motion encoding for enhanced MR visualization of slip interfaces. J Magn Reson Imaging 2009;30:855–863. [DOI] [PMC free article] [PubMed] [Google Scholar]
- 10. Murphy MC, Huston J 3rd, Glaser KJ, et al. Preoperative assessment of meningioma stiffness using magnetic resonance elastography. J Neurosurg 2013;118:643–648. [DOI] [PMC free article] [PubMed] [Google Scholar]
- 11. McGarry MD, Van Houten EE, Perrinez PR, Pattison AJ, Weaver JB, Paulsen KD. An octahedral shear strain‐based measure of SNR for 3D MR elastography. Phys Med Biol 2011;56:N153–164. [DOI] [PMC free article] [PubMed] [Google Scholar]
- 12. Glaser KJ, Felmlee JP, Manduca A, Kannan Mariappan Y, Ehman RL. Stiffness‐weighted magnetic resonance imaging. Magn Reson Med 2006;55:59–67. [DOI] [PubMed] [Google Scholar]
- 13. Xu ZS, Lee RJ, Chu SS, et al. Evidence of changes in brain tissue stiffness after ischemic stroke derived from ultrasound‐based elastography. J Ultrasound Med 2013;32:485–494. [DOI] [PubMed] [Google Scholar]
- 14. Thitaikumar A, Ophir J. Effect of lesion boundary conditions on axial strain elastograms: a parametric study. Ultrasound Med Biol 2007;33:1463–1467. [DOI] [PMC free article] [PubMed] [Google Scholar]
- 15. Papazoglou S, Hamhaber U, Braun J, Sack I. Horizontal shear wave scattering from a nonwelded interface observed by magnetic resonance elastography. Phys Med Biol 2007;52:675–684. [DOI] [PubMed] [Google Scholar]
- 16. Yamada S, Taoka T, Nakagawa I, et al. A magnetic resonance imaging technique to evaluate tumor‐brain adhesion in meningioma: brain‐surface motion imaging. World Neurosurg 2015;83:102–107. [DOI] [PubMed] [Google Scholar]
- 17. Arun T, Thomas AK, Brian SG, Jonathan O. Visualization of bonding at an inclusion boundary using axial–shear strain elastography: a feasibility study. Phys Med Biol 2007;52:2615. [DOI] [PubMed] [Google Scholar]
- 18. Chakraborty A, Bamber JC, Dorward NL. Slip elastography: A novel method for visualising and characterizing adherence between two surfaces in contact. Ultrasonics 2012;52:364–376. [DOI] [PubMed] [Google Scholar]


