

Abstract
Objectives
We sought to estimate charges associated with USA hospital visits for traumatic brain injury (TBI), compare charges from 2006 to 2010, and evaluate factors associated with higher charges.
Methods
We used the Nationwide Emergency Department Sample database, 2006–2010 to estimate charges for emergency department visits and inpatient hospital stays associated with TBI and compared trends in charges over time. We used multivariable linear regression to evaluate factors associated with visit charges.
Results
In 2010, there were $21.4 billion (95% confidence interval (CI): $17.7 billion, $25.2 billion) in charges for TBI-related admissions, an increase of 22% from 2006. Charges for ED visits resulting in discharge or transfer were $8.2 billion (95% CI: $7.4, $8.9 billion), an increase of 94% from 2006. The proportion of charges for TBI-related visits was disproportionately higher than the proportion of visits for TBI across all years of the study (P<0.001). Patient age and gender, West region, trauma centre status, non-pediatric hospital designation, metropolitan location, and hospital ownership were independently associated with higher charges.
Conclusions
There was a substantial charge burden from TBI-related hospital visits, and charges increased disproportionately to visit volume. There are patient and hospital factors independently associated with higher charges. These findings as well as methods to reduce the charge burden and charge disparities deserve further study.
Keywords: Traumatic brain injury, charges, Nationwide Emergency Department Sample
Introduction
Traumatic brain injury (TBI) is a significant public health problem, with more than 2.5 million TBI-related visits to the emergency department (ED) annually.1 TBI-related visits have increased in recent years1,2 and TBI is a topic of concern for the public, policy makers, and healthcare professionals.3–5 Many studies have focused on TBI epidemiology,1,2 utilization,6,7 and management.8–10 However, little has been done to investigate hospital resource utilization in terms of hospital charge burden on a national scale. The few prior studies regarding the financial burden of TBI are limited by selected patient populations,11,12 reflect data from earlier years,7,13 or examine state-specific data.6,14
Rising healthcare costs have come under scrutiny in recent decades, leading to a directive from the Centers for Medicare & Medicaid Services (CMS) to transform our health system to one that is ‘more transparent, affordable, and accountable’.15 Given the large disease burden of TBI, understanding the economic implications of hospital-based visits for TBI may be an important first step in this CMS mandate. Further, insight into the economic burden and distribution of charges enables a more complete understanding of the burden of TBI and may allow for more appropriate resource allocation, and implementation of more cost-conscious practises.
Thus, the primary objective of this study was to estimate the annual healthcare charges associated with hospital visits for TBI and compare charges from 2006 to 2010. The secondary objective was to evaluate patient and hospital factors associated with higher charges.
Methods
Data source
We conducted a population-based epidemiological study of visits originating in the ED for TBI from 2006–2010. We analysed both ED and hospital admission data from the Nationwide Emergency Department Sample (NEDS) database. The NEDS is part of the Healthcare Cost and Utilization Project sponsored by the Agency for Healthcare Research and Quality. It is the largest all-payer ED database in the USA including between 25 and 30 million visits from over 950 hospitals annually from 28 participating states, representing a 20% stratified sample of USA hospital-based EDs. All patients who present to participating EDs are included in the NEDS and data is extracted from visit billing records.
Identification of visits
We included all visits with a diagnosis of TBI in one of the 15 diagnosis fields in the NEDS. Seventy percent of TBI-related visits had a primary diagnosis of TBI. Visits were classified as either resulting in admission or discharge/transfer. Transfers out of the ED and those who died in the ED were included in the discharge/transfer group, as these patients did not incur inpatient charges. We defined TBI as per the CDC,16 using the International Classification of Diseases, 9th revision, Clinical Modification (ICD-9-CM) diagnosis codes for concussion (850), skull fracture (800–801.9, 803–804), other brain injury (854.0–854.1), intracranial hemorrhage (851, 852.0–852.5, 853), or unspecified head injury (959.01). Readers may consult previous work on the epidemiology of these head trauma visits for data on patient and visit characteristics, and trends over time.1
Patient-level characteristics
A priori, we considered those patient factors associated with TBI charges based on prior research and scientific plausibility: age, sex, insurance status, income, geographic region, and injury severity.17,18 We defined insurance status as the expected primary payer associated with that visit. We used patient county urban-rural designations developed by the National Center for Health Statistics for use in health care research.19 We defined injury severity using the Injury Severity Score (ISS). Scores of 1 through 8 were considered minor, those 9 through 15 were considered moderate, and those greater than 15 were considered severe.20 We used the ICD Programs for Injury Categorization (ICDPIC), a valid method to translate ICD-9-CM diagnosis codes into ISS scores.21 In order to account for comorbidities, which may contribute to visit charges, we used a numeric score modification of the Elixhauser classification system, whereby higher scores are associated with increased likelihood of in-hospital mortality.22
Hospital-level characteristics
We included the following hospital-specific factors: trauma centre designation (Levels I through III vs nontrauma), teaching status, pediatric-specific designation, urban/rural designation, and hospital ownership.17,23–25 A hospital is considered a teaching hospital in the NEDS if it meets any one of the following criteria: Residency training approval by the Accreditation Council for Graduate Medical Education, membership in the Council of Teaching Hospitals, and/or a ratio of full-time equivalent interns and residents to beds of 0.25 or higher. We defined a children’s hospital as one in which the mean age of all ED patients seen was ≤10 years.26 Urban/rural hospital designations in the NEDS are based on the county of the hospital as identified by the American Hospital Association (AHA), and the categorization is an adaptation of the 2003 Urban Influence Codes. The hospital’s ownership category was obtained from the AHA Annual Survey of Hospitals. This category is used as a stratifier in the NEDS, and the sample size of the strata, which is influenced by geographical area, dictates how specifically hospital ownership was defined for a particular hospital in the NEDS, thus a private hospital could be deemed ‘private or government’ or ‘private non-specified’ depending on the geographical area.
Estimation of charges
The NEDS includes charges associated with hospital visits. Visit charges include ED and inpatient charges for total care and refer to the amount billed to the patient, not the actual cost of treatment, amount reimbursed by insurance, or final cost incurred by the patient. Charges for visits resulting in admission include both ED charges and inpatient charges. All dollar amounts are valued in terms of their respective years. Therefore, no adjustments were needed for inflation.
Statistical analysis
Total charges were missing in NEDS for 0.5% of admissions and 14.9% of discharges/transfers. Missing total charges were largely explained by treatment at a subset of hospitals within the West region, which did not submit charge data to HCUP. These missing values were treated as missing at random (explained by variables in our data) and estimated using predictive mean matching multiple imputation.27 We included year, age, sex, median household income based on patient zip code, county of residence urban-rural classification, insurance status, injury severity, Elixhauser comorbidity score, hospital length of stay, final disposition, hospital urban-rural location, hospital ownership category, teaching centre, trauma centre, pediatric hospital, and region as covariates in the imputation analysis. We generated ten imputations, each matching the predicted values to the 5 nearest neighbors, and integrated the imputations according to Rubin’s rules.28 Total charge estimates were similar across the 10 imputations.
We descriptively summarized charges using means with 95% confidence intervals (CI) based on standard errors provided by the NEDS. The proportion of TBI-related visits were compared to the proportion of TBI charges using the pearson chi-square test. To compare total TBI charges and charges associated with all other visits, we included those visits with charge data available (86.8% for TBI -related visits and 87.3% for all other visits). We compared trends for each in a weighted linear regression model, including an interaction between TBI and year. We tested the significance of the interaction term to determine if the total charges for TBI and all other visits had a similar slope across years.
We assessed and compared secular trends in TBI charges using weighted linear regression and examined departures from linearity using the Runs test. To ensure that differences in charges over time were not associated with temporal trends in injury severity, comorbidities, or hospital length of stay, we evaluated trends, specifically, in these variables as well. For simplicity, we present the first and last years of the study time period in the tables with the estimated difference in charges over time. We constructed a 95% confidence interval for the difference over time on the imputed dataset by incorporating each mean estimate, standard error, and sample size into the formula for confidence limits based on the z-distribution.
We performed multivariable linear regression to estimate the contribution of patient and hospital-level factors to average TBI-related visit charges. We included covariates of interest based on previous studies17,18,23–25 and those hypothesized a priori to be associated with visit charges (age, sex, insurance status, income percentile, region, ICD-9-CM diagnosis, ISS, trauma centre status, teaching hospital status, pediatric hospital status, urban/rural hospital designation, and hospital ownership). Model fit testing was performed on the unimputed datasets. We extracted each imputation and compared model results across imputations to confirm reliability. Multivariable model estimates between the imputed and unimputed data were similar, with no differences in statistical significance of any covariates. We applied a log transformation to the charges to meet modeling assumptions and then converted the results of the modeling to units of percent change for interpretation.
We performed the primary analysis using Stata statistical software version 12.1 (StataCorp LP, College Station, TX). The NEDS utilizes a probabilistic survey scheme; we applied prescribed weighting procedures to account for the unequal sampling probabilities and to produce national estimates using the mi:svy set of commands in Stata. We used Prism version 6.0, GraphPad Software (La Jolla, CA) for graphical representation and additional analysis. We considered two-sided P values of less than 0.05 significant. The first author’s Institutional Review Board approved the study as exempt from human subjects review.
Results
Admitted patients
In 2010, there were an estimated $21.4 billion (95% CI: $17.7 billion, $25.2 billion) in charges for 318,011 TBI-related admissions, a charge increase of 22% from 2006. The proportion of TBI-related visit charges (of all charges) was higher than the proportion of TBI-related visits (of all visits) (P <0.001 for all years) (Figure 1). Among admitted patients, compared to 2006 charges, 2010 mean per visit charges increased for adult patients ≥18 years of age, males, those insured by Medicare and Medicaid, those ≤75th percentile for income, those in the Midwest and South regions of the USA, those with skull fractures, epidural hemorrhages, and unspecified head injuries, and for those with ISS ≤ 8 (Table 1). Visit charges increased over time for patients treated at non-trauma centres, non-pediatric hospitals, and private hospitals. There was no change over time in the mean injury severity score (5.1 vs 5.1, P=0.44) or in mean admission length of stay (6.3 days vs 6.0 days, P=0.09). The Elixhauser comorbidity score increased from 2.4 to 3.7 (P<0.001).
Figure 1. Proportion of visits and charges with TBI-related diagnoses (visits resulting in admission).
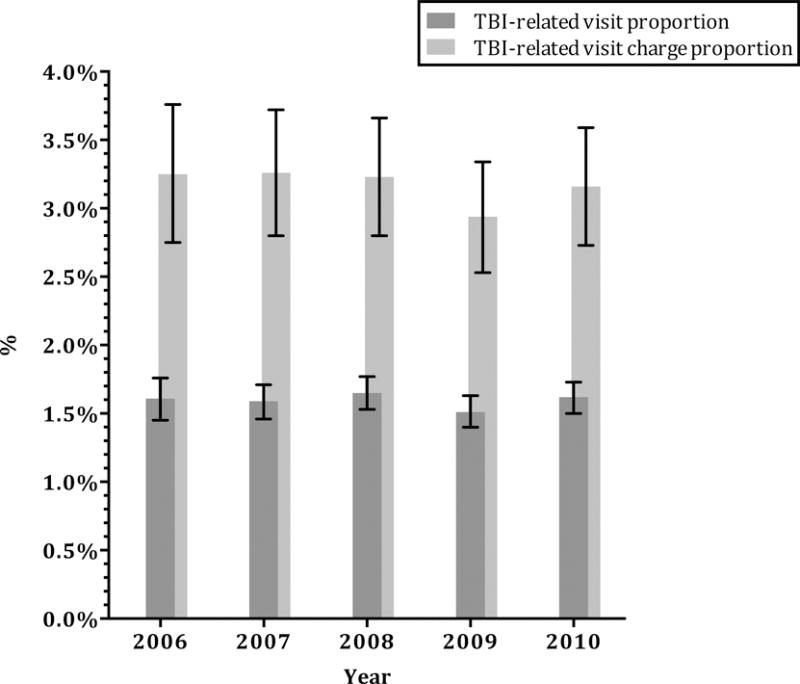
Error bars indicate 95% confidence intervals.
P value <0.001 for all years.
TBI-related visit proportion was calculated as the number of TBI-related visits resulting in admission divided by the total number of visits resulting in admission. TBI-related visit charge proportion was calculated as the charges associated with TBI-related visits resulting in admission divided by the total charges for all visits resulting in admission.
Table 1.
Trends in TBI charges for admitted patients
| Charges per visit, US$ (mean, 95% CI) 2006 |
Charges per visit, US$ (mean, 95% CI) 2010 |
Difference in Charges (mean, 95% CI) |
|
|---|---|---|---|
| Total, admitted | 58,569 (52,693–64,444) | 67,224 (61,091–73,357) | 8,656 (167–17,144) |
| Age | |||
| <3 years | 30,185 (23,734–36,636) | 33,961 (27,157–40,764) | 3,776 (−5,593–13,145) |
| 3–17 years | 46,258 (40,419–52,096) | 53,301 (44,052–62,551) | 7,028 (−3,909–17,966) |
| 18–44 years | 68,976 (61,826–76,126) | 81,744 (73,237–90,251) | 12,768 (1,662–23,874) |
| 45–59 years | 70,744 (63,231–78,256) | 82,702 (74,476–90,928) | 11,958 (825–23,092) |
| ≥60 years | 48,776 (43,551–54,000) | 55,940 (51,940–59,991) | 7,164 (558–13,771) |
| Sex | |||
| Male | 63,858 (57,388–70,328) | 74,354 (67,675–81,032) | 10,496 (1,202–19,789) |
| Female | 49,565 (44,707–54,423) | 56,213 (50,943–61,482) | 6,648 (−516–13,811) |
| Insurance status | |||
| Private | 63,110 (56,750–69,471) | 73,341 (64,996–81,687) | 10,248 (−217–20,712) |
| Medicare | 44,809 (40,267–49,351) | 53,688 (49,745–57,630) | 8,890 (2,886–14,894) |
| Medicaid | 75,228 (64,740–85,716) | 92,478 (80,633–104,324) | 17,253 (1,467–33,040) |
| Self-pay | 54,867 (46,546–63,187) | 61,313 (52,704–69,922) | 6,456 (−5,495–18,407) |
| No Charge/Other | 67,434 (59,934–74,933) | 72,314 (65,270–79,358) | 4,902 (−5,375–15,180) |
| Income | |||
| 0–25th Percentile | 57,034 (49,638–64,429) | 68,750 (61,246–76,254) | 11,716 (1,187–22,246) |
| 25–50th | 55,966 (49,892–62,039) | 66,430 (60,531–72,330) | 10,465 (2,002–18,927) |
| 51–75th | 59,109 (52,272–65,947) | 70,593 (62,707–78,479) | 11,484 (1,052–21,916) |
| 76–100th | 60,972 (53,840–68,104) | 62,615 (53,657–71,574) | 1,643 (−9,800–13,087) |
| [Other (Zip blank or miss] | 69,442 (60,813–78,070) | 68,194 (55,032–81,358) | –1,247 (−16,976–14,481) |
| Region | |||
| Northeast | 63,898 (47,884–79,912) | 47,088 (40,098–54,077) | −16,810 (−34,218–598) |
| Midwest | 37,775 (34,186–41,365) | 55,379 (48,437–62,321) | 17,604 (9,803–25,405) |
| South | 52,702 (43,068–62,336) | 71,076 (58,323–83,828) | 18,374 (2,419–34,328) |
| West | 80,114 (68,153–92,074) | 87,896 (73,645–102,147) | 7,782 (−10,756–26,321) |
| ICD9-CM diagnosis | |||
| 850 (Concussion) | 43,298 (37,311–49,285) | 50,203 (42,494–57,912) | 6,905 (−2,850–16,660) |
| 800–801.9; 803–804 (Skull Fracture) | 80,060 (71,437–88,682) | 95,085 (85,248–104,922) | 15,026 (1,952–28,099) |
| 851 (Cerebral laceration and contusion) | 66,844 (59,966–73,723) | 71,142 (65,764–76,521) | 4,298 (−4,429–13,025) |
| 852.0, 852.1 (Subarachnoid hemorrhage) | 70,012 (60,178–79,847) | 73,717 (66,285–81,150) | 3,705 (−8,615–16,025) |
| 852.2, 852.3 (Subdural hemorrhage) | 61,878 (55,431–68,325) | 66,684 (62,228–71,328) | 4,900 (−2,986–12,786) |
| 852.4, 852.5 (Epidural hemorrhage) | 60,542 (48,709–72,375) | 82,787 (70,951–94,623) | 22,245 (5,552–38,968) |
| 853 (Intracranial hemorrhage, unspecified) | 66,043 (56,185–75,900) | 69,684 (62,653–76,714) | 3,641 (−8,460–15,741) |
| 854.0–854.1 (Brain injury, other) | 60,649 (43,561–77,736) | 72,193 (55,658–88,728) | 11,544 (−12,218–35,307) |
| 959.01 (Head injury, unspecified) | 28,195 (25,547–30,843) | 37,274 (32,715–41,834) | 9,079 (3,809–14,349) |
| Injury Severity Score | |||
| ISS ≤ 8 | 25,058 (23,013–27,102) | 30,415 (27,590–33,241) | 5,358 (1,872–8,843) |
| ISS 9–15 | 52,566 (47,419–57,713) | 58,996 (53,713–64,278) | 6,430 (−941–13,801) |
| ISS ≥ 16 | 90,366 (80,075–100,656) | 98,648 (89,619–107,677) | 8,283 (−5,399–21,964) |
| Trauma center | 69,131 (61,960–76,303) | 76,478 (68,810–84,147) | 7,347 (−3,109–17,803) |
| Non-trauma center | 29,589 (27,623–31,556) | 38,089 (35,272–40,906) | 8,500 (5,067–11,933) |
| Teaching hospital | 63,045 (55,327–70,763) | 71,678 (63,160–80,196) | 8,633 (−2,826–20,093) |
| Non-teaching hospital | 50,151 (42,243–58,060) | 57,930 (52,625–63,234) | 7,778 (−1,737–17,294) |
| Pediatric hospital | 29,559 (24,838–34,280) | 24,124 (17,439–30,809) | –5,435 (−13,459–2,589) |
| Non-pediatric hospital | 59,222 (53,292–65,152) | 67,789 (61,716–73,861) | 8,567 (84–17,049) |
| Metropolitan Area | 60,913 (54,868–66,958) | 69,035 (62,706–75,365) | 8,122 (−623–16,866) |
| Non-metropolitan Area | 17,322 (13,891–20,754) | 24,951 (13,889–36,014) | 7,629 (−3,934–19,193) |
| Hospital ownership | |||
| Government or private | 63,062 (56,615–69,510) | 70,782 (63,928–77,636) | 7,720 (−1,679–17,118) |
| Government, nonfederal | 26,379 (16,383–36,374) | 36,214 (24,241–48,186) | 9,835 (−5,694–25,364) |
| Private, non-profit | 28,945 (24,689–33,201) | 41,808 (35,761–47,855) | 12,863 (5,493–20,233) |
| Private, investor-owned | 37,823 (33,345–42,302) | 46,518 (40,548–52,488) | 8,695 (1,272–16,118) |
| Private, not specified | 22,140 (15,662–28,619) | 40,563 (19,343–61,783) | 18,423 (−3,616–40,461) |
Abbreviations: TBI= traumatic brain injury; US= United States; ICD9-CM= International Classification of Diseases, 9th revision, Clinical Modification
In multivariable modeling (Table 2) and controlling for relevant predictors, for ED visits resulting in admission, charges were highest for patients 18–44 years of age compared with other age groups. Charges were also higher for males compared to females and those with private insurance compared to other forms of insurance. Visits in the West region were associated with 75% higher charges compared with those in the Northeast region. Similarly, charges were 46% higher at trauma centre, 36% higher at non-pediatric hospitals, 71% higher in Metropolitan areas, and 52% higher at private, investor-owned compared to private, non-profit hospitals.
Table 2.
Multivariable regression model of factors associated with TBI visit charges
| Variables | Admitted (95%CI)a | P-value | Discharged/Transferred (95%CI)a | P-value |
|---|---|---|---|---|
| Age (years) | ||||
| <3 | −44.69 (−48.86–(−40.19)) | <0.001 | −65.35 (−66.76–(−63.87)) | <0.001 |
| 3–17 | −22.51 (−26.42–(−18.39)) | <0.001 | −44.22 (−45.66–(−42.73)) | <0.001 |
| 18–44 | Referent | Referent | ||
| 45–59 | −4.89 (−6.14–(−3.62)) | <0.001 | 9.29 (8.24–10.35) | <0.001 |
| ≥60 | −13.35 (−15.34–(−11.30)) | <0.001 | 14.64 (12.33–16.99) | <0.001 |
|
| ||||
| Sex (Male) | 3.13 (2.36–3.91) | <0.001 | 7.34 (6.49–8.20) | <0.001 |
|
| ||||
| Insurance status | ||||
| Private | Referent | Referent | ||
| Medicare | −10.85 (−13.20–(−8.43)) | <0.001 | 0.42 (−1.30–2.17) | 0.632 |
| Medicaid | −5.32 (−8.29–(−2.25)) | 0.001 | −7.03 (−8.79–(−5.23)) | <0.001 |
| Self Pay | −5.22 (−8.64–(−1.67)) | 0.004 | 5.22 (2.71–7.79) | <0.001 |
| No Charge/Other | 0.70 (−3.64–5.23) | 0.757 | −6.19 (−9.00–(−3.30)) | <0.001 |
|
| ||||
| Income | ||||
| 0–25th Percentile | Referent | Referent | ||
| 25–50th | −1.36 (−5.51–2.98) | 0.533 | −2.72 (−6.19–0.89) | 0.138 |
| 51–75th | 1.57 (−4.39–7.90) | 0.614 | −4.65 (−8.50–(−0.63)) | 0.024 |
| 76–100th | −0.70 (−15.74–17.03) | 0.933 | −11.87 (−19.62–(−3.38)) | 0.007 |
| [Other (Zip blank or miss] | −13.05 (−19.58–(−6.00)) | <0.001 | 2.21 (−2.83–7.51) | 0.396 |
|
| ||||
| Region | ||||
| Northeast | Referent | Referent | ||
| Midwest | −2.51 (−13.34–9.68) | 0.673 | 5.69 (−2.09–14.09) | 0.156 |
| South | 8.09 (−12.30–33.24) | 0.466 | 9.44 (−5.38–26.58) | 0.224 |
| West | 72.28 (51.26–96.21) | <0.001 | 9.90 (0.89–19.71) | 0.031 |
|
| ||||
| Injury Severity Score | ||||
| ISS ≤ 8 | Referent | Referent | ||
| ISS 9–15 | 35.25 (28.98–41.82) | <0.001 | 87.98 (84.44–91.58) | <0.001 |
| ISS ≥ 16 | 71.63 (60.74–83.26) | <0.001 | 105.62 (99.97–111.43) | <0.001 |
|
| ||||
| Elixhauser Score | 2.05 (1.88–2.22) | <0.001 | 1.94 (1.71–2.17) | <0.001 |
|
| ||||
| Length of Stay (continuous days) | 5.75 (5.39–6.11) | <0.001 | — | — |
|
| ||||
| Year (continuous) | 3.85 (1.97–5.76) | <0.001 | 8.23 (6.99–9.48) | <0.001 |
|
| ||||
| Trauma Center | 46.17 (33.20–60.40) | <0.001 | 21.14 (11.45–31.66) | <0.001 |
|
| ||||
| Teaching Hospital | −3.70 (−16.57–11.16) | 0.61 | 6.10 (−3.55–16.72) | 0.22 |
|
| ||||
| Pediatric Hospital | −35.71 (−52.71–(−12.59)) | <0.001 | −32.38 (−42.14–(−20.96)) | <0.001 |
|
| ||||
| Metropolitan Area | 71.42 (57.06–87.09) | <0.001 | 23.99 (16.08–32.43) | <0.001 |
|
| ||||
| Hospital ownership | ||||
| Private, non-profit | Referent | Referent | ||
| Private, investor-owned | 51.47 (35.20–69.69) | <0.001 | 69.25 (50.85–89.89) | <0.001 |
| Private, not specified | 21.23 (3.21–42.40) | 0.019 | 21.93 (7.68–38.06) | 0.002 |
| Government, nonfederal | −2.61 (−14.26–10.61) | 0.683 | 3.92 (−6.15–15.06) | 0.460 |
| Government or private | 11.53 (−4.28–29.95) | 0.162 | 3.74 (−9.87–19.39) | 0.609 |
Log transformed outcome. Associations are presented as percent change compared to reference group. Raw n for “Admitted” model=322,812, weighted n=1,534,983. Raw n for “Discharged/Transferred” model=2,066,630, weighted n=9,353,464. Abbreviations: TBI= traumatic brain injury.
Discharged/transferred patients
By 2010, charges for the 2.2 million visits resulting in discharge or transfer were an estimated $8.2 billion (95% CI: $7.4 billion`, $8.9 billion), an increase of 94% from 2006. The proportion of TBI-related visit charges (of all charges) was higher than the proportion of TBI-related visits (of all visits) (P <0.001 for all years) (Figure 2). Charges increased over the time period across all visits except for those to pediatric hospitals (Table 3). Charges in 2010 were highest for adult patients ≥18 years of age, and those with Medicare coverage or self-pay. The mean ISS for discharged/transferred patients decreased slightly over the study period from 5.14 in 2006 to 5.10 in 2010 (P=0.002). There was an increase in the mean Elixhauser comorbidity score from 0.33 to 0.48 (p<0.001).
Figure 2. Proportion of visits and charges with TBI-related diagnoses (visits resulting in discharge or transfer).
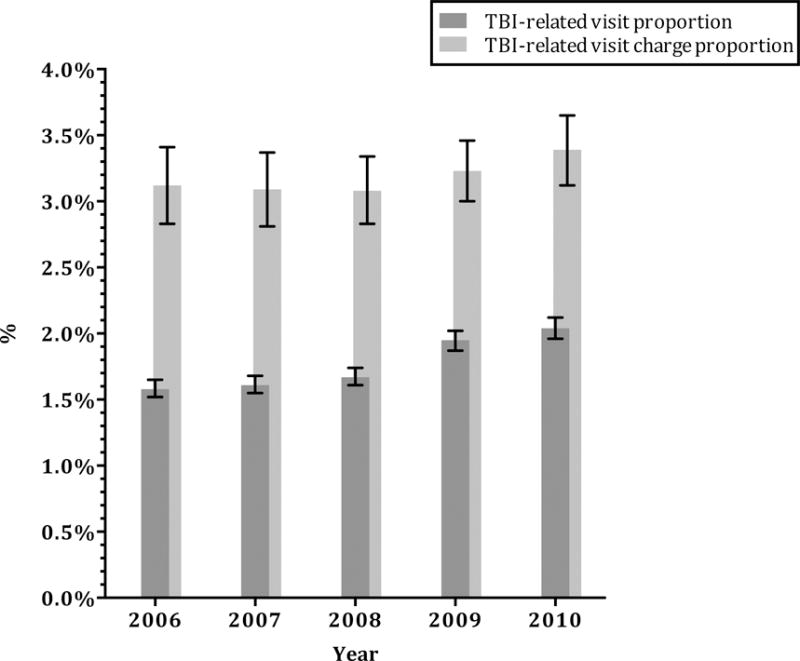
Error bars indicate 95% confidence intervals.
P value <0.001 for all years.
TBI-related visit proportion was calculated as the number of TBI-related visits resulting in discharge or transfer divided by the total number of visits resulting in discharge or transfer. TBI-related visit charge proportion was calculated as the charges associated with TBI-related visits resulting in discharge or transfer divided by the total charges for all visits resulting in discharge or transfer.
Table 3.
Trends in TBI charges for discharged or transferred patients
| Charges per visit, US$ (mean, 95% CI) 2006 |
Charges per visit, US$ (mean, 95% CI) 2010 |
Difference in Charges (mean, 95% CI) |
|
|---|---|---|---|
| Total, discharged/transferred | 2,617 (2,470–2,764) | 3,672 (3,491–3,853) | 1,055 (822–1,288) |
| Age | |||
| <3 years | 1,119 (1,046–1,191) | 1,500 (1,404–1,597) | 382 (261–502) |
| 3–17 years | 1,820 (1,723–1,917) | 2,374 (2,256–2,493) | 554 (401–707) |
| 18–44 years | 3,155 (2,959–3,351) | 4,311 (4,085–4,537) | 1,156 (857–1,455) |
| 45–59 years | 3,334 (3,132–3,535) | 4,646 (4,405–4,888) | 1,313 (998–1,627) |
| ≥60 years | 3,172 (3,048–3,296) | 4,570 (4,344–4,796) | 1,398 (1,141–1,656) |
| Sex | |||
| Male | 2,708 (2,544–2,872) | 3,728 (3,538–3,918) | 1,020 (769–1,271) |
| Female | 2,500 (2,372–2,627) | 3,609 (3,433–3,784) | 1,109 (892–1,326) |
| Insurance status | |||
| Private | 2,464 (2,312–2,616) | 3,376 (3,182–3,571) | 912 (665–1,159) |
| Medicare | 3,083 (2,965–3,202) | 4,530 (4,309–4,751) | 1,447 (1,196–1,697) |
| Medicaid | 1,968 (1,840–2,095) | 2,877 (2,727–3,028) | 910 (713–1,107) |
| Self–pay | 3,241 (2,999–3,483) | 4,425 (4,168–4,681) | 1,183 (831–1,536) |
| No Charge/Other | 2,708 (2,505–2,911) | 3,754 (3,520–3,988) | 1,046 (736–1,356) |
| Income | |||
| 0–25th Percentile | 2,835 (2,639–3,030) | 3,872 (3,644–4,101) | 1,038 (737–1,338) |
| 25–50th | 2,690 (2,509–2,872) | 3,760 (3,550–3,969) | 1,069 (792–1,346) |
| 51–75th | 2,538 (2,395–2,681) | 3,736 (3,536–3,936) | 1,199 (953–1,444) |
| 76–100th | 2,367 (2,209–2,524) | 3,260 (3,005–3,516) | 894 (594–1,194) |
| [Other (Zip blank or miss] | 3,109 (2,894–3,323) | 4,305 (3,992–4,618) | 1,196 (817–1,576) |
| Region | |||
| Northeast | 2,399 (2,082–2,717) | 3,058 (2,741–3,375) | 659 (212–1,106) |
| Midwest | 2,416 (2,110–2,721) | 3,512 (3,226–3,797) | 1,096 (678–1,514) |
| South | 2,919 (2,615–3,223) | 4,200 (3,792–4,608) | 1,281 (773–1,789) |
| West | 2,608 (2,417–2,801) | 3,551 (3,313–3,790) | 943 (638–1,248) |
| ICD9–CM diagnosis | |||
| 850 (Concussion) | 3,100 (2,817–3,382) | 4,064 (3,833–4,295) | 964 (600–1,329) |
| 800–801.9; 803–804 (Skull Fracture) | 4,398 (4,168–4,629) | 6,065 (5,782–6,349) | 1,667 (1,302–2,032) |
| 851 (Cerebral laceration and contusion) | 4,939 (4,675–5,202) | 6,516 (6,205–6,826) | 1,577 (1,170–1,984) |
| 852.0, 852.1 (Subarachnoid hemorrhage) | 5,665 (5,225–6,105) | 7,616 (7,156–8,077) | 1,951 (1,315–2,588) |
| 852.2, 852.3 (Subdural hemorrhage) | 4,735 (4,459–5,011) | 6,266 (5,926–6,605) | 1,531 (1,094–1,967) |
| 852.4, 852.5 (Epidural hemorrhage) | 4,325 (3,677–4,973) | 6,828 (6,014–7,643) | 2,503 (1,469–3,538) |
| 853 (Intracranial hemorrhage, unspecified) | 5,048 (4,702–5,394) | 6,765 (6,335–7,195) | 1,717 (1,166–2,269) |
| 854 (Brain injury, other) | 2,826 (2,139–3,512) | 4,133 (3,300–4,966) | 1,308 (229–2,386) |
| 959.01 (Head injury, unspecified) | 2,266 (2,148–2,385) | 3,344 (3,162–3,526) | 1,077 (860–1,294) |
| Injury Severity Score | |||
| ISS ≤ 8 | 2,419 (2,281–2,557) | 3,430 (3,260–3,601) | 1,011 (792–1,230) |
| ISS 9–15 | 4,752 (4,503–5,002) | 6,569 (6,235–6,902) | 1,816 (1,400–2,233) |
| ISS ≥ 16 | 5,614 (5,287–5,941) | 7,362 (6,968–7,756) | 1,748 (1,237–2,260) |
| Trauma center | 3,205 (2,848–3,562) | 4,085 (3,722–4,447) | 880 (373–1,386) |
| Non-trauma center | 2,293 (2,194–2,392) | 3,400 (3,217–3,582) | 1,106 (899–1,314) |
| Teaching hospital | 2,849 (2,536–3,162) | 3,886 (3,516–4,256) | 1,037 (554–1,520) |
| Non-teaching hospital | 2,448 (2,340–2,555) | 3,523 (3,360–3,687) | 1,076 (880–1,272) |
| Pediatric hospital | 1,208 (1,039–1,377) | 1,127 (759–1,496) | −80 (–447–316) |
| Non-pediatric hospital | 2,680 (2,536–2,823) | 3,709 (3,531–3,887) | 1,029 (801–1,258) |
| Metropolitan Area | 2,710 (2,538–2,881) | 3,798 (3,587–4,009) | 1,088 (817–1,360) |
| Non-metropolitan Area | 2,112 (1,983–2,241) | 2,983 (2,800–3,165) | 871 (648–1,094) |
| Hospital ownership | |||
| Government or private | 2,674 (2,466–2,881) | 3,671 (3,432–3,909) | 997 (681–1,313) |
| Government, nonfederal | 2,231 (1,980–2,482) | 2,965 (2,729–3,201) | 734 (391–1,077) |
| Private, non-profit | 2,245 (2,033–2,457) | 3,180 (2,844–3,516) | 935 (539–1,331) |
| Private, investor-owned | 3,504 (3,088–3,921) | 5,322 (4,812–5,832) | 1,818 (1,163–2,473) |
| Private, not specified | 2,117 (1,947–2,286) | 3,266 (3,028–3,504) | 1,150 (859–1,440) |
Abbreviations: TBI= traumatic brain injury; US= United States; ICD9-CM= International Classification of Diseases, 9th revision, Clinical Modification
In multivariable modeling (Table 2), visits by patients greater than or equal to 45 years of age (compared to those <45 years), visits by male patients, self pay visits (compared to privately insured), and visits in the lowest income category had significantly higher charges. Visits to EDs in the West region (compared to the Northeast), trauma centres, non-pediatric hospitals, and hospitals in the Metropolitan area were associated with higher charges. Similarly, visits to private, investor-owned hospitals were charged significantly greater than those to private, non-profit hospitals.
Discussion
We demonstrate the large economic charge burden associated with TBI-related hospital visits from 2006–2010. By 2010, hospital charges for TBI totaled nearly $30 billion for the 2.5 million visits, a large burden for payers and the healthcare system. On average, the charge for a visit resulting in admission was nearly $60,000, and $2,600 for a visit resulting in discharge or transfer. Compared to the proportion of total ED visits, TBI-related visits were responsible for a disproportionate amount of total charges for each year of the study period. By evaluating the increase in charges on a per visit basis, our data indicate that the increases in charges during the 5-year study period were not explained merely by trends in visit volume. This charge increase was independent of injury severity and most notable in the setting of discharged patients, which is of particular importance, given that the majority (87%) of TBI-related visits to EDs result in discharge or transfer.1 TBI is a costly condition when managed in the ED/hospital setting. According to recent data, 60% of patients with mild TBI are treated in the ED setting.29 Although it’s unclear whether the level of care provided in the ED is always required, a more cost-effective option may be for selected patients with mild TBI to be managed in the outpatient clinic setting (e.g. primary care offices and subspecialty clinics). Further work would be needed to assist with on the field and primary care office phone triage of candidates who would be appropriate for clinic evaluation rather than referral to the ED.
Even after adjusting for relevant severity confounders, age, gender, West region, trauma centre status, non-pediatric hospital designation, metropolitan location, and hospital ownership remained significant independent predictors of charges for both admitted and discharged/transferred patients. Understanding how these factors lead to higher charges could assist with cost containment efforts. One such factor we demonstrate is older age. Specifically, we found that visits by older patients, were associated with higher charges than younger patients. In the acute ED evaluation of patients with any trauma, multiple computed tomography (CT) examinations may be used more often as a screen in older patients than in children, despite the mechanism of injury or clinical exam findings.30 In addition, campaigns and clinical decision rules geared at minimizing CT use in young children,31,32 may have contributed to a reduction in imaging, and therefore, the charges associated with visits by pediatric patients.
Practise variation may account for some of the specific factors associated with increased charges in our study. According to the Institute of Medicine 2010 report, removing unnecessary variation in hospital spending would eliminate approximately 30% of total spending.33 In our study, we found trauma centres were associated with higher charges, which may, in part, reflect increased utilization of advanced imaging in that setting.34 Injury severity may also be a factor in practise variation. Bulger, et al,35 demonstrated wide variation in the ED and inpatient management of patients with a Glasgow Coma Scale ≤8. Whether or not standardized, national protocols could decrease practise variation and reduce these trends in charges is not known. Prior studies have suggested that implementation of evidence-based protocols and recommendations for TBI, such as those from the Brain Trauma Foundation,36 result in reductions in resource utilization as well as charges while also improving outcomes for TBI patients.8,9 Regional variation may also, in part, explain trends in charges,37 with a prior study demonstrating up to 37% higher TBI inpatient charges in the West compared to the Northeast,38 in keeping with findings from our study. At a more micro level, there is significant price variation across individual hospitals within the same state for the same service or test.17 Assuming comparable clinical outcomes, these regional and hospital charge disparities may represent areas of cost control and deserve further investigation.38
Our study has limitations. The NEDS is based on hospital billing data and, as such, lacks clinical variables, however, we used the ISS as a measure of injury severity. Nonetheless, there may have been unmeasured confounders that contributed to visit charges and may account for some of the variation and charge disparities found in our study. Visits were identified based on ICD-9-CM coding and the accuracy and consistency of coding may vary across hospitals. We used ICD-9-CM codes based on the CDC definitions published in 2004.16 There are more recent definitions for TBI,2 with the difference being the addition of codes for shaken baby syndrome (995.55) and injury to optic nerve and pathways (950.1–950.3). These diagnoses were associated with only a modest number of visits that didn’t carry another TBI diagnosis in our dataset (N=459 in 2010), and therefore, their omission is unlikely to bias our results. Our visit cohort included those visits with a TBI ICD-9-CM code in any of 15 diagnosis positions, and it is possible that a TBI diagnosis was carried over from a previous encounter and did not represent an active diagnosis. However, 70% of TBI-related visits had a TBI-related ICD-9-CM diagnosis code as the primary diagnosis. Charges reported by NEDS are those for the entire visit and not specific to those charges associated with TBI directly. However, we included a measure of comorbidities in order to account for those diagnoses that also affect visit charges. Our study does not include visits to federal hospitals (i.e. military and Veterans Administration facilities) and does not account for visits in nonhospital settings, and therefore, is an underestimation of the total charge burden for TBI. Additionally, we explored hospital charges associated with acute injury evaluation and we did not assess the indirect costs from TBI, such as care after hospital discharge, cognitive and emotional costs, and lost wages associated with the injury which also contribute substantially to the overall burden of TBI. Lastly, we did not convert the charges to costs. The NEDS does not have a hospital charge to cost conversion tool available, however, prior studies have suggested that approximately 42% of ED charges are paid,39 and this would remain a burdensome amount. Further, using this percentage, our estimate of a 2010 total charge burden of $30 billion is in keeping with the projected direct hospital costs by Coronado, et al.40
Conclusions
In summary, there is a significant charge burden associated with TBI hospital visits and these charges are disproportionate to TBI volume. There appear to be patient and hospitals factors that are independently associated with higher charges. Future work is needed to investigate methods to reduce the charge burden and disparities for this costly condition.
Acknowledgments
Dr. Marin has consulted in the last 12 months for SmartAnalyst, Inc for research relating to traumatic brain injury. Dr. Marin received grant support from the National Institutes of Health, National Heart Lung and Blood Institute (K12HL109068).
The first author received grant support from the National Institutes of Health, National Heart Lung and Blood Institute (K12HL109068). The first author has consulted in the last 12 months for SmartAnalyst, Inc, for research relating to traumatic brain injury.
Footnotes
Declarations of interest: For the remaining authors, no conflicts of interest were declared.
Contributor Information
Jennifer R. Marin, Departments of Pediatrics and Emergency Medicine, University of Pittsburgh School of Medicine, 4401 Penn Ave, AOB Suite 2400, Pittsburgh, PA 15224, (o) 412-692-7692, (f) 412-692-7464.
Matthew D. Weaver, Department of Medicine, Division of Sleep Medicine, Harvard Medical School, Room 106, 164 Longwood Ave, Boston, MA 02115, 617-983-7489.
Rebekah C. Mannix, Division of Emergency Medicine, Children’s Hospital Boston, 300 Longwood Ave, Boston, MA 02115, 617-355-6624.
References
- 1.Marin JR, Weaver MD, Yealy DM, Mannix RC. Trends in visits for traumatic brain injury to emergency departments in the United States. JAMA. 2014;311(18):1917–1919. doi: 10.1001/jama.2014.3979. [DOI] [PubMed] [Google Scholar]
- 2.Faul M, Xu L, Wald MM, Coronado VG. Traumatic brain injury in the United States: emergency department visits, hospitalizations, and deaths 2002–2006. 2010 http://www.cdc.gov/traumaticbraininjury/pdf/blue_book.pdf. Accessed 2016 Apr 11.
- 3.State Motorcycle and Bicycle Helmet Laws. Governors Highway and Safety Association. [cited 2013 Dec 19]; Available from: http://www.ghsa.org/html/stateinfo/laws/helmet_laws.html.
- 4.HR 4238 (112th): TBI Act of 2012 US Government Printing Office. [cited 2013 Dec 19]; Available from: http://www.gpo.gov/fdsys/pkg/BILLS-112hr4238ih/pdf/BILLS-112hr4238ih.pdf.
- 5.Brain Injury Awareness Month. Brain Injury Association of America. Brain Injury Awareness Month. Brain Injury Association of America. [cited 2013 Dec 19]; Available from: http://www.biausa.org/brain-injury-awareness-month.htm.
- 6.Rochette LM, Conner KA, Smith GA. The contribution of traumatic brain injury to the medical and economic outcomes of motor vehicle-related injuries in Ohio. Journal of Safety Research. 2009;40(5):353–358. doi: 10.1016/j.jsr.2009.08.003. [DOI] [PubMed] [Google Scholar]
- 7.McGarry LJ, Thompson D, Millham FH, Cowell L, Snyder PJ, Lenderking WR, Weinstein MC. Outcomes and costs of acute treatment of traumatic brain injury. The Journal of trauma. 2002;53(6):1152–1159. doi: 10.1097/00005373-200212000-00020. [DOI] [PubMed] [Google Scholar]
- 8.Fakhry SM, Trask AL, Waller MA, Watts DD. Management of Brain-Injured Patients by an Evidence-Based Medicine Protocol Improves Outcomes and Decreases Hospital Charges. The Journal of trauma. 2004;56(3):492–500. doi: 10.1097/01.ta.0000115650.07193.66. [DOI] [PubMed] [Google Scholar]
- 9.Faul M, Wald MM, Rutland-Brown W, Sullivent EE, Sattin RW. Using a Cost-Benefit Analysis to Estimate Outcomes of a Clinical Treatment Guideline: Testing the Brain Trauma Foundation Guidelines for the Treatment of Severe Traumatic Brain Injury. The Journal of trauma. 2007;63(6):1271–1278. doi: 10.1097/TA.0b013e3181493080. [DOI] [PubMed] [Google Scholar]
- 10.Stocchetti N, Taccone FS, Citerio G, Pepe PE, Le Roux PD, Oddo M, Polderman KH, Stevens RD, Barsan W, Maas AIR, et al. Neuroprotection in acute brain injury: an up-to-date review. Critical Care. 2015;19:186. doi: 10.1186/s13054-015-0887-8. [DOI] [PMC free article] [PubMed] [Google Scholar]
- 11.Thompson HJ, Weir S, Rivara FP, Wang J, Sullivan SD, Salkever D, Mackenzie EJ. Utilization and Costs of Health Care after Geriatric Traumatic Brain Injury. Journal of Neurotrauma. 2012;29(10):1864–1871. doi: 10.1089/neu.2011.2284. [DOI] [PMC free article] [PubMed] [Google Scholar]
- 12.Davis KL, Joshi AV, Tortella BJ, Candrilli SD. The Direct Economic Burden of Blunt and Penetrating Trauma in a Managed Care Population. The Journal of trauma. 2007;62(3):622–630. doi: 10.1097/TA.0b013e318031afe3. [DOI] [PubMed] [Google Scholar]
- 13.Kreutzer JS, Kolakowsky-Hayner SA, Ripley D, Cifu DX, Rosenthal M, Bushnik T, Zafonte R, Englander J, High W. Charges and lengths of stay for acute and inpatient rehabilitation treatment of traumatic brain injury 1990–1996. Brain Injury. 2001;15(9):763–774. doi: 10.1080/02699050010025786. [DOI] [PubMed] [Google Scholar]
- 14.Kayani NA, Homan S, Yun S, Zhu BP. Health and economic burden of traumatic brain injury: Missouri, 2001–2005. Public health reports (Washington, DC: 1974) 2009;124(4):551–560. doi: 10.1177/003335490912400412. [DOI] [PMC free article] [PubMed] [Google Scholar]
- 15.Medicare Provider Utilization and Payment Data: Physician and Other Supplier - Centers for Medicare & Medicaid Services. Internet. [cited 2015 Oct 2]; Available from: https://www.cms.gov/Research-Statistics-Data-and-Systems/Statistics-Trends-and-Reports/Medicare-Provider-Charge-Data/Physician-and-Other-Supplier.html.
- 16.Langlois JA, Rutland-Brown W, Thomas KE. Traumatic Brain Injury in the United States: Emergency Department Visits, Hospitalizations, and Deaths. 2004 http://stacks.cdc.gov/view/cdc/13379/. Accessed 2016 Apr 11.
- 17.Hsia RY, Antwi YA. Variation in Charges for Emergency Department Visits Across California. Ann Emerg Med. 2014;64(2):120–126.e4. doi: 10.1016/j.annemergmed.2014.03.006. [DOI] [PMC free article] [PubMed] [Google Scholar]
- 18.Hsia RY, Kothari AH, Srebotnjak T, Maselli J. Health care as a “market good?” Appendicitis as a case study. Archives of internal medicine. 2012;172(10):818–819. doi: 10.1001/archinternmed.2012.1173. [DOI] [PMC free article] [PubMed] [Google Scholar]
- 19.Ingram DD, Franco SJ. NCHS urban-rural classification scheme for counties. National Center for Health Statistics Vital Health Stat. 2012;2(154) Vital Health Stat 2(154).:1–72 http://www.cdc.gov/nchs/data/series/sr_02/sr02_154.pdf. Accessed 2013 Sep 16. [PubMed] [Google Scholar]
- 20.Sears JM, Blanar L, Bowman SM. Predicting work-related disability and medical cost outcomes: A comparison of injury severity scoring methods. Injury. 2014;45(1):16–22. doi: 10.1016/j.injury.2012.12.024. [DOI] [PubMed] [Google Scholar]
- 21.Clark DE, Osler TM, Hahn DR. ICDPIC: Stata Module to Provide Methods for Translating International Classification of Diseases (Ninth Revision) Diagnosis Codes into Standard Injury Categories and/or Scores [Internet] [cited 2014 Jun 21]; Available from: http://ideas.repec.org/c/boc/bo-code/s457028.html.
- 22.van Walraven C, Austin PC, Jennings A, Quan H, Forster AJ. A modification of the Elixhauser comorbidity measures into a point system for hospital death using administrative data. Medical Care. 2009;47(6):626–633. doi: 10.1097/MLR.0b013e31819432e5. [DOI] [PubMed] [Google Scholar]
- 23.Gaynor M, Vogt WB. Competition among hospitals. The Rand Journal of Economics. 2003;34(4):764–785. [PubMed] [Google Scholar]
- 24.Zwanziger J, Bamezai A. Evidence Of Cost Shifting In California Hospitals. Health Affairs. 2006;25(1):197–203. doi: 10.1377/hlthaff.25.1.197. [DOI] [PubMed] [Google Scholar]
- 25.Melnick G, Keeler E. The effects of multi-hospital systems on hospital prices. Journal of Health Economics. 2007;26(2):400–413. doi: 10.1016/j.jhealeco.2006.10.002. [DOI] [PubMed] [Google Scholar]
- 26.Larson DB, Johnson LW, Schnell BM, Goske MJ, Salisbury SR, Forman HP. Rising Use of CT in Child Visits to the Emergency Department in the United States, 1995–2008. Radiology. 2011;259(3):793–801. doi: 10.1148/radiol.11101939. [DOI] [PubMed] [Google Scholar]
- 27.White IR, Royston P, Wood AM. Multiple imputation using chained equations: Issues and guidance for practice. Statistics in Medicine. 2010;30(4):377–399. doi: 10.1002/sim.4067. [DOI] [PubMed] [Google Scholar]
- 28.Rubin DB. Multiple Imputation for Nonresponse in Surveys. New York, NY: Wiley; 1987. [Google Scholar]
- 29.Mannix R, O’Brien MJ, Meehan WP., III The Epidemiology of Outpatient Visits for Minor Head Injury. Neurosurgery. 2013;73(1):129–134. doi: 10.1227/01.neu.0000429846.14579.41. [DOI] [PubMed] [Google Scholar]
- 30.Huber-Wagner S, Lefering R, Qvick L-M, Körner M, Kay MV, Pfeifer K-J, Reiser M, Mutschler W, Kanz K-G, Society OBOTWGOPOTGT Effect of whole-body CT during trauma resuscitation onsurvival: a retrospective, multicentre study. The Lancet. 2009;373(9673):1455–1461. doi: 10.1016/S0140-6736(09)60232-4. [DOI] [PubMed] [Google Scholar]
- 31.Choosing Wisely | An Initiative of the ABIM Foundation. Internet. [cited 2014 Jul 21]; Available from: http://www.choosingwisely.org.
- 32.Kuppermann N, Holmes JF, Dayan PS, Hoyle JD, Atabaki SM, Holubkov R, Nadel FM, Monroe D, Stanley RM, Borgialli DA, et al. Identification of children at very low risk of clinically-important brain injuries after head trauma: a prospective cohort study. The Lancet. 2009;374:1160–1170. doi: 10.1016/S0140-6736(09)61558-0. [DOI] [PubMed] [Google Scholar]
- 33.Institute of Medicine (US) Roundtable on Evidence-Based Medicine. Yong PL, Saunders RS, Olsen L. The Healthcare Imperative: Lowering Costs and Improving Outcomes: Workshop Series Summary. Washington (DC): National Academies Press (US); 2010. [PubMed] [Google Scholar]
- 34.Salim A, Sangthong B, Martin M, Brown C, Plurad D, Demetriades D. Whole body imaging in blunt multisystem trauma patients without obvious signs of injury: results of a prospective study. Archives of Surgery. 2006;141(5):468–473. doi: 10.1001/archsurg.141.5.468. [DOI] [PubMed] [Google Scholar]
- 35.Bulger EM, Nathens AB, Rivara FP, Moore M, Mackenzie EJ, Jurkovich GJ, Brain Trauma Foundation Management of severe head injury: institutional variations in care and effect on outcome. Critical Care Medicine. 2002;30(8):1870–1876. doi: 10.1097/00003246-200208000-00033. [DOI] [PubMed] [Google Scholar]
- 36.Bullock MR, Povlishock JT. Guidelines for the management of severe traumatic brain injury. Editor’s Commentary, 3rd Edition. Journal of Neurotrauma. 2007;24(S1) doi: 10.1089/neu.2007.9998. [DOI] [PubMed] [Google Scholar]
- 37.Fisher ES, Wennberg JE. Health Care Quality, Geographic Variations, and the Challenge of Supply-Sensitive Care. Perspectives in Biology and Medicine. 2003;46(1):69–79. doi: 10.1353/pbm.2003.0004. [DOI] [PubMed] [Google Scholar]
- 38.Obirieze AC, Gaskin DJ, Villegas CV, Bowman SM, Schneider EB, Oyetunji TA, Haut ER, Efron DT, Cornwell EE, III, Haider AH. Regional variations in cost of trauma care in the United States. The journal of trauma and acute care surgery. 2012;73(2):516–522. doi: 10.1097/ta.0b013e31825132a0. [DOI] [PubMed] [Google Scholar]
- 39.Hsia RY, MacIsaac D, Baker LC. Decreasing Reimbursements for Outpatient Emergency Department Visits Across Payer Groups From 1996 to 2004. Annals of Emergency Medicine. 2008;51(3):265–274.e5. doi: 10.1016/j.annemergmed.2007.08.009. [DOI] [PubMed] [Google Scholar]
- 40.Coronado VG, McGuire LC, Faul MF, Sugerman DE, Pearson WS. Traumatic brain injury epidemiology and public health issues. In: Zasler ND, Katz DI, Zafonte RD, editors. Brain injury medicine: principles and practice. 2nd. New York: Demos Medical Publishing; 2012. pp. 84–100.pp. 17 [Google Scholar]