Abstract
Understanding the efficacy of and creating delivery mechanisms for therapeutic nucleic acids requires understanding structural and kinetic properties which allow these polymers to promote the death of cancerous cells. One molecule of interest is a 10mer of FdUMP (5-fluoro-2′-deoxyuridine-5′-O-monophosphate) – also called F10. Here we investigate the structural and kinetic behavior of F10 in intracellular and extracellular solvent conditions along with non-biological conditions that may be efficacious in in vitro preparations of F10 delivery systems. From our all-atom Molecular Dynamics simulations totaling 80 microseconds, we predict that F10’s phosphate groups form close-range interactions with calcium and zinc ions, with calcium having the highest affinity of the five ions investigated. We also predict that F10’s interactions with magnesium, potassium and sodium are almost exclusively long-range interactions. In terms of intramolecular interactions, we find that F10 is least structured (in terms of hydrogen bonds among bases) in the 150mM NaCl (extracellular-like solvent conditions) and most structured in 150mM ZnCl2. Kinetically, we see that F10 is unstable in the presence of magnesium, sodium or potassium, finding stable kinetic traps in the presence of calcium or zinc.
1 Introduction
DNA polymers have a tendency for intra-molecular repulsion due to the negative charges on the oxygens in the phosphodiester backbone’s phosphate groups. However, environmental factors – such as the presence of positive metal ions in solution with DNA – can spur the formation of secondary structures. Electrostatic interactions between metal ions and the phosphodiester’s bond can replace interactions between the phosphate groups and oxygens in the water. Alternatively, complexes of metal ions interacting with water molecules can form hydrogen bonds with the phosphate group’s oxygens. 1–4
Our previous work focused on the effects of MgCl2 and ZnCl2 on a polymer of 5-fluoro-2′-deoxyuridine-5′-O-monophosphate (FdUMP, Figure 1) which has been found efficacious in cytotoxic chemotherapy. 5–12 We found this 10mer – F10 for short – formed stable short-range interactions with magnesium and zinc ions in certain solvation and protonation conditions. 13 Given these results, we were curious about the effects of varying the type of ion present in solution with F10. For comparison and elaboration, we have used the data from our previous study on F10 in zinc-rich and magnesium-rich solvent conditions 13 along with novel simulation data of F10 in calcium-rich, sodium-rich and potassium-rich environments.
Fig. 1.
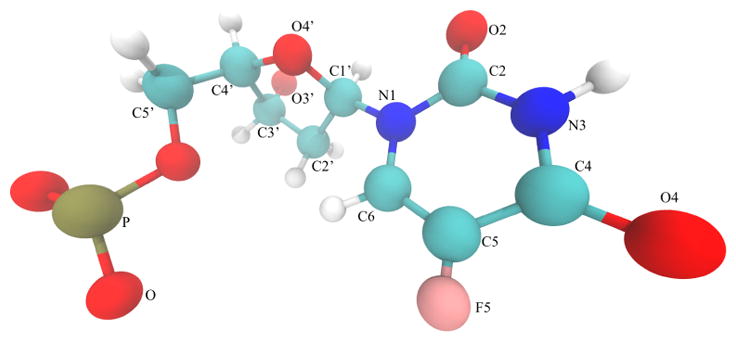
To produce 5-fluoro-2′-deoxyuridine-5′-O-monophosphate in silico, we substitute fluorine for a methyl group on a thymidine monophosphate. The sugar numbering, base numbering and atom coloring shown here are adopted throughout this paper.
This curiosity is not merely academic, however, as understanding the interactions of various metal ions with nucleic acids has been of much recent interest. 14–27 Additionally, the proposed mechanism(s) for F10’s cytotoxic effects indicates that preventing degradation of F10 to FdU monomers prior to cellular uptake will increase its efficacy as an anti-cancer therapeutic. 5,6,28,29 Preventing such breakdown of oligonucleotides is likewise a topic of general recent interest. 30 Understanding the structural and kinetic behaviors of F10 caused by both biologically relevant and laboratory preparation solvent conditions will aid in rational development of delivery systems for F10.
We found the particular counterion used changes the type, frequency and lifetime of secondary structures. In the presence of calcium, F10 consistently formed highly stable structures lasting up to 5 microseconds at a time. We observed a similarly stable structure emerging in the presence of zinc. Additionally, potassium induces F10 to form more extended structures than the other metal ions while calcium induces F10 to form more compact structures.
2 Methods
2.1 Simulation configuration
All-atom molecular dynamics simulations were performed under the canonical ensemble (NVT) using ACEMD 31 on Metrocubo GPU workstations. The simulations were run with Langevin thermostat at a temperature of 300K, 4fs timestep (using hydrogen mass repartitioning), 9-angstrom cutoff for switching VdW and electrostatic forces (with a switch distance of 7.5 angstroms). Long range electrostatics were calculated using a smooth particle mesh Ewald method. 32,33 Prior to production runs, 1,000 steps of conjugate gradient minimization was performed.
The CHARMM27 forcefield was used, supplemented with F10 parameters, 34,35 which have been previously validated 35,36 and implemented for Molecular Dynamics simulations, 35 an increasingly powerful and popular tool in drug discovery. 37,38 F10 was solvated in a 50-angstrom cubic water box and the concentration of each counter ion was set to 150mM of the given salt using VMD’s 39 “Add Solvation Box” and “Add Ions” tools with salt concentrations set using the “Neutralize and set” option.
The forcefield parameters used here have been previously validated for FdU systems in the presence of zinc and magnesium in computational and experimental studies. 34–36 The validation of these two divalent metal ions is particularly important given that divalent ion MD simulations have been shown less reliable than simulations of monovalent ions. 40–42 The other ions investigated here have not yet been experimentally validated with FdU; however, they have been applied in a variety of other studies of nucleic acids in the presence of various ions of which we cite a few examples. 43–45 Obviously, the results for these ions are only as valid as the input forcefield parameters. In recent years, there has been much discussion of the limitations of and work on improving MD forcefields – especially with respect to metal ions – of which we cite a few examples. 44,46–50
2.2 Processing and analysis
For each F10-ion system, a one-microsecond and three five-microsecond simulations were run, resulting in a total of 16 microseconds of data for each system. All simulations were strided to one frame per nanosecond, resulting in 16,000 frames in each of the final 5 trajectories used for analysis. Prior to analysis we also removed the water molecules and chlorine ions from the systems, leaving F10 and the metal ion of interest in each trajectory.
To determine the relative stability of each system and to define structural macrostates, we used HDBSCAN 51,52 clustering, which has been demonstrated particularly effective with molecular dynamics trajectories. 53 This is a density-based method that results in a hierarchical clustering. However, HDBSCAN differs from other hierarchical techniques in that it does not cut the final dendrogram at one point but rather selects clusters from multiple levels of the tree. The only parameter for HDBSCAN that a user need set is minimum cluster membership, which we set at two – meaning that any singleton clusters will be labeled as noise. For HDBSCAN, we used as input features all heavy-atom Cartesian coordinates.
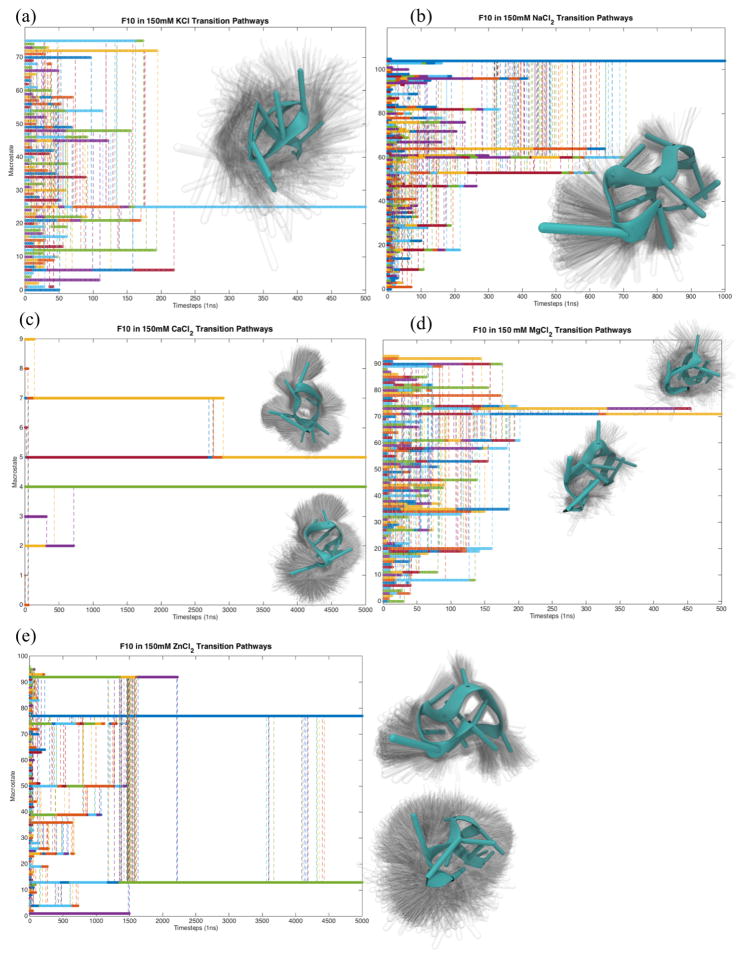
Treating these HDBSCAN clusters as structural macrostates (and under the assumption that the systems are Markovian – memoryless – with respect to each 1ns time step), we created a Markov chain of transitions between macrostates. From this chain, we constructed a Markov rate matrix, indicating the transition rates between all pairs of states. We then exponentiated this matrix to natural number values and recorded the likelihood that a transition occurs between states at various timescales. Whenever a transition was more than 50% likely, we considered that transition to have occurred. In this fashion, we simulated transition pathways among macrostates, as seen in Figure 3.
Fig. 3.
Calculating transitions between structural macrostates using Markov analysis (see Methods) indicates each system has one or two kinetic traps on a microsecond timescale. The conformational ensemble comprising the longest-lived one or two states. For systems where two states are visualized in this figure, the ensemble is placed closest (vertical distance) to line on the plot representing that state. The plots of Macrostate vs Timestep were constructed by simulating a system starting from each macrostate (y-tick value) directly from a Markov Rate Matrix. The rate matrix made using a lag time of 1ns is exponentiated over natural number values, and whenever a transition becomes more than 50%, that transition is considered to have occurred. Vertical dotted lines represent the point at which a transition occurs. The color of each vertical line corresponds to its starting state.
We calculated a Pearson correlated motion matrix of C1′ atoms. We performed Principal Component Analysis (PCA), reducing the number of coordinates from 3 × number of atoms to just a few components capturing a large portion of dynamic variance in the simulations. Projecting the individual system trajectories onto eigenvectors representing the two highest-variance principal components, binning the projections with two-dimensional histograms, and calculating free energy values with
| (1) |
(where k is Boltzmann’s constant, T is temperature (300K), P is the population of a bin and P0 is the population of the most populated bin), we estimate a free energy landscape for the polymer’s dynamics. For comparison across systems, we first calculated principal components for the concatenated trajectory of all 5 systems to create a common basis set. We then projected coordinates from each system individually, producing a free energy landscape for each of the five solvent conditions in a common space. For these calculations, atomic coordinates were read into Matlab using MatDCD. * Plots were produced with in-house Matlab scripts, which we have made available online via figshare. 54
To quantify ion interactions with F10, we used the “Radial Pair Distribution Function g(r)” plugin in VMD, setting “delta r” (the radial step size) and “max r” (the maximum radius) set to 0.1 and 35 angstroms respectively. To plot radial distribution functions, we used Grace, a WYSIWYG 2D plotting tool for the X Window System. For determining base-base interactions we employed DSSR, a new component of the 3DNA suite of software programs. 55–57
To determine the flexibility and compactness of F10 with respect to the type metal ion present in solution, we calculated the worm-like chain persistence length and distributions of radius of gyrations (RGYR) of F10 when solvated with each respective salt. Persistence length is calculated using
| (2) |
where P is persistence length, R is end-to-end distance and l is contour length – 55Å for F10.
2.3 Visualizing ensembles
We produced all structure images in VMD and Tachyon. 58 For indicating uncertainty using shadows, 59 we rendered the representative (solid) structure and each frame in the shadows separately. We then layered the output image files using Pillow, a fork of the Python Image Library. These images provide a representative conformation for the cluster as solid with shadows showing the full width of the ensemble distribution. The representative structure in each visualization is that with the smallest RMSD from the average of all structures in the cluster. We have previously detailed this visualization style and the statistical rationale thereof. 59 Scripts for rendering such images are available online via figshare. 60
3 Results
3.1 Clustering
Clustering with HDBSCAN labeled 87.78% of frames from simulations solvated in 150mM KCl as noise. The vast majority of the MgCl-solvated and NaCl-solvated simulations were likewise labeled noise – 82.14% and 77.72% respectively. Of the system solvated with 150mM ZnCl2, 37.73% of the frames were labeled with noise along with 5.11% of the simulation solvated with 150mM CaCl2.
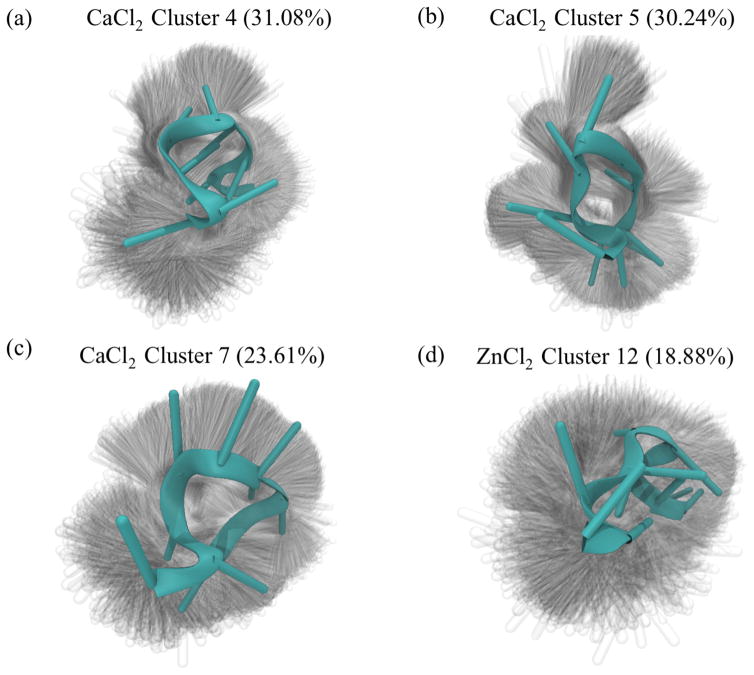
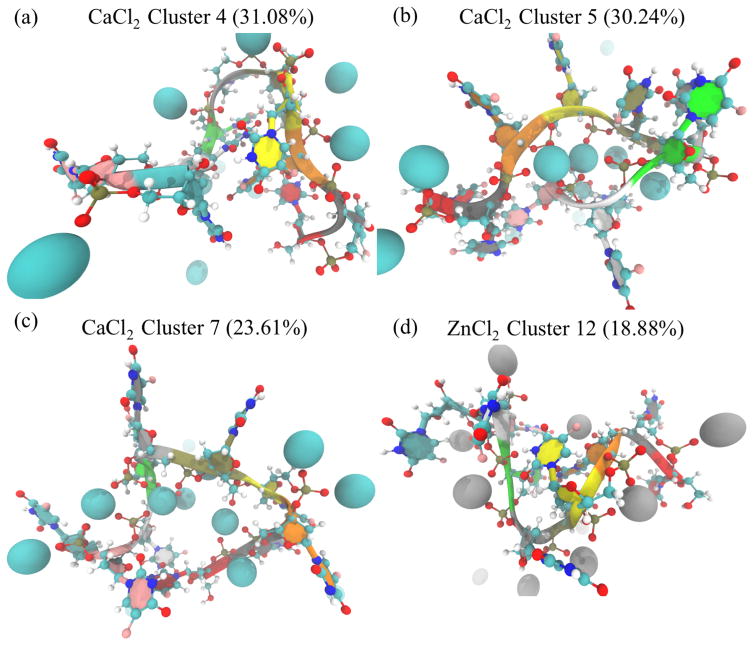
In the calcium-rich simulations of F10, HDBSCAN also found three preferred structural states respectively making up 31.08%, 30.24% and 23.61% of all frames from F10 solvated with 150mM CaCl2. Likewise, in the simulation of F10 solvated with 150mM ZnCl2, HDBSCAN found one preferred state making up 18.88% of the zinc-rich simulation frames. Visualizing these states (Figure 2) reveals that most of the structural variation in these states comes from the bases, with little variance difference among the frames coming from the phosphodiester backbone. HDBSCAN also revealed additional states lasting for a few nanoseconds at a time (Supplementary Information Figure 1).
Fig. 2.
The three stable structures that emerged in the simulation of F10 solvated in 150mM CaCl2 (a–c) are all partially folded, compact structures. From the shadows showing the width of the distribution of conformations, we see that the phosphodiester backbone is stable across all frames in each cluster, with the variations coming from nucleobases. Similarly, the stable structure that emerges in the second 5-microsecond simulation of F10 solvated in 150mM ZnCl2 is compact, but unlike those from the calcium-rich simulation the structure from the zinc-solvated simulation is relatively unstructured. Cluster numbering corresponds to Supplementary Information Figure 1.
Markov analysis of these clusters (see Methods) indicates each system has one or two kinetic traps (Figure 3) on microsecond timescales. Across all systems, these traps tend to be compact. Visualizing the ensembles of conformations comprising these traps indicates most of the variance within these traps comes from motion of the phosphodiester backbone rather than the nucleosides.
3.2 Persistence length
Persistence length calculations indicate that F10 tends to form relatively flexible, compact structures in the presence of calcium while forming rigid, relatively extended structures in the presence of potassium (Table 1). The lowest observed persistence length of F10 comes from simulations of the polymer in 150mM CaCl2. The largest observed persistence length occurs in simulations of F10 solvated in 150mM KCl. We see a similar pattern of compactness in terms of distributions of RGYR values, as seen in Supplementary Information Figure 2.
Table 1.
Calculating persistence length based on the worm-like chain model reveals that F10 in the presence of potassium exhibits the most local stability while F10 in calcium chloride exhibits the least. Since F10’s persistence length is smaller when solvated in 150mM NaCl than in 150mM KCl, we predict that a strand of F10 would less compact inside of a cell than outside. We also predict that a calcium-rich environment would induce the most compact structures of F10 while a potassium-rich one would induce the least compact.
| Solvent ion | Persistence length (Å) |
|---|---|
| Ca | 3.31 |
| K | 4.24 |
| Mg | 3.77 |
| Na | 3.67 |
| Zn | 3.55 |
3.3 Correlated motions
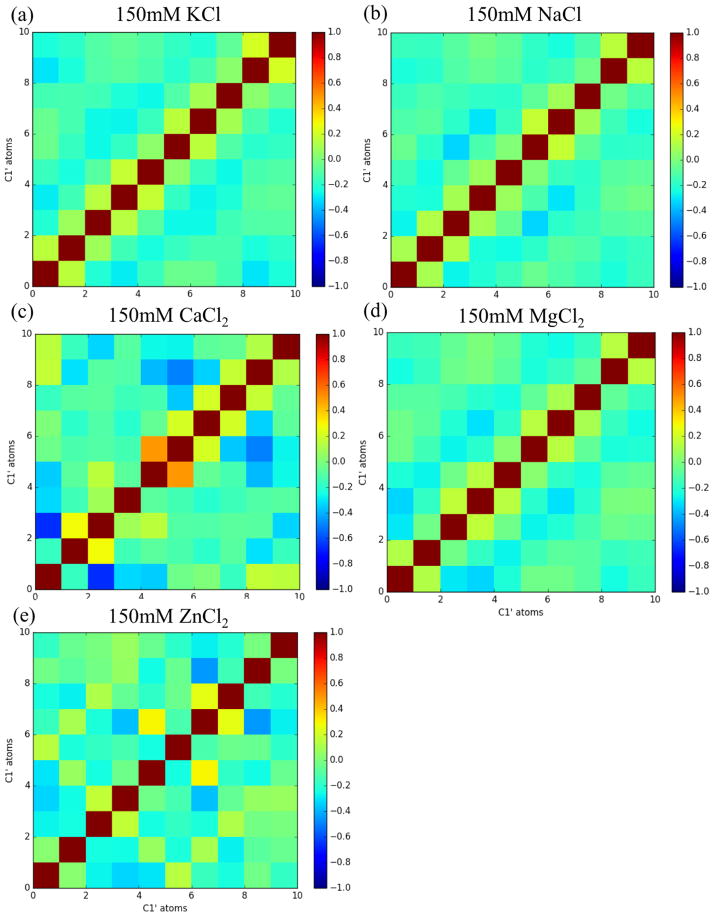
Calculating correlation matrices for F10 C1′ atoms (Figure 4) reveals little intramolecular communication in the form of highly correlated or anti-correlated motions in simulations solvated with KCl, NaCl and MgCl2. However, F10 solvated in ZnCl2 does show some off-diagonal correlated motion (Figure 4e). More and stronger instances of off-diagonal correlation occurs in the simulation of F10 solvated in CaCl2 (Figure 4c).
Fig. 4.
C1′ correlation matrices of each system indicates little communication occurring between nucleic bases in simulations of F10 solvated in 150mM KCl(a), NaCl (b) or MgCl2 (d). However, off-diagonal correlation and anti-correlation emerges most prominently in simulations solvated in 150mM CaCl2 (c) or ZnCl2 (e). The particularly strong correlation in the calcium-rich simulations is expected based on the structured conformations seen in Figure 2.
3.4 PCA
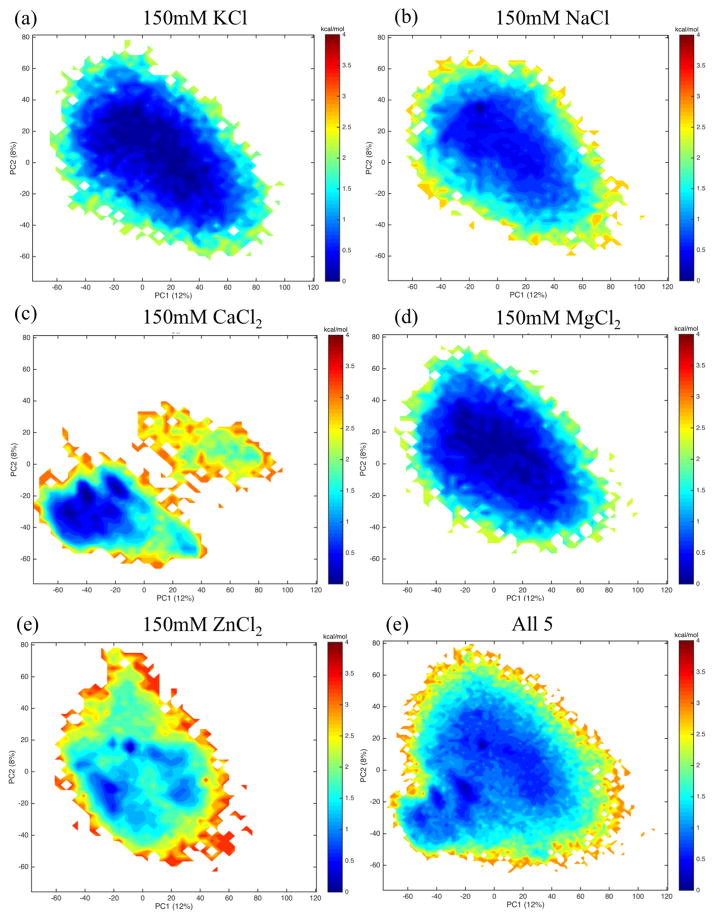
Projecting each system’s trajectory onto a common basis set (Figure 5 reveals much structural and kinetic overlap among simulations of F10 solvated with 150mM KCl(Figure 5a), 150mM NaCl (Figure 5b) and 150mM MgCl2 (Figure 5d). These projections also indicate that F10 solvated in 150mM CaCl2 explores a portion of the same space as the other systems but also ventures into its own unique region of principal component 1–2 space.
Fig. 5.
Projecting each system (a–e) onto a common basis (f) reveals that the simulations with F10 solvated in 150mM KCl(a), NaCl(b) or MgCl2 (d) overlap with one another in terms of the portion of PC1-2 space explored. F10 solvated in 150mM CaCl2 explores a portion of this same space but ventures into its own region of principal component space, unexplored by F10 in any other solvation condition. The narrow wells appearing in the projection of the ZnCl2-solvated system (e) indicates that zinc stabilizes regions of the other four systems.
Additionally, ZnCl2 seems to stabilize regions explored by the other systems. Note that the area of PCA1-2 space explored by the systems rich in zinc, potassium, sodium and magnesium fall roughly in the same region of the principal component space. However, the latter three system projections are each one wide well. The zinc system, however, is relatively shallow in most of the space but has a few regions of much lower free energy.
3.5 Base-base interactions
Analysis of base-base interactions revealed that F10 is least likely to form base-base interactions (hydrogen bonds among two or more bases) in 150mM NaCl and most likely to form base-base interactions in 150mM ZnCl2 (Figure 6). F10 solvated in 150mM NaCl formed at least one base-base interaction in only 10.5% of trajectory frames. When solvated in 150mM ZnCl2, F10 formed at least one base-base interaction in 28.4% of trajectory frames. The distribution of number of base-base interactions formed in each solvent condition is include in Supplemental Information Figure 3.
Fig. 6.
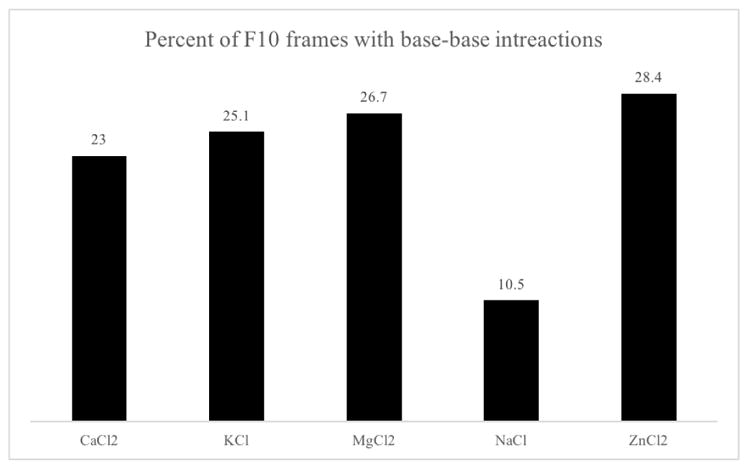
Calculating the percent of frames with at least one base-base interaction in each system shows that F10 solvated in 150mM NaCl is the least structured in terms of hydrogen bonds involving two or more bases. Zinc-rich simulations of F10 had the highest percentage of frames with at least one base-base interaction. Here we see that the higher level of kinetic stability seen in simulations of F10 solvated in zinc chloride (Figure 1) is due to hydrogen bonds between bases. However, the relatively lower percentage of base-base interactions in calcium-rich simulations indicates that the high level of stability seen in calcium-chloride-solvated simulations is not due to more frequent or long-lasting hydrogen bonds between bases.
3.6 Radial distribution functions
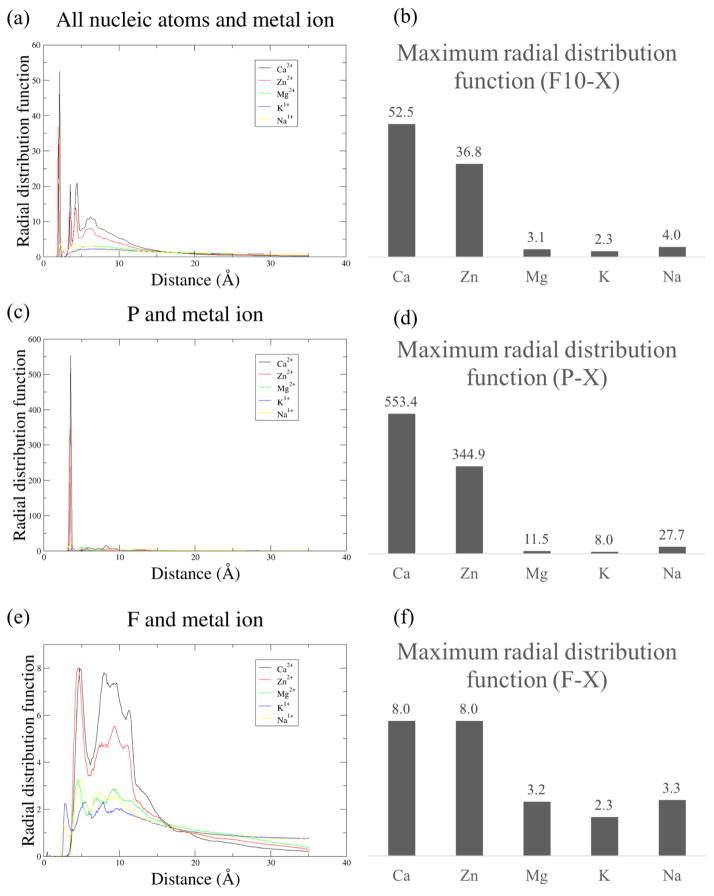
The radial distribution function of F10 to each of the solvent ions investigated reveals that calcium and zinc tend to form short-range interactions with F10 while magnesium, potassium and sodium tend to form long-range interactions (Figure 7a–b). The highest peak in the radial distribution function of any F10 atom to any calcium atom is 52.5 and occurs at a radius of 2.15Å. The highest peak in the radial distribution function of any F10 atom to any zinc atom is 36.8 and occurs at a radius of 1.95Å.
Fig. 7.
The radial distribution functions of nucleic atoms and metal ions for each system implicates short-range interactions with metal ions as responsible for the relatively higher level of stability observed in calcium-rich and zinc-rich simulations of F10 (a–b). Additionally, comparing radial distribution functions for phosphorous atoms – found only on the nucleic backbone – and metal ions (c–d) with radial distribution functions for fluorine atoms – found only on nucleic bases – suggests it is backbone interactions with zinc and calcium rather than nitrogenous base interactions with the metal ions that are responsible for this stability.
All metal ions prefer interacting with F10’s backbone to F10’s nucleic bases. This phenomenon is seen by comparing the radial distribution function of metal ions to phosphorous atoms, which are located in F10’s backbone, with that of metal ions to fluorine atoms, which are located in F10’s bases (Figure 7c–f).
The radial distribution function of F10’s phosphorous atoms to calcium ions indicates a strong affinity between these two sets of atoms. Among the five ions investigated, calcium shows the highest affinity for F10 overall (Figure 7) and F10’s phosphorous atoms (Figure 7c–d). The highest peak in the radial distribution function of any F10 phosphorous atom to any calcium atom is 553.4 and occurs at a radius of 3.55Å.
Zinc also shows a relatively high affinity for F10 and its phosphate groups. The highest peak in the radial distribution function of any F10 phosphorous atom to any calcium atom is 334.9 and occurs at a radius of 3.45Å. The peaks in radial distribution functions of magnesium, potassium and sodium to F10 and the phosphorous atoms on its backbone are an order of magnitude lower than those of calcium and zinc (Figure 7).
3.7 Visualizing ion interactions
Visual inspection of ion positions relative to F10 atoms (Figure 8) shows close range interactions between calcium and zinc ions with F10 phosphate groups, commensurate with radial distribution function analysis (Figure 7). In two of the three stable, high population states seen in calcium simulations, calcium ions mediate interactions between bases (Figure 8b–c). These phosphate-calcium-phosphate interactions appear to be stabilizing hairpin-like structures.
Fig. 8.
Visual inspection confirms that calcium (a–c) and zinc (d) form close-range interactions with the most stable conformations of F10. In both systems, we see instances of both single and multiple phosphate groups interacting with the metal ions. The cluster representatives shown here correspond to those in Figure 2. F10 is visualized with both New Ribbons and CPK representations from VMD. In the ribbons, F10 is colored by segment. Calcium is shown as blue, and zinc as gray in VDW representation.
These metal-ion-mediated phosphate interactions do not appear in the stable, high population state observed in a zinc-rich simulation (Figure 8d). Rather, in this stable state, zinc interactions and the F10 conformation they induce appear similar to the representative structure of HDBSCAN cluster 4 (Figure 8a) from the calcium-rich simulations.
4 Discussion
4.1 High-population structural states
From HDBSCAN clustering of F10 structures from each solvent condition, we see that calcium and zinc induce consistently preferred structures (Figure 2) with lifespans of up to a few microseconds (Supplemental Figure 1). These structures are compact, as seen visually and confirmed with both worm-like chain persistence length (Table 1) and RGYR (Supplemental Figure 2) calculations. Previous experimental results have shown that calcium chloride is particularly effective at reducing the worm-like chain persistence length of single-stranded DNA, 26 consistent with our specific predictions for calcium and F10 presented here. Additionally, sodium chloride has been experimentally shown to induce the larger persistence lengths in single-stranded DNA, 16,26 again consistent with the predictions of our simulations of F10.
In the case of calcium-rich simulations, the formation of stable states corresponds to more and stronger correlated motions than observed in any other solvent condition (Figure 4). That is, along with the stability of these high-population states comes increased intramolecular communication in the form of correlated motions. However, these calcium-induced structures are relatively less structured than those in other solvation conditions, as only the sodium-rich simulations showed a lower likelihood of forming base-base interactions than the calcium-rich simulations (Figure 6).
A similar, though less stark, increase in off-diagonal correlated motions emerged in zinc-rich simulations (Figure 4), accompanying a high population structural state (Figure 2d). When solvated in 150mM ZnCl2, we also saw that F10 was most likely to form at least one base-base interaction (Figure 6), indicating zinc-induced states are more structured (in terms of hydrogen bonds involving two or more bases) while having less correlated motion than calcium-rich simulations.
From PCA projections onto a common basis set, we see that calcium induces F10 to explore a unique portion of principal component 1–2 space not explored when in solution with other metal ions (Figure 5). Zinc, on the other hand, stabilizes particular structures that are explored when in solution with potassium, magnesium or sodium (Figure 5e).
From our molecular dynamics simulations, we predict that calcium induces F10 to form unique, stable – relatively unstructured – states that exhibit higher levels of correlated motion than the other metal ions investigated. Therefore, if one wants to induce kinetically stable (on a microsecond timescale) states of F10, we recommend preparation of the polymer in a calcium-rich environment. However, induce the formation of hydrogen bonds among F10 bases, we recommend preparation of the polymer in a zinc-rich environment.
Various effects of metal ions with respective to nucleic acid structural and thermodynamic stability have been experimentally observed. 14–17,19,20,22,26,27,61 Here we predict specific interactions with F10, namely that both calcium and zinc induce stable states with calcium inducing the most stable states and zinc inducing the most structured states.
4.2 Metal ion interactions
From the analysis of metal ion and nucleic acid interactions with radial distribution functions, we see that calcium and zinc prefer to form close-range (around 2Å) interactions with F10 whole magnesium, potassium and sodium form longer range interactions in more of a diffuse ion cloud, a typical type of ion interaction that has been experimentally observed. 26,50,62
Close-range interactions of F10 and zinc (Figures 7 and 8d) have been predicted with first principle calculations and confirmed experimentally. 34 However, the experimentally confirmed interactions were with F10’s nitrogenous base, not the phosphodiester backbone. We have resolved this apparent conflict with molecular-dynamics-based predictions of F10 and zinc interactions elsewhere, 13 showing a mechanism of complexation that involves zinc-induced deprotonation of F10. In this previous study, we used the same forcefield parameters used here (see Methods) to reproduce experimental the results of Ghosh et al., 2011. 34 Such interactions of F10 and zinc are of particular interest in drug discovery, as both are cytotoxic, and zinc has been demonstrated efficacious for selectively treating prostatic adenocarcinoma. 63,64
Close-range interactions of F10 and calcium have not previously been observed or specifically predicted. However, the effects of calcium on nucleic acids has been a topic of interest for several decades. 65–72 From our simulations, we predict that calcium has the highest affinity for F10 of any of the ions tested (Figure 7a–b). Additionally, we predict that short-range calcium interactions are primarily with F10’s phosphate groups (Figures 7c–f and 8a–c). The F10-calcium interactions predicted by our simulations may indicate a potential avenue of investigation for F10 delivery, as calcium increases the likelihood of cellular uptake of extracellular DNA by means of endocytosis. 65,67,73
We have discussed in previous work the interactions of F10 and magnesium. 13 Our work and other computational and experimental studies indicate that a hemiprotonated state (every other N3 atom deprotonated) is necessary for close-range interactions between F10 and Magnesium. 13,34
4.3 Cellular transport
While other metal ions are present, the dominant intracellular ions are K+, and the dominant extracellular ions are Na+. Therefore, comparing the predictions of our simulations of F10 in 150mM KCl with those of F10 in 150mM NaCl may provide insights about the behavior of the polymer with respect to drug delivery systems.
Unfortunately, as indicated by HDBSCAN clustering, F10 does not assume a single stable structure in either the potassium-rich or sodium-rich simulated solvent conditions, so we cannot predict a structure for F10 in these conditions. However, there are general structural and kinetic properties we can predict from these results. The most obvious property is that F10 is structurally unstable in both solvent conditions – having no single conformation that exists for more than a few nanoseconds (Supplemental Figure 1).
From the persistence lengths calculated in Table 1, our simulations indicate that F10 is overall more compact and flexible in a sodium-rich environment. This assertion – with regards to compactness – is backed up by a a narrowing of the distribution of F10 RGYR values in 150mM NaCl compared to 150mM KCl (Supplemental Figure 2). Therefore, we would predict that as F10 moves into a cell, it would become more elongated and rigid than it would be outside of the cell.
The percentage of frames observed to have base-base interactions in various solvent conditions (Figure 6) indicates that F10 is least structured in 150mM NaCl. Therefore, we would predict that as F10 moves into a cell it would becomes more structured, having more hydrogen bonds form among bases.
5 Conclusions
Based on a total of 80 microseconds of all-atom molecular dynamics data, we predict that F10’s phosphate groups have a relatively high affinity for calcium and zinc ions, being most attracted to calcium of the five ions investigated here. We find that the primary interactions of F10 with calcium and zinc are close-range (2Å) while the interactions with magnesium, sodium and potassium are long-range. Interactions of F10 and zinc have been investigated in other computational 13,34 and experimental studies, 34 parameters from which were used in simulations performed here. However, F10’s interactions with calcium have not been previously been investigated. These interactions deserve further investigation, as they may indicate a avenues of investigation for F10 delivery systems.
Given the prevalence of sodium ions in in vivo extracellular environments and that of potassium in intracellular environments, our respective simulations rich in these ions provide insight into F10’s behavior with regards to cellular transport. Our simulations predict that F10 would be more compact and flexible in an extracellular environment. Additionally, they predict that F10 would form more base-base interactions in an intracellular environment.
The concentrations of NaCl and KCl in our computational studies mimic those in extracellular and intracellular environments respectively. However, concentrations of the other ions investigated are much higher than physiological concentrations. We intend the results from these studies to inform laboratory preparation of F10 in various in vitro environments.
F10 has strong activities in multiple pre-clinical models of cancer and is more efficacious and better tolerated 5–12 than 5-fluorouracil (5-FU). 74,75 Given the oligonucleotide’s demonstrated promise as an anti-cancer therapeutic, we hope that the metal-ion-dependent behavior of F10 predicted here encourages and informs future work into F10 delivery systems.
Supplementary Material
Acknowledgments
Crystallography & Computational Biosciences services were supported by the Comprehensive Cancer Center of Wake Forest University NCI CCSG P30CA012197 grant. This work was partially supported by National Institutes of Health grant T32-GM095440, supporting RLM. Some computations were performed on the Wake Forest University DEAC Cluster, a centrally managed resource with support provided in part by the University. FRS also acknowledges a Reynolds Research leave from Wake Forest University.
Footnotes
Electronic Supplementary Information (ESI) available: [details of any supplementary information available should be included here]. See DOI: 10.1039/b000000x/
6.0.1 Conflict of interest statement
Dr. Gmeiner is an owner of Salzburg Therapeutics, the company holding licenses for FdUMP-[N].
References
- 1.Cate JH, Hanna RL, Doudna JA. Nature structural biology. 1997;4:553–558. doi: 10.1038/nsb0797-553. [DOI] [PubMed] [Google Scholar]
- 2.Pyle AM. Metal ions in the structure and function of RNA. 2002. [DOI] [PubMed] [Google Scholar]
- 3.Reichow S, Varani G. Structural biology: RNA switches function. 2006. [DOI] [PubMed] [Google Scholar]
- 4.Elliot D, Ladomery M. Molecular Biology of RNA. Oxford University Press; Oxford: 2011. [Google Scholar]
- 5.Liao ZY, Sordet O, Zhang HL, Kohlhagen G, Antony S, Gmeiner WH, Pommier Y. Cancer research. 2005;65:4844–51. doi: 10.1158/0008-5472.CAN-04-1302. [DOI] [PubMed] [Google Scholar]
- 6.Bijnsdorp IV, Comijn EM, Padron JM, Gmeiner WH, Peters GJ. Oncology reports. 2007;18:287–91. doi: 10.3892/or.18.1.287. [DOI] [PubMed] [Google Scholar]
- 7.Gmeiner WH, Reinhold WC, Pommier Y. Molecular cancer therapeutics. 2010;9:3105–14. doi: 10.1158/1535-7163.MCT-10-0674. [DOI] [PMC free article] [PubMed] [Google Scholar]
- 8.Gmeiner WH, Skradis A, Pon RT, Liu J. Nucleosides & nucleotides. 1999;18:1729–30. doi: 10.1080/07328319908044836. [DOI] [PubMed] [Google Scholar]
- 9.Pardee TS, Gomes E, Jennings-Gee J, Caudell D, Gmeiner WH. Blood. 2012;119:3561–70. doi: 10.1182/blood-2011-06-362442. [DOI] [PMC free article] [PubMed] [Google Scholar]
- 10.LIU J, KOLATH J, ANDERSON J, KOLAR C, LAWSON TA, ALMADGE JT, GMEINER WH. Antisense and Nucleic Acid Drug Development. 1999;9:481–486. doi: 10.1089/oli.1.1999.9.481. [DOI] [PubMed] [Google Scholar]
- 11.Liu J, Skradis A, Kolar C, Kolath J, Anderson J, Lawson T, Talmadge J, Gmeiner WH. Nucleosides and Nucleotides. 1999;18:1789–1802. doi: 10.1080/07328319908044843. [DOI] [PubMed] [Google Scholar]
- 12.Liu C, Willingham M, Liu J, Gmeiner WH. International journal of oncology. 2002;21:303–8. [PubMed] [Google Scholar]
- 13.Melvin RL, Gmeiner WH, Salsbury FR., Jr The Journal of Physical Chemistry B. 2016;120:10269–10279. doi: 10.1021/acs.jpcb.6b07753. [DOI] [PMC free article] [PubMed] [Google Scholar]
- 14.Draper DE. Biophysical journal. 2008;95:5489–95. doi: 10.1529/biophysj.108.131813. [DOI] [PMC free article] [PubMed] [Google Scholar]
- 15.Draper DE. RNA. 2004;10:335–343. doi: 10.1261/rna.5205404. [DOI] [PMC free article] [PubMed] [Google Scholar]
- 16.Chen H, Meisburger SP, Pabit Sa, Sutton JL, Webb WW, Pollack L. Proceedings of the National Academy of Sciences of the United States of America. 2012;109:799–804. doi: 10.1073/pnas.1119057109. [DOI] [PMC free article] [PubMed] [Google Scholar]
- 17.Woodson Sa. Current opinion in chemical biology. 2005;9:104–9. doi: 10.1016/j.cbpa.2005.02.004. [DOI] [PubMed] [Google Scholar]
- 18.Muthukumar M. The Journal of chemical physics. 2004;120:9343–50. doi: 10.1063/1.1701839. [DOI] [PubMed] [Google Scholar]
- 19.Stein A, Crothers DM. Biochemistry. 1976;15:160–8. doi: 10.1021/bi00646a025. [DOI] [PubMed] [Google Scholar]
- 20.Bond JP, Anderson CF, Record MT. Biophysical journal. 1994;67:825–36. doi: 10.1016/S0006-3495(94)80542-9. [DOI] [PMC free article] [PubMed] [Google Scholar]
- 21.Misra VK, Draper DE. Journal of molecular biology. 2000;299:813–25. doi: 10.1006/jmbi.2000.3769. [DOI] [PubMed] [Google Scholar]
- 22.Grilley D, Misra V, Caliskan G, Draper DE. Biochemistry. 2007;46:10266–78. doi: 10.1021/bi062284r. [DOI] [PubMed] [Google Scholar]
- 23.McFail-Isom L, Sines CC, Williams LD. Current Opinion in Structural Biology. 1999;9:298–304. doi: 10.1016/S0959-440X(99)80040-2. [DOI] [PubMed] [Google Scholar]
- 24.Qiu X, Andresen K, Kwok LW, Lamb JS, Park HY, Pollack L. Physical Review Letters. 2007;99:038104. doi: 10.1103/PhysRevLett.99.038104. [DOI] [PubMed] [Google Scholar]
- 25.Chin K, Sharp Ka, Honig B, Pyle aM. Nature structural biology. 1999;6:1055–61. doi: 10.1038/14940. [DOI] [PubMed] [Google Scholar]
- 26.McIntosh D, Saleh O. Macromolecules. 2011. pp. 2328–2333. [Google Scholar]
- 27.Mao AH, Crick SL, Vitalis A, Chicoine CL, Pappu RV. Proceedings of the National Academy of Sciences of the United States of America. 2010;107:8183–8. doi: 10.1073/pnas.0911107107. [DOI] [PMC free article] [PubMed] [Google Scholar]
- 28.Gmeiner WH, Gearhart PJ, Pommier Y, Nakamura J. Future Oncology. 2016:2016-0127. doi: 10.2217/fon-2016-0127. [DOI] [PMC free article] [PubMed] [Google Scholar]
- 29.Gmeiner WH, Debinski W, Milligan C, Caudell D, Pardee TS. Future Oncology. 2016;12:2009–2020. doi: 10.2217/fon-2016-0091. [DOI] [PMC free article] [PubMed] [Google Scholar]
- 30.Wang Y, Miao L, Satterlee A, Huang L. Advanced Drug Delivery Reviews. 2015;87:68–80. doi: 10.1016/j.addr.2015.02.007. [DOI] [PMC free article] [PubMed] [Google Scholar]
- 31.Harvey MJ, Giupponi G, Fabritiis GD. Journal of Chemical Theory and Computation. 2009;5:1632–1639. doi: 10.1021/ct9000685. [DOI] [PubMed] [Google Scholar]
- 32.Darden T, York D, Pedersen L. The Journal of Chemical Physics. 1993;98:10089. [Google Scholar]
- 33.Harvey MJ, De Fabritiis G. Journal of Chemical Theory and Computation. 2009;5:2371–2377. doi: 10.1021/ct900275y. [DOI] [PubMed] [Google Scholar]
- 34.Ghosh S, Salsbury FR, Jr, Horita Da, Gmeiner WH. Nucleic Acids Research. 2011;39:4490–4498. doi: 10.1093/nar/gkr029. [DOI] [PMC free article] [PubMed] [Google Scholar]
- 35.Gmeiner WH, Salsbury FR, Jr, Olsen CM, Marky La. Journal of nucleic acids. 2011;2011:631372. doi: 10.4061/2011/631372. [DOI] [PMC free article] [PubMed] [Google Scholar]
- 36.Ghosh S, Salsbury FR, Jr, Horita Da, Gmeiner WH. Journal of Biomolecular Structure and Dynamics. 2013;31:1301–1310. doi: 10.1080/07391102.2012.732343. [DOI] [PMC free article] [PubMed] [Google Scholar]
- 37.Salsbury FR., Jr Current Opinion in Pharmacology. 2010;10:738–744. doi: 10.1016/j.coph.2010.09.016. [DOI] [PMC free article] [PubMed] [Google Scholar]
- 38.Godwin RC, Melvin R, Salsbury FR., Jr . Computer-Aided Drug Discovery. Springer; New York, New York, NY: 2015. pp. 1–30. [Google Scholar]
- 39.Humphrey W, Dalke A, Schulten K. Journal of molecular graphics. 1996;14:33–8. doi: 10.1016/0263-7855(96)00018-5. [DOI] [PubMed] [Google Scholar]
- 40.Obst S, Stote RH. Journal of Molecular Modeling. 1998;4:145–146. [Google Scholar]
- 41.Yu H, Whitfield TW, Harder E, Lamoureux G, Vorobyov I, Anisimov VM, MacKerell AD, Roux B. Journal of Chemical Theory and Computation. 2010;6:774–786. doi: 10.1021/ct900576a. [DOI] [PMC free article] [PubMed] [Google Scholar]
- 42.Mamatkulov S, Fyta M, Netz RR. The Journal of chemical physics. 2013;138:024505. doi: 10.1063/1.4772808. [DOI] [PubMed] [Google Scholar]
- 43.Šponer J, Banáš P, Jurečka P, Zgarbová M, Kührová P, Havrila M, Krepl M, Stadlbauer P, Otyepka M. Journal of Physical Chemistry Letters. 2014;5:1771–1782. doi: 10.1021/jz500557y. [DOI] [PubMed] [Google Scholar]
- 44.Šponer J, Cang X, Cheatham TE. Methods. 2012;57:25–39. doi: 10.1016/j.ymeth.2012.04.005. [DOI] [PMC free article] [PubMed] [Google Scholar]
- 45.Banáš P, Hollas D, Zgarbová M, Jurečka P, Orozco M, Cheatham TE, Šponer J, Otyepka M. Journal of Chemical Theory and Computation. 2010;6:3836–3849. doi: 10.1021/ct100481h. [DOI] [PMC free article] [PubMed] [Google Scholar]
- 46.MacKerell AD, Banavali N, Foloppe N. Biopolymers. 2000;56:257–265. doi: 10.1002/1097-0282(2000)56:4<257::AID-BIP10029>3.0.CO;2-W. [DOI] [PubMed] [Google Scholar]
- 47.Zhu X, Lopes PEM, Mackerell AD. Wiley Interdisciplinary Reviews: Computational Molecular Science. 2012;2:167–185. doi: 10.1002/wcms.74. [DOI] [PMC free article] [PubMed] [Google Scholar]
- 48.MacKerell AD, Banavali NK. Journal of Computational Chemistry. 2000;21:105–120. [Google Scholar]
- 49.Auffinger P, Hashem Y. Current Opinion in Structural Biology. 2007;17:325–333. doi: 10.1016/j.sbi.2007.05.008. [DOI] [PubMed] [Google Scholar]
- 50.Lipfert J, Doniach S, Das R, Herschlag D. Annual review of biochemistry. 2014;83:813–41. doi: 10.1146/annurev-biochem-060409-092720. [DOI] [PMC free article] [PubMed] [Google Scholar]
- 51.Campello RJGB, Moulavi D, Sander J. Advances in Knowledge Discovery and Data Mining. Springer-Verlag; Berlin: 2013. pp. 160–172. [Google Scholar]
- 52.Campello RJGB, Moulavi D, Zimek A, Sander J. ACM Transactions on Knowledge Discovery from Data. 2015;10:1–51. [Google Scholar]
- 53.Melvin RL, Godwin RC, Xiao J, Thompson WG, Berenhaut KS, Salsbury FR., Jr Journal of Chemical Theory and Computation. 2016;12:6130–6146. doi: 10.1021/acs.jctc.6b00757. [DOI] [PMC free article] [PubMed] [Google Scholar]
- 54.Xiao J, Salsbury FR., Jr A Matlab script to perform PCA on molecular dynamics trajectories. 2016 https://figshare.com/articles/A_Matlab_script_to_perform_PCA_on_molecular_dynamics_trajectories/3822156.
- 55.Lu XJ, Olson WK. Nature protocols. 2008;3:1213–27. doi: 10.1038/nprot.2008.104. [DOI] [PMC free article] [PubMed] [Google Scholar]
- 56.Lu XJ, Olson WK, Bussemaker HJ. Nucleic acids research. 2010;38:4868–76. doi: 10.1093/nar/gkq155. [DOI] [PMC free article] [PubMed] [Google Scholar]
- 57.Lu XJ, Olson WK. Nucleic acids research. 2003;31:5108–21. doi: 10.1093/nar/gkg680. [DOI] [PMC free article] [PubMed] [Google Scholar]
- 58.Stone J. PhD thesis. Computer Science Department, University of Missouri-Rolla; 1998. [Google Scholar]
- 59.Melvin RL, Salsbury FR., Jr Journal of Molecular Graphics and Modelling. 2016;67:44–53. doi: 10.1016/j.jmgm.2016.05.001. [DOI] [PMC free article] [PubMed] [Google Scholar]
- 60.Melvin R, Salsbury FR., Jr VisualStatistics. 2015 http://dx.doi.org/10.6084/m9.figshare.1601897.
- 61.Aoki S, Kimura E. Chemical Reviews. 2004;104:769–788. doi: 10.1021/cr020617u. [DOI] [PubMed] [Google Scholar]
- 62.Shiman R, Draper DE. Journal of molecular biology. 2000;302:79–91. doi: 10.1006/jmbi.2000.4031. [DOI] [PubMed] [Google Scholar]
- 63.Liang JY, Liu YY, Zou J, Franklin RB, Costello LC, Feng P. The Prostate. 1999;40:200–207. doi: 10.1002/(sici)1097-0045(19990801)40:3<200::aid-pros8>3.0.co;2-3. [DOI] [PMC free article] [PubMed] [Google Scholar]
- 64.Uzzo RG, Leavis P, Hatch W, Gabai VL, Dulin N, Zvartau N, Kolenko VM. Clinical cancer research: an official journal of the American Association for Cancer Research. 2002;8:3579–83. [PubMed] [Google Scholar]
- 65.Chen CA, Okayama H. BioTechniques. 1988;6:632–638. [PubMed] [Google Scholar]
- 66.Einhäuser T, Galanski M, Vogel E, Keppler B. Inorganica Chimica Acta. 1997;257:265–268. [Google Scholar]
- 67.Graham FL, van der Eb AJ. Virology. 1973;52:456–467. doi: 10.1016/0042-6822(73)90341-3. [DOI] [PubMed] [Google Scholar]
- 68.Horrocks WD, Schmidt GF, Sudnick DR, Kittrell C, Bernheim RA. Journal of the American Chemical Society. 1977;99:2378–2380. doi: 10.1021/ja00449a079. [DOI] [PubMed] [Google Scholar]
- 69.Koutsodimou A, Kovala-Demertzi D, Katsaros N. Journal of Coordination Chemistry. 1998;43:1–12. [Google Scholar]
- 70.Shiraishi T, Pankratova S, Nielsen PE. Chemistry & Biology. 2005;12:923–929. doi: 10.1016/j.chembiol.2005.06.009. [DOI] [PubMed] [Google Scholar]
- 71.Wacker WEC, Vallee BL. The Journal of Biological Chemistry. 1959;234:3257–3263. [Google Scholar]
- 72.Zittle CA. The Journal of biological chemistry. 1946;163:111–7. [PubMed] [Google Scholar]
- 73.Chen Y. BIO-PROTOCOL. 2012;2:1–3. [Google Scholar]
- 74.Longley DB, Harkin DP, Johnston PG. Nature reviews Cancer. 2003;3:330–8. doi: 10.1038/nrc1074. [DOI] [PubMed] [Google Scholar]
- 75.HEIDELBERGER C, CHAUDHURI NK, DANNEBERG P, MOOREN D, GRIESBACH L, DUSCHINSKY R, SCHNITZER RJ, PLEVEN E, SCHEINER J. Nature. 1957;179:663–6. doi: 10.1038/179663a0. [DOI] [PubMed] [Google Scholar]
Associated Data
This section collects any data citations, data availability statements, or supplementary materials included in this article.


