Abstract
Spectral domain optical coherence tomography (SDOCT) is routinely used in the management and diagnosis of a variety of ocular diseases. This imaging modality also finds widespread use in research, where quantitative measurements obtained from the images are used to track disease progression. In recent years, the number of available scanners and imaging protocols grown and there is a distinct absence of a unified tool that is capable of visualizing, segmenting, and analyzing the data. This is especially noteworthy in longitudinal studies, where data from older scanners and/or protocols may need to be analyzed. Here, we present a graphical user interface (GUI) that allows users to visualize and analyze SDOCT images obtained from two commonly used scanners. The retinal surfaces in the scans can be segmented using a previously described method, and the retinal layer thicknesses can be compared to a normative database. If necessary, the segmented surfaces can also be corrected and the changes applied. The interface also allows users to import and export retinal layer thickness data to an SQL database, thereby allowing for the collation of data from a number of collaborating sites.
Keywords: graphical user interface, SDOCT, retina, visualization
1. INTRODUCTION
Spectral-domain optical coherence tomography (SDOCT)1, 2 provides high resolution images of retinal structures and as such has begun to play an important role in clinical practice. Structural changes associated with diseases can now be visualized and quantified in order to better diagnose and monitor a variety of retinal disorders, such as glaucoma3, 4 and age-related macular degeneration.5, 6 In addition to its increasing use in ophthalmology, SDOCT has also begun to find application in neurology to monitor the progression of diseases such as multiple sclerosis (MS),7, 8 Parkinson’s disease9, 10 and Alzhiemer’s disease,11 where retinal thicknesses have been found to correlate with disease severity. In addition to retinal thickness changes, a small percentage (< 5%) of MS patients also develop small pseudocysts or microcystic macular edema (MME). The presence of these cysts has been shown to correlate with disease severity but the underlying cause is yet to be determined. The MME are easily visualized in SDOCT, and thus it is also being used to carefully monitor MS patients for the presence of these elusive cysts.
A variety of scanners are now commercially available, but the information provided by the onboard software on the scanners can differ a great deal. Some scanners do not provide segmentations for all the retinal surfaces, or do not support the manual editing of segmented surfaces. The exported scans can also differ in file format, and often contain differing pieces of information. The Cirrus HD-OCT scanner (Carl Zeiss Meditec, Dublin CA), for instance, only provides the image data. The Spectralis scanner (Heidelberg Engineering, Germany) on the other hand, provides a scanning laser ophthalmoscope (SLO) image in addition to the OCT image data. Comparing quantitative information obtained from these two scanners is also difficult as the measurements obtained using the onboard software often disagree.12 Exporting measurements and patient information to a unified database is also not currently possible using the software provided by the scanner manufacturers.
Here, we describe a graphical user interface (GUI) that can be used to visualize OCT scans obtained from on Cirrus and Spectralis scanners. The volumes from either scanner can be segmented using our previously described approach13 and layer thickness measurements can be easily obtained and exported to an online SQL database or a local file. This approach also provides thickness measurements from Cirrus and Spectralis that agree closely.14 The integration with an online database also allows for the collation of data from multiple participating sites. In addition to retinal surfaces, an automated approach for the segmentation of pseudocysts15, 16 has also been integrated with the GUI. Also, this user interface will be made available at https://www.nitrc.org/projects/aura_tools/.
2. METHOD
Our software contains two GUIs, respectively called the visualization window and the thickness analysis window. The visualization window can load and display the selected OCT scan, show the corresponding fundus image (or SLO image if available), edit patient information, and load and edit segmentations. The thickness analysis window is used to analyze thickness measurements within selected or user-designed grids. The user can also compare the patient’s thickness measurements to a normative database, if one is available.
2.1 Visualization Window
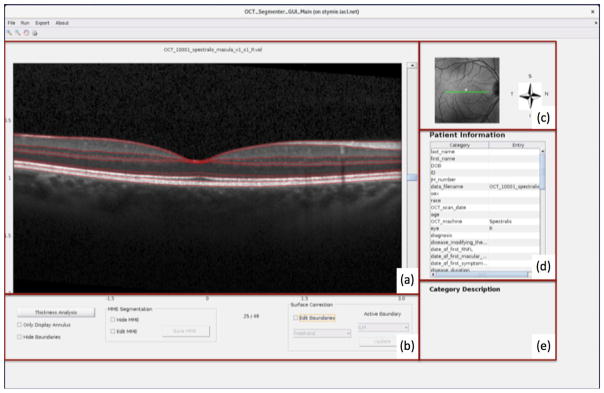
The visualization window is shown in Figure 1. Figure 1(a) is the display region for the B-scans of an OCT subject from either Cirrus or Spectralis scanners and Fig. 1(b) contains the segmentation editing tools. Figure 1(c) shows the corresponding fundus or SLO image. The “Patient Information” section, as shown in Fig. 1(d) is an editable table that displays demographic and diagnostic details. A brief description of each editable entry of the table is displayed in the “Category Description” area in the GUI (see Fig. 1(e)). An example with a Spectralis B-scan display is given in Figure 1.
Figure 1.
An example of the visualization window for image display and patient information editing.
2.1.1 Patient Information
The “Patient Information” table (see Fig. 1(d)) is initially populated with information that may be available in the SDOCT scan header. Additional details, such as the patient’s name, demographic details, diagnosis, etc. can also be added manually. If an SQL database is being used, these details are also saved along with the patients OCT measurements (see above for details). The GUI can also import patient information from the chosen database into the “Patient Information” table if the information exists.
2.1.2 Connection to Database
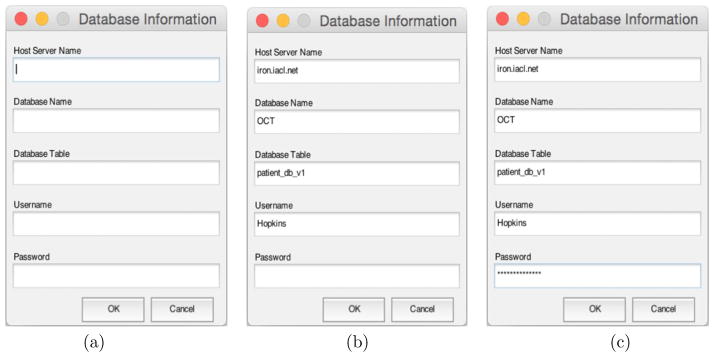
If a database is used to collate data, the user can connect to it by specifying the necessary information, which includes the host server, database table, and user information. The previously used details are recalled when the GUI is opened, as showed in Figure 2. For security reasons, the password is not saved and is converted into asterisks when entered by the user. Furthermore, the saved connection details are encrypted.
Figure 2.
Database Login Dialog: (a) is the initial login dialog; information recalled from a specific file in (b); the password converted into asterisks as showed in (c).
2.1.3 Integration of GUI with Automated Segmentation Methods
We integrated the GUI with automated methods to segment human retinal layers and (MME) in SDOCT scans. The method for human retinal layer segmentation, used in our GUI, is a previous published method that combines a random forest classifier17 and a graph-theoretic approach to simultaneously segment multiple retinal surfaces.13, 18 The MME segmentation method utilizes a random forest classifier to identify the cyst pixels.16, 19 The SDOCT scans can either be segmented and analyzed as single scans, or folders of scans can be selected and analyzed.
2.1.4 Manual Editing of Segmentations
Manual editing options are included for retinal surfaces as well as the MME segmentations. For the retinal layer segmentation, the GUI provides two segmentation modes: freehand and spline-based. In the freehand segmentation mode, the user can add or change each single point individually by clicking the left mouse button. Points can be deleted individually by clicking the right mouse button. Changing the position of a point does not affect the positions of any other points when editing in this mode. In the spline-based segmentation mode, the surface is represented using a 2D spline. The user can add and delete points using the left and right mouse buttons, respectively. However, changing the position of a point may affect the positions of other points on the surface. For example, if the user adds a point, a new control point will be generated and the spline is updated to reflect the additional point, as shown in Figure 3. Manually editing the segmentation will also cause the thickness measurements to be updated. For MME manual editing, the user can use a similar approach to add and delete a point within the B-scan.
Figure 3.
Human Retinal Layer Segmentation: the same point changed both in (a) freehand and (b) spline-based segmentation modes. Only part of each B-scan is shown.
2.2 Sub GUI: Thickness Analysis Window
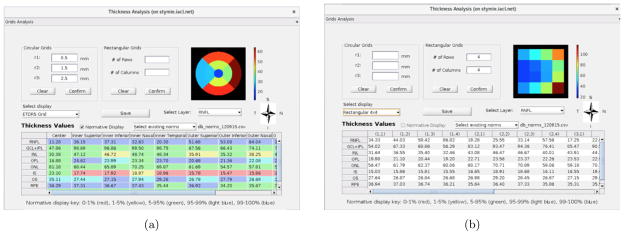
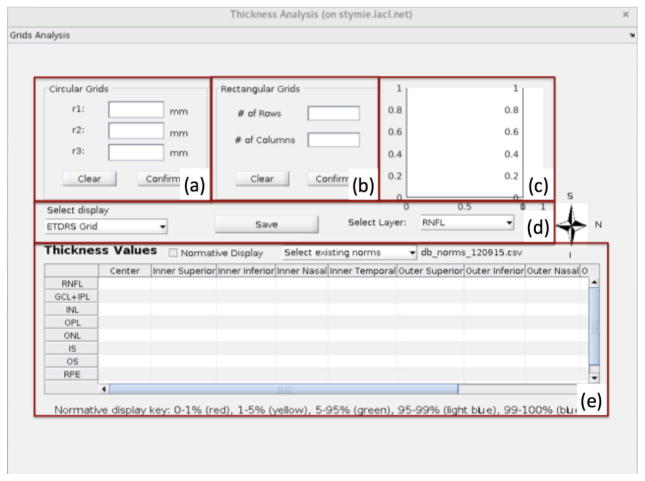
The thickness analysis window will display once the user clicks the “Thickness Analysis” button in the main GUI (see Fig. 1(b)). This window allows the user to design various rectangular and circular grids for layer thickness analysis. Clinicians like to display the retinal thickness measurements on a fixed grid system known as early treatment diabetic retinopathy study regions (ETDRS) grid.20 This grid is centered on the fovea and is made up of nine regions, which are a center circle and two tori divided into quadrants; an example can be seen in Fig. 5(a). Within the thickness analysis window the default display grid is ETDRS, which can be customized. In addition to ETDRS, we provide options of mean macular thickness (computed within a 5×5mm square centered on the fovea), 2×2 rectangular or 4×4 rectangular grids. These values can be visualized, and are also displayed in the table, as shown in Fig. 5. The user can also input corresponding radii for three concentric circles in Fig. 4(a), or input the number of rows and the number of columns for rectangular grids as shown in Fig. 4(b). Figure 4(c) shows the corresponding grids and color bar representing the thickness, in order to allow the user to compare the average thickness value within each region.
Figure 5.
The figure displaying enface views and thickness-measurement tables of one subject; thickness analysis within nine ETDRS grids including the comparison to a normative database shown in (a), and thickness analysis within 4×4 rectangular grids shown in (b).
Figure 4.
The layout of the sub user interface for thickness analysis.
The patient’s thickness measurements can also be compared with a normative database. If an SQL database is in use, the measurements available in the online database is used for the comparison. Alternatively, an offline comma separated file (.csv) containing the normative values can also be used. The current normative database contains 100 subjects whose segmentations have been reviewed and any errors corrected. Since a normative database is only available for the nine ETDRS regions currently, the “Normative Display” button will be enabled only when the user selects “ETDRS Grid” or inputs correct corresponding radii in the “Circular Grids” panel. If any of the surfaces are manually edited (and the edits saved), the retinal layer thicknesses are recomputed immediately. The finalized thickness measurements can also be exported to a local .csv file or to the SQL database. An example of the comparison between the patient’s thickness measurements and the normative thickness measurements is shown in Fig. 4(e).
3. DEMONSTRATION
The functioning of the GUI is demonstrated in this section using scans from the two SDOCT scanners—Cirrus and Spectralis, as well as scans from healthy and MS patients.
3.1 Case 1: Comparison between Cirrus Scans and Spectralis Scans for One Normal Subject
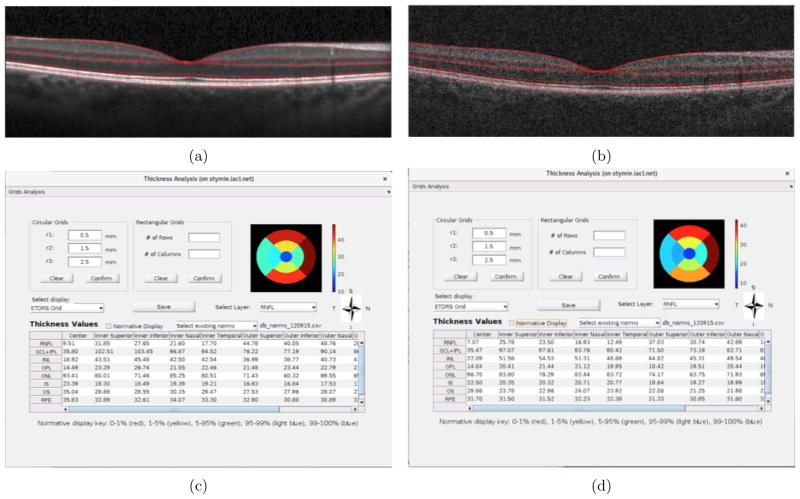
Figure 6 shows a comparison between a Spectralis and a Cirrus scan obtained from the right eye of a healthy subject. The central B-scans from the two scanners are shown in Figs. 6(a) and (b), respectively. The thickness analysis within the ETDRS grid for the RNFL from the two scans is as shown in Figs. 6(c) and (d)).
Figure 6.
A scan of the Spectralis volume shown in (a); a scan of the corresponding Cirrus volume shown in (b); the thickness analysis for the Spectralis volume shown in (c); the thickness analysis for the Spectralis volume shown in (d); the enface view of RNFL computed within the ETDRS grid for both volumes.
3.2 Case 2: Comparison between One Normal Subject and One MS Subject on Cirrus Scanner
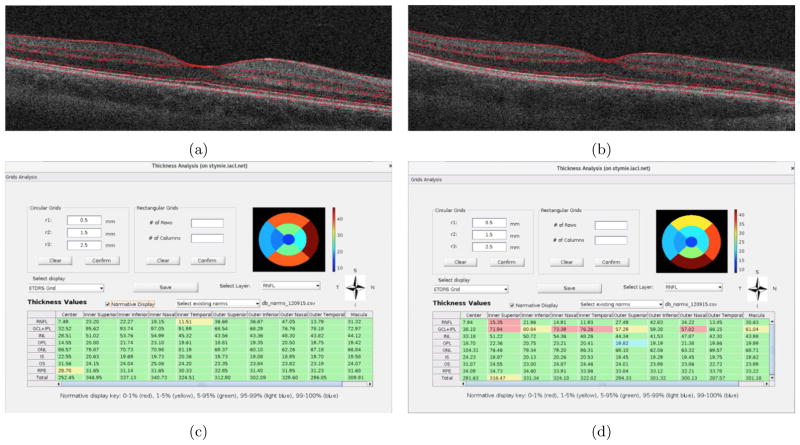
Figures 7(a) and 7(b) show the central B-scans obtained from a healthy control and MS patient, respectively. The comparison of the thickness measurements of the two scans with the normative database quickly highlight the regions of most change—namely the RNFL and the GC+IPL in the MS subject (see Figs. 7(c) and (d)).
Figure 7.
The central B-scans of RNFL thickness computed within the ETDRS grid from a (a) healthy control subject and an (b) MS subject. The table displaying thickness measurements from a (c) healthy control and an (d) MS subject.
3.3 Case 3: A Subject with MME
The GUI can display human retinal subjects with MME, load and edit the MME segmentations, and analyze thickness measurements for MME subjects. The MME segmentations are initially displayed in yellow when the user loads it, and turn to green once the user checks “Edit MME” box. For MME manual editing, the user can add and delete points using the left and right mouse buttons respectively within the segmentation, as shown in Fig. 8.
Figure 8.
MME Segmentation: the segmentation ready to edit in (a); an example of adding and deleting points showed within red circle in (b); only part of each B-scans is shown
4. CONCLUSION
We have developed a GUI to assist doctors and researchers to visualize and analyze SDOCT scans obtained on two commonly used scanners. The GUI incorporates multiple functions including auto-segmentation of retinal layers and MME, manually editing of segmentations and quantitative analysis of layer thickness measurements. It is noteworthy that this GUI allows for the incorporation of newly developed methods as they become available. The ability to segment cysts, for instance, is not currently available on any commercial scanner. The GUI also has the ability to connect to an SQL database, thus allowing for the collation of data from multiple participating sites. The full analysis pipeline is demonstrated, beginning with simple visualization of the data, all the way to quantitative analysis and comparison with a healthy control database. The availability of this software represents a significant step forward in the automated processing and sharing of retinal imaging data.
References
- 1.Huang D, Swanson EA, Lin CP, Schuman JS, Stinson WG, Chang W, Hee MR, Flotte T, Gregory K, Puliafito CA. Optical coherence tomography. Science. 1991;254(5035):1178–1181. doi: 10.1126/science.1957169. [DOI] [PMC free article] [PubMed] [Google Scholar]
- 2.Hee MR, Izatt JA, Swanson EA, Huang D, Schuman JS, Lin CP, Puliafito CA, Fujimoto JG. Optical coherence tomography of the human retina. Arch Ophthalmol. 1995;113(3):325. doi: 10.1001/archopht.1995.01100030081025. [DOI] [PubMed] [Google Scholar]
- 3.Hood DC, Slobodnick A, Raza AS, de Moraes CG, Teng CC, Ritch R. Early glaucoma involves both deep local, and shallow widespread, retinal nerve fiber damage of the macular region. Invest Ophthalmol Vis Sci. 2014 Jan;55:632–649. doi: 10.1167/iovs.13-13130. [DOI] [PMC free article] [PubMed] [Google Scholar]
- 4.Wollstein G, Paunescu LA, Ko TH, Fujimoto JG, Kowalevicz A, Hartl I, Beaton S, Ishikawa H, Mattox C, Singh O, Duker J, Drexler W, Schuman JS. Ultrahigh-resolution optical coherence tomography in glaucoma. Ophthalmology. 2005;112(2):229–237. doi: 10.1016/j.ophtha.2004.08.021. [DOI] [PMC free article] [PubMed] [Google Scholar]
- 5.Curcio CA, Medeiros NE, Millican CL. Photoreceptor loss in age-related macular degeneration. Invest Ophthalmol Vis Sci. 1996;37(7):1236–1249. [PubMed] [Google Scholar]
- 6.Schuman SG, Koreishi AF, Farsiu S, ho Jung S, Izatt JA, Toth CA. Photoreceptor layer thinning over drusen in eyes with age-related macular degeneration imaged In vivo with spectral-domain optical coherence tomography. Ophthalmology. 2009;116(3):488–496.e2. doi: 10.1016/j.ophtha.2008.10.006. [DOI] [PMC free article] [PubMed] [Google Scholar]
- 7.Saidha S, Sotirchos ES, Oh J, Syc SB, Seigo MA, Shiee N, Eckstein C, Durbin MK, Oakley JD, Meyer SA, Frohman TC, Newsome S, Ratchford JN, Balcer LJ, Pham DL, Crainiceanu CM, Frohman EM, Reich DS, Calabresi PA. Relationships between retinal axonal and neuronal measures and global central nervous system pathology in multiple sclerosis. JAMA Neurol. 2013;70(1):34–43. doi: 10.1001/jamaneurol.2013.573. [DOI] [PMC free article] [PubMed] [Google Scholar]
- 8.Cheng H, Laron M, Schiffman JS, Tang RA, Frishman LJ. The relationship between visual field and retinal nerve fiber layer measurements in patients with multiple sclerosis. Invest Ophthalmol Vis Sci. 2007;48(12):5798–5805. doi: 10.1167/iovs.07-0738. [DOI] [PMC free article] [PubMed] [Google Scholar]
- 9.Hajee ME, March WF, Lazzaro DR, Wolintz AH, Shrier EM, Glazman S, Bodis-Wollner IG. Inner retinal layer thinning in Parkinson disease. Arch Ophthalmol. 2009;127(6):737–741. doi: 10.1001/archophthalmol.2009.106. [DOI] [PubMed] [Google Scholar]
- 10.Polo V, Satue M, Rodrigo MJ, Otin S, Alarcia R, Bambo MP, Fuertes MI, Larrosa JM, Pablo LE. Visual dysfunction and its correlation with retinal changes in patients with Parkinson ’s disease: an observational cross-sectional study. BMJ Open. 2016;6(5):e009658. doi: 10.1136/bmjopen-2015-009658. [DOI] [PMC free article] [PubMed] [Google Scholar]
- 11.Pillai JA, Bermel R, Bonner-Jackson A, Rae-Grant A, Fernandez H, Bena J, Jones SE, Ehlers JP, Leverenz JB. Retinal nerve fiber layer thinning in Alzheimer’s disease: a case-control study in comparison to normal aging, Parkinson’s disease, and non-Alzheimer’s dementia. Am J Alzheimers Dis Other Demen. 2016;31(5):430–436. doi: 10.1177/1533317515628053. [DOI] [PMC free article] [PubMed] [Google Scholar]
- 12.Lammer J, Scholda C, Prünte C, Benesch T, Schmidt-Erfurth U, Bolz M. Retinal thickness and volume measurements in diabetic macular edema: a comparison of four optical coherence tomography systems. Retina. 2011;31(1):48–55. doi: 10.1097/IAE.0b013e3181e095a4. [DOI] [PubMed] [Google Scholar]
- 13.Lang A, Carass A, Hauser M, Sotirchos ES, Calabresi PA, Ying HS, Prince JL. Retinal layer segmentation of macular OCT images using boundary classification. Biomed Opt Express. 2013;4(7):1133–1152. doi: 10.1364/BOE.4.001133. [DOI] [PMC free article] [PubMed] [Google Scholar]
- 14.Bhargava P, Lang A, Al-louzi O, Carass A, Prince JL, Calabresi PA, Saidha S. Applying an open-source segmentation algorithm to different OCT devices in multiple sclerosis patients and healthy controls: implications for clinical trials. Mult Scler Int. 2015;2015:136295. doi: 10.1155/2015/136295. [DOI] [PMC free article] [PubMed] [Google Scholar]
- 15.Swingle EK, Lang A, Carass A, Ying HS, Calabresi PA, Prince JL. Microcystic macular edema detection in retina OCT images. SPIE Med Imaging 2014. 2014:90380G. [Google Scholar]
- 16.Lang A, Carass A, Al-Louzi O, Bhargava P, Ying HS, Calabresi PA, Prince JL. Longitudinal graph-based segmentation of macular OCT using fundus alignment. SPIE Med Imaging 2015. 2015;9413:94130M. doi: 10.1117/12.2077713. [DOI] [PMC free article] [PubMed] [Google Scholar]
- 17.Breiman L. Random forests. Mach Learn. 2001;45(1):5–32. [Google Scholar]
- 18.Li K, Wu X, Chen DZ, Sonka M. Optimal surface segmentation in volumetric images-a graph-theoretic approach. IEEE Trans Pattern Anal Mach Intell. 2006 Jan;28:119–134. doi: 10.1109/TPAMI.2006.19. [DOI] [PMC free article] [PubMed] [Google Scholar]
- 19.Swingle EK, Lang A, Carass A, Al-louzi O, Saidha S, Prince JL, Calabresi PA. Segmentation of microcystic macular edema in Cirrus OCT scans with an exploratory longitudinal study. SPIE Med Imaging 2015. 2015;9417:94170P. doi: 10.1117/12.2082164. [DOI] [PMC free article] [PubMed] [Google Scholar]
- 20.Early Treatment Diabetic Retinopathy Study Research Group. Grading diabetic retinopathy from stereoscopic color fundus photographsan extension of the modified airlie mouse classification: ETDRS report number 10. Ophthalmology. 1991;98(5):786–806. [PubMed] [Google Scholar]


