

Abstract
Aims
To examine the associations of BMI and waist circumference with glucose metabolism and (pre)diabetes among adults with BMI < 25 kg/m2.
Methods
We conducted a cross-sectional study in a nationally representative sample (10,098 men and 17,454 women) of Chinese adults aged ≥20 years with BMI < 25 kg/m2. Glucose levels after at least 10 hours of overnight fasting, at 30 minutes and at 120 minutes after a standard 75-g oral glucose load were measured. Associations of BMI and waist circumference with outcomes were examined by general linear models for continuous outcomes and by logistic regression models for dichotomous outcomes.
Results
Among those with BMI < 25 kg/m2, 18.8% of men and 17.1% of women had abnormal glucose metabolism, including 4.9% of men and 3.8% of women with undiagnosed type 2 diabetes. For each SD increase in BMI (2.1 kg/m2) and waist circumference (8.3 cm), fasting glucose levels increased by 0.128 and 0.170 mmol/L in men, and by 0.112 and 0.167 mmol/L in women, respectively; the corresponding increases for 2-hour post-load glucose levels were 0.121 and 0.217 mmol/L in men, and 0.241 and 0.362 mmol/L in women. When simultaneously included in the same model, these associations with waist circumference were stronger than with BMI.
Conclusion
Obesity measures are associated with abnormal glucose metabolism and diabetes, with central obesity playing a more prominent role than general obesity in Chinese population with BMI < 25 kg/m2. Chinese diabetes prevention and treatment programs should incorporate targeting of normal weight adults with central obesity.
Keywords: glucose metabolism, type 2 diabetes, BMI, waist circumference, China
Introduction
Overweight and obesity contribute to abnormal glucose metabolism[1–3], which is mediated by its close association with increased insulin resistance[4, 5], and are a major determinant of type 2 diabetes[6–8]. Consequently, the rising obesity epidemic has contributed to the significantly increased prevalence of type 2 diabetes over the last three decades[9, 10].
Both central obesity, as measured by waist circumference, and general obesity, as measured by BMI, are strongly associated with risk of type 2 diabetes and impaired glucose metabolism[6, 11]. However, the relative contribution of general versus central obesity measures may vary in different populations[12–15]. Further, limited information is available about whether such relationships remain in people without excess body weight (BMI < 25 kg/m2)[2, 16]. Such information is important for prevention and intervention, because a significant proportion of the general population do not have excess body weight, more so in populations of developing countries, for example Chinese population[17].
Type 2 diabetes has become a major public health challenge in China with 9.7% of the adult population (20 years age or older) being diabetic and 15.5% prediabetic[18]. Increased BMI and waist circumference are major contributors to type 2 diabetes[17, 18]. However, limited information is available regarding to what extent such relationships persist in Chinese population without excess body weight. In the current study, we examined the associations of BMI and waist circumference with fasting glucose, 2-hour glucose, area under the curve (AUC) glucose during a glucose tolerance test, and (pre)diabetes by gender in a large, nationally representative sample of the Chinese population without excess body weight.
Research Design and Methods
Study Participants
The study participants have been previously described in detail[18]. In short, a nationally representative sample of persons 20 years of age or older in the general population was selected by a multistage, stratified sampling method. In total, 152 urban street districts and 112 rural villages were selected from 14 provinces. A total of 47,325 participants (87.3% of those invited to participate) completed the study. Of these, 1,086 participants (including 622 with BMI<25 kg/m2) were excluded due to missing data on demographic information or glucose levels during fasting or a 2 hour glucose tolerance test. Of the remaining 46,239 adults, 10,098 men and 17,454 women who had a BMI below 25 kg/m2 and had not been previously diagnosed with type 2 diabetes were included in the final analysis. Characteristics of the study participants by sex are shown in Table 1.
Table 1.
Characteristics of Study Participants by Sex, China, 2007–2008
| Variable | Men (n=10,098) | Women (n=17,454) | p for sex difference |
|---|---|---|---|
| Age (years) | 45.1 (45.0, 45.2) | 45.0 (44.9, 45.1) | 0.08 |
| BMI (kg/m2) | 21.8 (21.7, 21.9) | 21.6 (21.5, 21.7) | <0.001 |
| Waist (cm) | 78.1 (77.9, 78.4) | 74.4 (74.1, 74.6) | <0.0001 |
| Fasting Glucose (mmol/L) | 5.0 (5.0, 5.0) | 5.0 (4.9, 5.0) | 0.13 |
| 2 hour Glucose (mmol/L) | 6.2 (6.1, 6.3) | 6.3 (6.2, 6.4) | 0.12 |
| AUC Glucose (mmol/L) | 14.5 (14.4, 14.6) | 14.1 (14.0, 14.2) | <0.0001 |
| Glucose category (%) | 0.004 | ||
| Normal | 81.2 (79.8, 82.4) | 82.9 (81.6, 84.1) | |
| Isolated impaired fasting glucose | 2.9 (2.4, 3.5) | 2.1 (1.8, 2.4) | |
| Isolated impaired 2 hour glucose | 10.1 (9.0, 11.2) | 10.1 (8.9, 11.3) | |
| Combined impaired glucose | 1.0 (0.8, 1.3) | 1.2 (0.9, 1.6) | |
| Previously undiagnosed diabetes | 4.9 (4.3, 5.7) | 3.8 (3.2, 4.4) | |
| College or higher level of education (%) | 20.9 (19.7, 22.2) | 18.3 (17.4, 19.2) | 0.001 |
| Regular leisure-time physical activity (%) | 32.3 (30.7, 33.9) | 32.1 (30.7, 33.6) | 0.89 |
| Cigarette smoking (%) | 53.5 (51.8, 55.2) | 3.5 (3.0, 4.1) | <0.0001 |
| Alcohol drinking (%) | 40.4 (38.7, 42.0) | 3.7 (3.2, 4.2) | <0.0001 |
| Family history of type 2 diabetes (%) | 8.2 (7.3, 9.2) | 10.3 (9.3, 11.3) | 0.001 |
Mean (95% CI) or percentage (95% CI) is shown.
AUC: area under the curve
Isolated impaired fasting glucose was defined as fasting glucose level ≥6.1 mmol/L (110 mg/dL) and <7.0 mmol/L (126 mg/dL), and 2-hour glucose level in the glucose-tolerance test <7.8 mmol/L (140 mg/dL); isolated impaired glucose tolerance as fasting glucose level <6.1 mmol/L and 2-hour glucose level ≥7.8 mmol/L and <11.1 mmol/L (200 mg/dL); combined impaired fasting glucose and impaired glucose tolerance as fasting glucose level ≥6.1 mmol/L and <7.0 mmol/L and 2-hour glucose level ≥7.8 mmol/L and <11.1 mmol/L; and previously undiagnosed diabetes as fasting glucose level ≥7.0 mmol/L, 2-hour glucose level ≥11.1 mmol/L, or both.
The institutional review board or ethics committee at each participating institution approved the study protocol. Written informed consent was obtained from each participant before data collection.
Data Collection
The China National Diabetes and Metabolic Disorders Study was conducted from June 2007 through May 2008. Data collection details have been previously described[18]. Information on demographic characteristics, personal and family medical history, and lifestyle risk factors was obtained by using a standard questionnaire in an interview with trained staff[19]. Cigarette smoking was defined as having smoked at least 100 cigarettes in one’s lifetime; alcohol drinking as the consumption of at least 30 g of alcohol per week for 1 year or more; and regular leisure-time physical activity as participation in moderate or vigorous activity for 30 minutes or more per day at least 3 days a week. Body weight, height, and waist circumference were measured by standard methods, as described previously[20]. In particular, waist circumference was measured at the middle point between the rib cage and iliac crests[20].
All study investigators and staff members successfully completed a training program which specified the aims of the study and the specific tools and methods to be used. Detailed instructions were given at training sessions to interviewers who administered the study questionnaire. Clinical staff members were trained to obtain anthropometric measurements and blood specimens according to a standard protocol[19].
Before the oral glucose tolerance test, participants were instructed to maintain their usual physical activity and diet for at least 3 days. After at least 10 hours of overnight fasting, a venous blood specimen was collected in a vacuum tube containing sodium fluoride for plasma glucose measurement. Participants were given a standard 75-g glucose solution. Blood samples were drawn at 0, 30, and 120 minutes after the glucose load to measure glucose concentrations. Plasma glucose was measured by using a hexokinase enzymatic method. All the study laboratories successfully completed a standardization and certification program.
Impaired fasting glucose was defined as fasting glucose level ≥ 6.1 mmol/L (110 mg/dL), impaired glucose tolerance as 2-hour glucose level ≥7.8 mmol/L (140 mg/dL), and undiagnosed diabetes as fasting glucose level ≥7.0 mmol/L (126 mg/dL), 2-hour glucose level ≥11.1 mmol/L (200 mg/dL), or both[21].
Statistical Analysis
Fasting glucose, 2-hour glucose levels, and AUC glucose were treated as continuous variables, and impaired fasting glucose, impaired glucose tolerance, and previously undiagnosed type 2 diabetes were treated as dichotomous variables in the current study. AUC glucose was calculated using the trapezoidal method[22, 23] as [(glucose at 0 minute + glucose at 30 minutes)×0.5 + (glucose at 30 minutes + glucose at 120 minutes)×1.5]/2.0. General linear models were used to examine the associations of BMI and waist circumference with continuous variables by sex, adjusted for age, leisure-time physical activity, alcohol drinking, college education, cigarette smoking, and family history of type 2 diabetes. Least square means adjusted for the same covariates as above were calculated by decile of BMI or waist circumference in each sex group. Logistic regression models were used to examine trends in the prevalence of impaired fasting glucose, impaired glucose tolerance, or previously undiagnosed type 2 diabetes across BMI or waist circumference deciles, adjusted for the same covariates as above.
In order to compare the strength of associations of BMI versus waist circumference with the outcome variables we calculated regression coefficients (for continuous variables) and odds ratios (for dichotomous variables) associated with a one standard deviation increase in BMI (2.1 kg/m2) and waist circumference (8.3 cm); associations with one unit increase in BMI (kg/m2) and waist circumference (cm) were also presented as supplementary data. We also performed sensitivity analyses in samples with BMI < 23 kg/m2 to reflect the fact that the ideal cutoff point to define overweight in Chinese population may be lower, though there is no consensus in this regard[24–26].
All data, including percentages and mean values, were weighted to represent the total population of Chinese adults (20 years of age or older) based on Chinese population data from 2006[18]. All P values are two-tailed and have not been adjusted for multiple testing. All statistical analyses were conducted with the use of SUDAAN 10.0 (Research Triangle Institute).
Results
Among those with BMI < 25 kg/m2, 7.5% of man and 25.2% of women had abdominal obesity (waist circumference ≥ 90 cm for men and ≥ 80 cm for women). In total, 18.8% of men and 17.1% of women without excess body weight had abnormal glucose metabolism (impaired fasting glucose, impaired glucose tolerance, or previously unknown type 2 diabetes), including 4.9% of men and 3.8% of women with undiagnosed type 2 diabetes (Table 1).
Both BMI and waist circumference were significantly and linearly associated with levels of fasting glucose, 2-hour glucose, and AUC glucose in men and women (P<0.01 in all cases). Similarly, both BMI and waist circumference were associated with the prevalence of impaired fasting glucose, impaired glucose tolerance, and previously undiagnosed type 2 diabetes (P<0.001). In Figure 1, levels of fasting glucose, 2-hour glucose, AUC glucose increased linearly as BMI or waist circumference increased from the bottom decile to the top decile. The prevalence of impaired fasting glucose, impaired glucose tolerance, and previously undiagnosed type 2 diabetes also increased in a similar fashion (Figure 2), except that the prevalence of type 2 diabetes seemed to be lowest in the second and the third deciles of BMI and waist circumference. Of note, the associations of outcomes with BMI and waist circumference were somewhat stronger in women than in men; however the sex differences were not statistically significant after multiple comparison adjustment.
Figure 1.
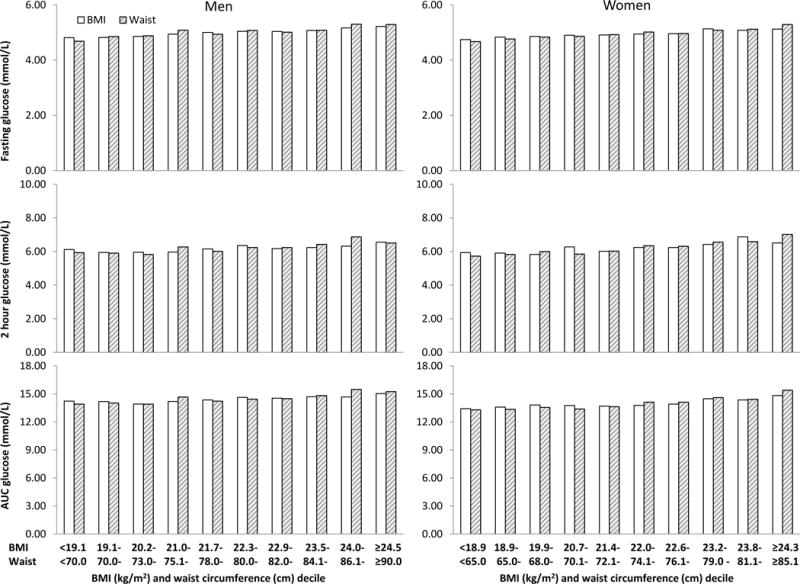
Least square mean levels of fasting glucose, 2 hour glucose, and area under the curve (AUC) glucose adjusted for age, education, leisure-time physical activity, alcohol drinking, family history of type 2 diabetes by BMI or waist circumference decile and sex. P for trend <0.01 in all cases.
Figure 2.
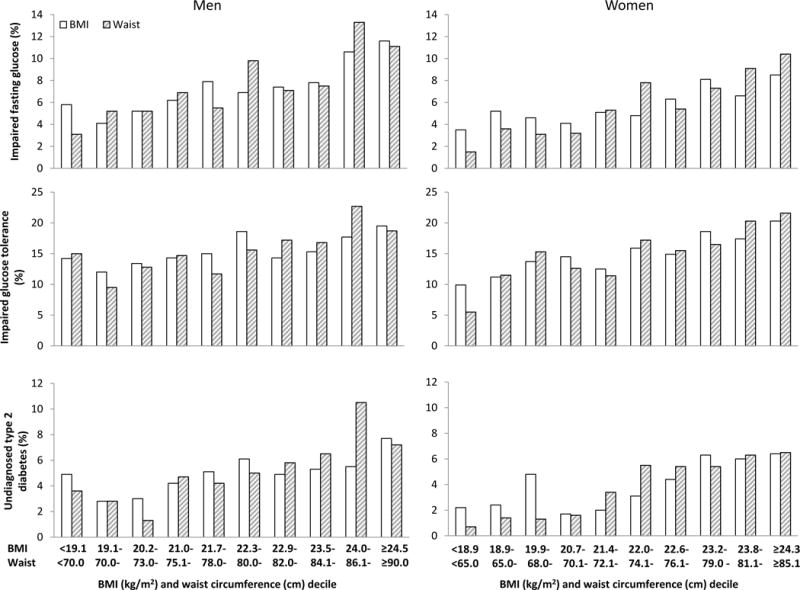
Prevalence of impaired fasting glucose, impaired glucose tolerance, and previously undiagnosed type 2 diabetes by BMI or waist circumference decile and sex. P for trend <0.001 in all cases.
When both BMI and waist circumference were rescaled by their respective standard deviations (2.1 kg/m2 for BMI and 8.3 cm for waist circumference), the strength of associations with outcome variables was overall stronger for waist circumference than for BMI (Tables 2 and 3). When simultaneously included in the same model, the associations for both BMI and waist circumference were attenuated substantially with waist circumference consistently and significantly (P<0.05) associated with all outcome variables (Tables 2 and 3); for BMI, only associations with fasting glucose levels in both men and women and with 2-hour glucose and impaired glucose tolerance in women remained significant (P≤0.01) (Tables 2 and 3). Results for one unit increase in BMI and waist circumference are presented in Supplementary Tables 1 and 2. In logistic regression models, increases in c-statistics, a measure of overall model performance, ranged from 0.002 to 0.012 (p<0.01 in all cases) when waist circumference was added to the models that included BMI and other covariates. When analyses were restricted to those with BMI < 23 kg/m2, associations of all outcomes with BMI and waist circumference were overall weaker than among those with BMI < 25 kg/m2; however, associations with waist circumference remained largely statistically significant (Supplementary Tables 3 and 4).
Table 2.
Regression Coefficients of Fasting and 2-Hour Postload Glucose Levels Associated with One Standard Deviation Increase in BMI and Waist Circumference in Chinese Adults with BMI < 25 kg/m2 by Sex, 2007–2008
| Dependent variable | Regression coefficient
|
|||||||
|---|---|---|---|---|---|---|---|---|
| Model 1
|
Model 2
|
|||||||
| BMI (2.1 kg/m2)
|
Waist (8.3 cm)
|
BMI (2.1 kg/m2)
|
Waist (8.3 cm)
|
|||||
| Estimate (95% CI) | P | Estimate (95% CI) | P | Estimate (95% CI) | P | Estimate (95% CI) | P | |
| Fasting glucose (mmol/L) | ||||||||
| Men | 0.128 (0.097, 0.159) | <0.0001 | 0.170 (0.139, 0.202) | <0.0001 | 0.047 (0.005, 0.089) | 0.03 | 0.139 (0.095, 0.182) | <0.0001 |
| Women | 0.112 (0.091, 0.132) | <0.0001 | 0.167 (0.139, 0.196) | <0.0001 | 0.043 (0.019, 0.068) | 0.0005 | 0.138 (0.105, 0.171) | <0.0001 |
| 2 hour glucose (mmol/L) | ||||||||
| Men | 0.121 (0.041, 0.200) | 0.003 | 0.217 (0.132, 0.301) | <0.0001 | −0.009 (−0.116, 0.098) | 0.87 | 0.222 (0.109, 0.336) | <0.0001 |
| Women | 0.241 (0.182, 0.301) | <0.0001 | 0.362 (0.296, 0.428) | <0.0001 | 0.093 (0.022, 0.164) | 0.01 | 0.299 (0.222, 0.377) | <0.0001 |
| AUC glucose (mmol/L) | ||||||||
| Men | 0.233 (0.115, 0.351) | 0.0001 | 0.408 (0.286, 0.531) | <0.0001 | −0.008 (−0.166, 0.150) | 0.92 | 0.414 (0.250, 0.577) | <0.0001 |
| Women | 0.351 (0.262, 0.441) | <0.0001 | 0.581 (0.484, 0.678) | <0.0001 | 0.095 (−0.014, 0.205) | 0.09 | 0.517 (0.399, 0.634) | <0.0001 |
AUC: area under the curve
Model 1 included age, education, leisure-time physical activity, alcohol drinking, family history of type 2 diabetes, and either BMI or waist circumference, but not both; Model 2 included both BMI and waist circumference and other covariates in model 1.
Table 3.
Odds Ratios of Impaired Fasting Glucose, Impaired Glucose Tolerance, and Previously Undiagnosed Type 2 Diabetes Associated with One Standard Deviation Increase in BMI and Waist Circumference in Chinese Adults with BMI < 25 kg/m2 by Sex, 2007–2008.
| Dependent variable | Odds ratio
|
|||||||
|---|---|---|---|---|---|---|---|---|
| Model 1
|
Model 2
|
|||||||
| BMI (2.1 kg/m2)
|
Waist (8.3 cm)
|
BMI (2.1 kg/m2)
|
Waist (8.3 cm)
|
|||||
| Estimate (95% CI) | P | Estimate (95% CI) | P | Estimate (95% CI) | P | Estimate (95% CI) | P | |
| Impaired fasting glucose | ||||||||
| Men | 1.371 (1.182, 1.590) | <0.0001 | 1.486 (1.318, 1.675) | <0.0001 | 1.131 (0.950, 1.345) | 0.17 | 1.399 (1.216, 1.609) | <0.0001 |
| Women | 1.352 (1.193, 1.533) | <0.0001 | 1.517 (1.332, 1.728) | <0.0001 | 1.129 (0.982, 1.299) | 0.09 | 1.422 (1.233, 1.641) | <0.0001 |
| Impaired glucose tolerance | ||||||||
| Men | 1.140 (1.009, 1.287) | 0.04 | 1.191 (1.057, 1.342) | 0.004 | 1.045 (0.923, 1.183) | 0.49 | 1.161 (1.027, 1.313) | 0.02 |
| Women | 1.275 (1.150, 1.413) | <0.0001 | 1.328 (1.139, 1.547) | 0.0003 | 1.147 (1.035, 1.271) | 0.009 | 1.224 (1.034, 1.448) | 0.02 |
| Diabetes | ||||||||
| Men | 1.208 (1.011, 1.443) | 0.04 | 1.361 (1.178, 1.572) | <0.0001 | 1.017 (0.839, 1.234) | 0.86 | 1.351 (1.156, 1.578) | 0.0002 |
| Women | 1.405 (1.126, 1.753) | 0.003 | 1.554 (1.331, 1.815) | <0.0001 | 1.146 (0.900, 1.460) | 0.27 | 1.455 (1.234, 1.714) | <0.0001 |
Model 1 included age, education, leisure-time physical activity, alcohol drinking, family history of type 2 diabetes, and either BMI or waist circumference; Model 2 included both BMI and waist circumference and other covariates in model 1.
Excluding those with BMI < 18.5 kg/m2 (n=1,964) did not materially change the results presented above.
Discussion
Compared to previous reports[17, 18], we examined in those who did not have excess body weight associations of BMI and waist circumference with fasting glucose, 2-hour glucose, AUC glucose, and (pre)diabetes by gender. We demonstrated that 18.8% of men and 17.1% of women aged 20 years or older with BMI < 25 kg/m2 had impaired glucose metabolism, with 4.9% of men and 3.8% of women having undiagnosed diabetes. Both BMI and waist circumference were positively associated with glucose metabolism and risk of (pre)diabetes. These findings suggest that efforts to prevent and treat diabetes in the Chinese general population should include targeting of adults with a normal body weight. Waist circumference had a stronger association with glucose impairment and diabetes compared to BMI, and waist circumference remained significant for all the glucose impairment outcomes and diabetes when conditioned on BMI. These results underscore the importance of central obesity in the development of abnormal glucose metabolism and type 2 diabetes for adults in the Chinese general population.
Our findings are consistent with a previous report from cross-sectional analysis of a 4071 rural Chinese women with BMI < 23kg/m2[16]. The presence of these associations in people with normal weight strongly suggests that the associations of obesity measures with glucose metabolism and risk of type 2 diabetes are continuous across the full spectrum of body weight[6, 11, 27]. There may not be a cut-point beyond which risk of type 2 diabetes abruptly increases within the normal body weight range. It is known that body fatness varies substantially in people with similar levels of BMI[28]. Our findings are consistent with previously reported associations between body fat and (pre)diabetes in a cross-sectional analysis of 4828 Spanish adults attending a university clinic[2]. Given that a majority of the general population in China is not overweight or obese and that our findings suggest more than 17% of them are (pre)diabetic and 4–5% have undiagnosed diabetes, diabetes prevention and treatment intervention programs to control body weight should include targeting of adults with BMI < 25 kg/m2.
The associations of central obesity with glucose metabolism and type 2 diabetes seemed to be stronger than for general obesity in people without excess body weight. Previous studies in the Chinese population[29–31] and other populations[13, 32, 33], which included participants with a full range of BMI, have shown similar findings. BMI, a measure of general obesity, does not differentiate fat mass from fat-free mass and cannot inform fat distribution, while waist circumference, a measure of central obesity, is more closely correlated to visceral fat. Visceral fat is associated with increased circulating inflammatory cytokines and adhesion molecules[4, 5, 34–37], which promotes the development of insulin resistance and type 2 diabetes[4, 5, 34, 38]. The fact that waist circumference was associated with glucose metabolism and type 2 diabetes even when conditioned on BMI strongly indicates that central obesity is more closely associated with risk of (pre)diabetes and suggests that waist circumference should be included in assessing risk of type 2 diabetes in clinical practice, even in patients with BMI less than 25 kg/m2.
A unique feature of our study is that we were able to show the positive associations of BMI and waist circumference with 2-hour post-load glucose levels in a large (n=27,452), nationally representative sample of the Chinese population without excess body weight. It is known that among prediabetic Chinese individuals, more than two-thirds (68% in men and 74% in women) have normal fasting glucose[18]. These numbers were even higher in the current study: 72% of prediabetic men and 75% of prediabetic women with BMI below 25 kg/m2 had normal fasting glucose. Given the high risk of developing type 2 diabetes in individuals with impaired glucose tolerance[39], an oral glucose test may be necessary in people with normal fasting glucose if other risk characteristics, such as older age, positive family history of type 2 diabetes, and cigarette smoking, are present[40].
Despite its strengths, our study was based on a cross-sectional rather than a prospective analysis. However, we excluded participants with known type 2 diabetes to reduce the potential for bias caused by lifestyle changes or use of diabetes medications. Another limitation was that we lacked the data to adjust for other dietary factors.
In conclusion, our results suggest that obesity measures, particularly waist circumference, are significantly associated with glucose metabolism and risk of (pre)diabetes even in Chinese adults classified as having normal body weight. This association underscores the importance of adiposity in the development of impaired glucose metabolism and type 2 diabetes. Our findings also suggest that diabetes treatment and prevention programs in the Chinese general population should incorporate targeting of normal weight adults with central obesity.
Supplementary Material
Acknowledgments
The study was supported by grants from the Chinese Medical Association Foundation and Chinese Diabetes Society. The authors thank Ms Chung-Shiuan Chen (Department of Epidemiology, Tulane School of Public Health and Tropical Medicine, New Orleans, LA) for her excellent support in data analysis.
Appendix China National Diabetes and Metabolic Disorders Study Group
Statistics analysis team
Guangliang Shan, Peking Union Medical College, Beijing, China
Wenying Yang, Jianzhong Xiao, and Zhaojun Yang, China-Japan Friendship Hospital, Beijing, China
Jiang He, Chung-Shiuan Chen, Shengxu Li, Tulane University School of Public Health and Tropical Medicine, New Orleans, LA, USA
Consulting members
Kunsan Xiang, Jialun Chen, Changyu Pan, Zuzhi Fu
Field centers (all field centers contributed to this work equally)
China-Japan Friendship Hospital, Beijing, China: Wenying Yang (principal investigator), Jianzhong Xiao, Zhaojun Yang, Danjie Ruan (Huairou 1st Hospital), Yufeng Li (Pinggu Hospital), Shi Bu, Hongliang Li, Peng Wang, Xueli Liu, and Zhiyun Xiao.
Chinese PLA General Hospital, Beijing, China: Juming Lu (principal investigator), Jingtao Dou, Nan Jin, Jing Li, Shuyu Wang, Baojing Zhang, and Liguang Dong.
Third Hospital, Sun Yat-sen University, Guangzhou, China: Jianping Weng (principal investigator), Longyi Zeng, Panwei Mu, Yanhua Zhang, Qiuqiong Yu, Keyi Lin, Yan Sun, and Xiaodong Xu.
Shanghai Jiaotong University Affiliated Sixth People’s Hospital, Shanghai, China: Weiping Jia (principal investigator), Xuhong Hou, Xiaojing Ma, Huijuan Lu, Dajing Zou (Changhai Hospital), Renming Hu (Huashan Hospital), Huilin Gu (Huayang Communities), Youhua Yao (Linfen Communities), Weizhen Shen (Pengpu Communities), Junbin Huang (Tianmu Communities), and Zhijian Pan (Anting Communities)
Peking University Peoples’ Hospital, Beijing, China: Linong Ji (principal investigator), Xianghai Zhou, Xueyao Han, Xiuying Zhang, Yingying Luo, Xiuqing Sun, Dong Zhao (Luhe Hospital), Huifang Xing (Mentougou Hospital), Lei Liu (Haidianqu), and Xinquan Zhang (Jingyuan Hospital)
The First Affiliated Hospital, Chinese Medical University, Liaoning, China: Zhongyan Shan (principal investigator), Yaxin Lai, Xiaochun Teng, Ling Shan, Jiani Wang, Liangfeng Shi, Sen Wang, Li Lu, Fengwei Jiang, and Beibei Wang.
Shanxi Province People’s Hospital, Shanxi, China: Jie Liu (principal investigator), Ling Hu, and Yuying Hou (Shan Xi Medical University).
West China Hospital, Sichuan University, Sichuan, China: Haoming Tian (principal investigator), Xingwu Ran, Yan Ren, and Hongling Yu; the First People’s Hospital of Liangshan Yi Nationality Autonomy District, Xichan City (Lisheng Cao, Hualin Lu, Xiaohua Xie); Yulin Community Health Center of Wuhou District, Chengdu (Xilian Gao); and the First Hospital of Longquyi District, Chengdu (Zhong Li).
Xijing Hospital, Fourth Military Medical University, Shaanxi, China: Qiuhe Ji (principal investigator), Fei Chen, and Yaping Zhang.
The Affiliated Drum Tower Hospital of Nanjing University Medical School, Jiangsu, China: Dalong Zhu (principal investigator), Yun Hu, Guoyu Tong, Ning Xu, Jinluo Cheng, Junjian Chen, Fei Wang, and Jiong Pei.
Xinjiang Uygur Autonomous Region’s Hospital, Xingjiang, China: Jiapu Ge (principal investigator), Wan Yi, Rong Wang (Bayi Steel’s Hospital), Gang Han, Huijie Mu (Habahe County Hospital), and Maimaiti Aireti (Moyu County Hospital).
Fujian Provincial Hospital, Fujian, China: Lixiang Lin (principal investigator), Gang Chen, Jingxin Zhao, Shuyu Yang, and Mingzhu Lin (Xiamen 1st Hospital), Yadong Zhang, Fengyuan Zhu (Sanming 1st Hosptial), Mei Tu (Longyan 1st Hospital), Shanghua Xu (Nanping 1st Hospital), and Weihong Lin (Jiangle County Hospital).
Qilu Hospital of Shandong University, Shandong, China: Li Chen (principal investigator), Yu Sun, Xiaolin Dong (Jinan Central Hospital), Yiling Fu, Kehua Zhou, Jinbo Liu, Zhenzuo Li, Yuxin Xu, Peng Lin, and Wenjuan Li.
Peking University First Hospital, Beijing, China: Xiaohui Guo (principal investigator), Junqing Zhang, Aimei Dong, Dongming Huang and Changchun Xue (Daxinqu Hospital) and Junqing Liu (Shichahai Community).
Henan Province People’s Hospital, Henan, China: Zhigang Zhao (principal investigator), Guijun Qin, Yong Yan, Peiyu Yao, and Qinchu Li.
Haerbin Medical University Second Hospital, Heilongjiang, China: Qiang Li (principal investigator), Kaiting Chen, Nannan Wu, Yan Feng, Xiaoying Liu, and Guozhong Li.
Xiangya Second Hospital, Hunan, China: Zhiguang Zhou (principal investigator), Weili Tang, Qiong Feng, Yuju Qin, Xinwen Qiu, Diaoxiang Xiao, Aiping Qin, Bin Liao, Zifang Gao, and Liang Xiang.
Footnotes
S.L., J.H., and W.Y. drafted, reviewed, and edited the manuscript, W.Y., J.X, L.J., J.W., W.J., J.Lu, Z.Zhou, X.G., J.Liu, Z.S., D.Z., L.C., Z.Zhao, H.T., Q.J., J.G., Q.L., L.L., Z.Y., J.H. contributed to the study design, data collection, discussion, and wrote, reviewed, and edited the manuscript. All authors were involved in planning the manuscript, its critical review and editing, subsequent revisions, and approval for submission. W.Y. is the guarantor of this work and, as such, had full access to all the data in the study and takes responsibility for the integrity of the data and the accuracy of the data analysis.
Parts of this study were presented at the 30th Annual Scientific Meeting of the Obesity Society, San Antonio, Texas, September 20–24, 2012.
Conflict of interest: none declared.
References
- 1.Saaristo TE, Barengo NC, Korpi-Hyovalti E, et al. High prevalence of obesity, central obesity and abnormal glucose tolerance in the middle-aged Finnish population. BMC Public Health. 2008;8:423. doi: 10.1186/1471-2458-8-423. [DOI] [PMC free article] [PubMed] [Google Scholar]
- 2.Gomez-Ambrosi J, Silva C, Galofre JC, et al. Body adiposity and type 2 diabetes: increased risk with a high body fat percentage even having a normal BMI. Obesity (Silver Spring) 2011;19:1439–1444. doi: 10.1038/oby.2011.36. [DOI] [PubMed] [Google Scholar]
- 3.Bombelli M, Facchetti R, Sega R, et al. Impact of body mass index and waist circumference on the long-term risk of diabetes mellitus, hypertension, and cardiac organ damage. Hypertension. 2011;58:1029–1035. doi: 10.1161/HYPERTENSIONAHA.111.175125. [DOI] [PubMed] [Google Scholar]
- 4.Kahn SE, Hull RL, Utzschneider KM. Mechanisms linking obesity to insulin resistance and type 2 diabetes. Nature. 2006;444:840–846. doi: 10.1038/nature05482. [DOI] [PubMed] [Google Scholar]
- 5.Despres JP, Lemieux I. Abdominal obesity and metabolic syndrome. Nature. 2006;444:881–887. doi: 10.1038/nature05488. [DOI] [PubMed] [Google Scholar]
- 6.Vazquez G, Duval S, Jacobs DR, Jr, Silventoinen K. Comparison of body mass index, waist circumference, and waist/hip ratio in predicting incident diabetes: a meta-analysis. Epidemiol Rev. 2007;29:115–128. doi: 10.1093/epirev/mxm008. [DOI] [PubMed] [Google Scholar]
- 7.Colditz GA, Willett WC, Stampfer MJ, et al. Weight as a risk factor for clinical diabetes in women. Am J Epidemiol. 1990;132:501–513. doi: 10.1093/oxfordjournals.aje.a115686. [DOI] [PubMed] [Google Scholar]
- 8.Field AE, Coakley EH, Must A, et al. Impact of overweight on the risk of developing common chronic diseases during a 10-year period. Arch Intern Med. 2001;161:1581–1586. doi: 10.1001/archinte.161.13.1581. [DOI] [PubMed] [Google Scholar]
- 9.Yoon KH, Lee JH, Kim JW, et al. Epidemic obesity and type 2 diabetes in Asia. Lancet. 2006;368:1681–1688. doi: 10.1016/S0140-6736(06)69703-1. [DOI] [PubMed] [Google Scholar]
- 10.Gregg EW, Cadwell BL, Cheng YJ, et al. Trends in the prevalence and ratio of diagnosed to undiagnosed diabetes according to obesity levels in the U.S. Diabetes Care. 2004;27:2806–2812. doi: 10.2337/diacare.27.12.2806. [DOI] [PubMed] [Google Scholar]
- 11.Wang Y, Rimm EB, Stampfer MJ, Willett WC, Hu FB. Comparison of abdominal adiposity and overall obesity in predicting risk of type 2 diabetes among men. Am J Clin Nutr. 2005;81:555–563. doi: 10.1093/ajcn/81.3.555. [DOI] [PubMed] [Google Scholar]
- 12.Diaz VA, Mainous AG, 3rd, Baker R, Carnemolla M, Majeed A. How does ethnicity affect the association between obesity and diabetes? Diabet Med. 2007;24:1199–1204. doi: 10.1111/j.1464-5491.2007.02244.x. [DOI] [PubMed] [Google Scholar]
- 13.Barcelo A, Gregg EW, Pastor-Valero M, Robles SC. Waist circumference, BMI and the prevalence of self-reported diabetes among the elderly of the United States and six cities of Latin America and the Caribbean. Diabetes Res Clin Pract. 2007;78:418–427. doi: 10.1016/j.diabres.2007.06.008. [DOI] [PubMed] [Google Scholar]
- 14.Nyamdorj R, Pitkaniemi J, Tuomilehto J, et al. Ethnic comparison of the association of undiagnosed diabetes with obesity. Int J Obes (Lond) 2010;34:332–339. doi: 10.1038/ijo.2009.225. [DOI] [PubMed] [Google Scholar]
- 15.Tulloch-Reid MK, Williams DE, Looker HC, Hanson RL, Knowler WC. Do measures of body fat distribution provide information on the risk of type 2 diabetes in addition to measures of general obesity? Comparison of anthropometric predictors of type 2 diabetes in Pima Indians. Diabetes Care. 2003;26:2556–2561. doi: 10.2337/diacare.26.9.2556. [DOI] [PubMed] [Google Scholar]
- 16.Yu Y, Venners SA, Wang B, et al. Association of central adiposity with prediabetes and decreased insulin sensitivity in rural Chinese normal-weight and overweight women. Metabolism. 2010;59:1047–1053. doi: 10.1016/j.metabol.2009.10.029. [DOI] [PMC free article] [PubMed] [Google Scholar]
- 17.Hou X, Lu J, Weng J, et al. Impact of waist circumference and body mass index on risk of cardiometabolic disorder and cardiovascular disease in Chinese adults: a national diabetes and metabolic disorders survey. PLoS One. 2013;8:e57319. doi: 10.1371/journal.pone.0057319. doi:57310.51371/journal.pone.0057319. Epub 0052013 Mar 0057318. [DOI] [PMC free article] [PubMed] [Google Scholar]
- 18.Yang W, Lu J, Weng J, et al. Prevalence of diabetes among men and women in China. N Engl J Med. 2010;362:1090–1101. doi: 10.1056/NEJMoa0908292. [DOI] [PubMed] [Google Scholar]
- 19.Luepker RVEA, McKeigue P, Reddy KS. Cardiovascular survey methods. Geneva: 2004. [Google Scholar]
- 20.Pan XR, Yang WY, Li GW, Liu J. Prevalence of diabetes and its risk factors in China, 1994. National Diabetes Prevention and Control Cooperative Group. Diabetes Care. 1997;20:1664–1669. doi: 10.2337/diacare.20.11.1664. [DOI] [PubMed] [Google Scholar]
- 21.Alberti KG, Zimmet PZ. Definition, diagnosis and classification of diabetes mellitus and its complications. Part 1: diagnosis and classification of diabetes mellitus provisional report of a WHO consultation. Diabet Med. 1998;15:539–553. doi: 10.1002/(SICI)1096-9136(199807)15:7<539::AID-DIA668>3.0.CO;2-S. [DOI] [PubMed] [Google Scholar]
- 22.Purves RD. Optimum numerical integration methods for estimation of area-under-the-curve (AUC) and area-under-the-moment-curve (AUMC) Journal of pharmacokinetics and biopharmaceutics. 1992;20:211–226. doi: 10.1007/BF01062525. [DOI] [PubMed] [Google Scholar]
- 23.Allison DB, Paultre F, Maggio C, Mezzitis N, Pi-Sunyer FX. The use of areas under curves in diabetes research. Diabetes Care. 1995;18:245–250. doi: 10.2337/diacare.18.2.245. [DOI] [PubMed] [Google Scholar]
- 24.Zhou B, Wu Y, Yang J, Li Y, Zhang H, Zhao L. Overweight is an independent risk factor for cardiovascular disease in Chinese populations. Obes Rev. 2002;3:147–156. doi: 10.1046/j.1467-789x.2002.00068.x. [DOI] [PubMed] [Google Scholar]
- 25.Nguyen TT, Adair LS, He K, Popkin BM. Optimal cutoff values for overweight: using body mass index to predict incidence of hypertension in 18- to 65-year-old Chinese adults. J Nutr. 2008;138:1377–1382. doi: 10.1093/jn/138.7.1377. [DOI] [PMC free article] [PubMed] [Google Scholar]
- 26.Wildman RP, Gu D, Reynolds K, Duan X, He J. Appropriate body mass index and waist circumference cutoffs for categorization of overweight and central adiposity among Chinese adults. Am J Clin Nutr. 2004;80:1129–1136. doi: 10.1093/ajcn/80.5.1129. [DOI] [PubMed] [Google Scholar]
- 27.Qiao Q, Nyamdorj R. Is the association of type II diabetes with waist circumference or waist-to-hip ratio stronger than that with body mass index? Eur J Clin Nutr. 2010;64:30–34. doi: 10.1038/ejcn.2009.93. [DOI] [PubMed] [Google Scholar]
- 28.Prentice AM, Jebb SA. Beyond body mass index. Obes Rev. 2001;2:141–147. doi: 10.1046/j.1467-789x.2001.00031.x. [DOI] [PubMed] [Google Scholar]
- 29.Cheng CH, Ho CC, Yang CF, Huang YC, Lai CH, Liaw YP. Waist-to-hip ratio is a better anthropometric index than body mass index for predicting the risk of type 2 diabetes in Taiwanese population. Nutr Res. 2010;30:585–593. doi: 10.1016/j.nutres.2010.08.007. [DOI] [PubMed] [Google Scholar]
- 30.Hu D, Xie J, Fu P, et al. Central rather than overall obesity is related to diabetes in the Chinese population: the InterASIA study. Obesity (Silver Spring) 2007;15:2809–2816. doi: 10.1038/oby.2007.333. [DOI] [PubMed] [Google Scholar]
- 31.He Y, Zhai F, Ma G, et al. Abdominal obesity and the prevalence of diabetes and intermediate hyperglycaemia in Chinese adults. Public Health Nutr. 2009;12:1078–1084. doi: 10.1017/S1368980008003856. [DOI] [PubMed] [Google Scholar]
- 32.Meisinger C, Doring A, Thorand B, Heier M, Lowel H. Body fat distribution and risk of type 2 diabetes in the general population: are there differences between men and women? The MONICA/KORA Augsburg cohort study. Am J Clin Nutr. 2006;84:483–489. doi: 10.1093/ajcn/84.3.483. [DOI] [PubMed] [Google Scholar]
- 33.Lee CM, Huxley RR, Wildman RP, Woodward M. Indices of abdominal obesity are better discriminators of cardiovascular risk factors than BMI: a meta-analysis. J Clin Epidemiol. 2008;61:646–653. doi: 10.1016/j.jclinepi.2007.08.012. [DOI] [PubMed] [Google Scholar]
- 34.Hamdy O, Porramatikul S, Al-Ozairi E. Metabolic obesity: the paradox between visceral and subcutaneous fat. Curr Diabetes Rev. 2006;2:367–373. doi: 10.2174/1573399810602040367. [DOI] [PubMed] [Google Scholar]
- 35.Monroy A, Kamath S, Chavez AO, et al. Impaired regulation of the TNF-alpha converting enzyme/tissue inhibitor of metalloproteinase 3 proteolytic system in skeletal muscle of obese type 2 diabetic patients: a new mechanism of insulin resistance in humans. Diabetologia. 2009;52:2169–2181. doi: 10.1007/s00125-009-1451-3. doi:2110.1007/s00125-00009-01451-00123. Epub 02009 Jul 00125. [DOI] [PMC free article] [PubMed] [Google Scholar]
- 36.Pontiroli AE, Frige F, Paganelli M, Folli F. In morbid obesity, metabolic abnormalities and adhesion molecules correlate with visceral fat, not with subcutaneous fat: effect of weight loss through surgery. Obes Surg. 2009;19:745–750. doi: 10.1007/s11695-008-9626-4. doi:710.1007/s11695-11008-19626-11694. Epub 12008 Jul 11616. [DOI] [PubMed] [Google Scholar]
- 37.Pontiroli AE, Pizzocri P, Paroni R, Folli F. Sympathetic overactivity, endothelial dysfunction, inflammation, and metabolic abnormalities cluster in grade III (World Health Organization) obesity: reversal through sustained weight loss obtained with laparoscopic adjustable gastric banding. Diabetes Care. 2006;29:2735–2738. doi: 10.2337/dc06-1417. [DOI] [PubMed] [Google Scholar]
- 38.Daniele G, Guardado Mendoza R, Winnier D, et al. The inflammatory status score including IL-6, TNF-alpha, osteopontin, fractalkine, MCP-1 and adiponectin underlies whole-body insulin resistance and hyperglycemia in type 2 diabetes mellitus. Acta Diabetol. 2014;51:123–131. doi: 10.1007/s00592-013-0543-1. doi:110.1007/s00592-00013-00543-00591. Epub 02013 Dec 00527. [DOI] [PubMed] [Google Scholar]
- 39.Unwin N, Shaw J, Zimmet P, Alberti KG. Impaired glucose tolerance and impaired fasting glycaemia: the current status on definition and intervention. Diabet Med. 2002;19:708–723. doi: 10.1046/j.1464-5491.2002.00835.x. [DOI] [PubMed] [Google Scholar]
- 40.Buijsse B, Simmons RK, Griffin SJ, Schulze MB. Risk assessment tools for identifying individuals at risk of developing type 2 diabetes. Epidemiol Rev. 2011;33:46–62. doi: 10.1093/epirev/mxq019. [DOI] [PMC free article] [PubMed] [Google Scholar]
Associated Data
This section collects any data citations, data availability statements, or supplementary materials included in this article.