Abstract
Many cell surface proteins are marked for endocytosis by a cytoplasmic sequence motif Tyrosine-XX-(hydrophobic residue) which is recognized by the μ2 subunit of AP2 adaptors. Crystal structures of the internalisation signal binding domain μ2 complexed with the internalisation signals of EGFR and the trans-golgi network protein TGN38 have been determined at 2.7Å resolution. The signal peptides adopted an extended conformation rather than the expected tight turn. Specificity was conferred by hydrophobic pockets which bind the tyrosine and leucine in the peptide. In the crystal the protein forms dimers which could increase the strength and specificity of binding to dimeric receptors.
The localization and movement of compartment-specific proteins within the cell is largely achieved through the recognition of short sequence motifs by targetting proteins. One of the most studied processes involving such signal recognition is clathrin-mediated endocytosis, which occurs in vesicle trafficking and the internalisation of nutrient and growth factor receptors when bound to their appropriate cargo molecules (reviewed in (1)). During the internalisation of activated growth factor receptors such as the epidermal growth factor receptor (EGFR)tyrosine kinase (reviewed in (2)), receptors are removed from the cell surface in clathrin-coated vesicles and ultimately directed to the endosome and lysosome, where they are inactivated by proteolytic degradation (3, 4).
The first stage of endocytosis is the formation of a clathrin coated pit, when mechanical invagination of a patch of membrane by clathrin occurs as it forms a polyhedral lattice, as does the preferential sorting of selected transmembrane proteins into the pits by adaptor complexes (APs). At least three similar AP complexes (AP1, AP2, and AP3) have been identified, and appear to be associated with different cell compartments. The AP’s comprise four types of subunit; two large ~100kDa (α and β2 in AP2), one medium ~50kDa (μ2 in AP2) and one small ~17kDa (σ2 in AP2). AP2 adaptors link the proteins to be endocytosed (via the μ2 subunit) with the nascent clathrin coat (via the α and β2 subunits), and via the α subunit, they recruit the components (such as EPS15, amphiphysin and dynamin) needed to drive and regulate the formation of clathrin-coated vesicles (reviewed in (5) and (6)). The short linear sequence motifs that act as internalisation signals mainly fall into two classes: the first, and most common, contains a critical tyrosine residue, and mostly conform to the consensus sequence YxxØ where Ø is a bulky hydrophobic residue (Leu, Ile, Met or Phe) (7) that binds directly to μ2 subunits (8); the second is the ‘di-leucine’ motif DxxxLL, which interacts with the β1 subunit of AP1 (9) but may also bind indirectly to the μ subunit via an ‘adaptor’ protein (10, 11).
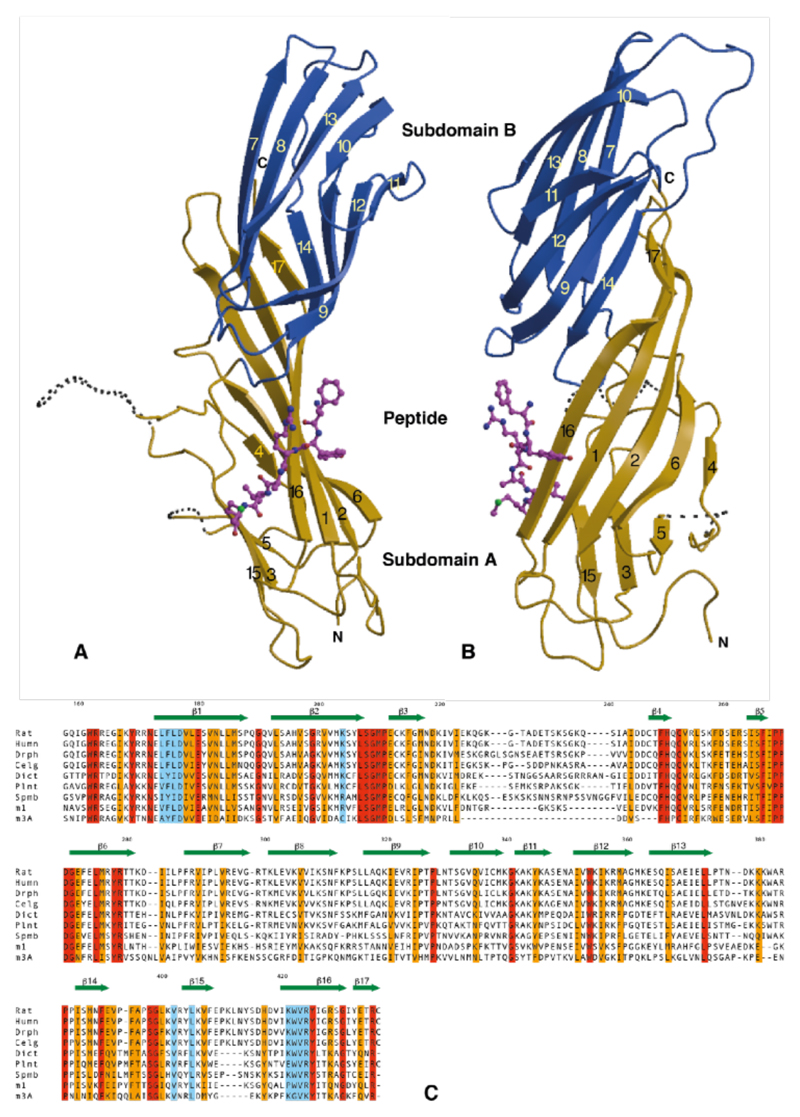
In order to investigate the nature and selectivity of the binding of YxxØ internalisation signals to APs we have solved the crystal structures to 2.7Å resolution of the signal binding domain of μ2 (residues 158-435) (12) complexed with the internalisation signal peptides from EGFR (FYRALM) (13) and TGN38 (DYQRLN) (14, 15). The protein has an elongated banana-shaped all β-sheet structure. It can be considered as two β-sandwich subdomains (A and B), with subdomain B inserted between strands 6 and 15 of subdomain A, and joined edge to edge such that the convex surface is a continuous 9-stranded mixed β-sheet which runs the whole length of the molecule (see Fig.1).
Figure 1. The structure.
A,B Orthogonal views of μ2 with subdomain A shown in gold, subdomain B in blue and the peptide in magenta. Dotted lines represent disordered loops. The strands of the β-sheet (arrows) are numbered. The two subdomains are linked into a continuous β-sheet through strands 14 and 16/17.
C Sequence alignment of μ2 from rat (Rat), human (Humn), Drosophila (Dros), C. elegans (cElg), Dictostylium (Dict), Arabidopsis thaliana (Plnt), S. pombe (Spmb), μ1 (AP47) from rat and μ3A (p47A) from rat. Identical residues are shaded red, conserved gold and those involved in internalisation signal binding in blue.
The two peptides bind in an identical manner to a site on the surface of two parallel β-sheet strands (β1 and β16), in subdomain A (Fig 2). The peptide assumes an extended conformation when bound, not a tight β-turn as has been proposed (16). Hydrophobic pockets exist for the binding of both the tyrosine and the Ø residue either side of edge strand β16. These pockets are positioned such that when the side chains of the target peptide are correctly bound, three additional hydrogen bonds are made between the backbone of the peptide and β-strand 16, forming an extra strand on the inner edge of the 9-stranded β-sheet (represented schematically in Fig.2C). A similar mechanism of increased strength of binding through β-strand formation on correct recognition of key side chains has been demonstrated in a number of cases, including the interactions of protein kinases with their substrates (17) and protein phosphatases with their regulatory subunits (18).
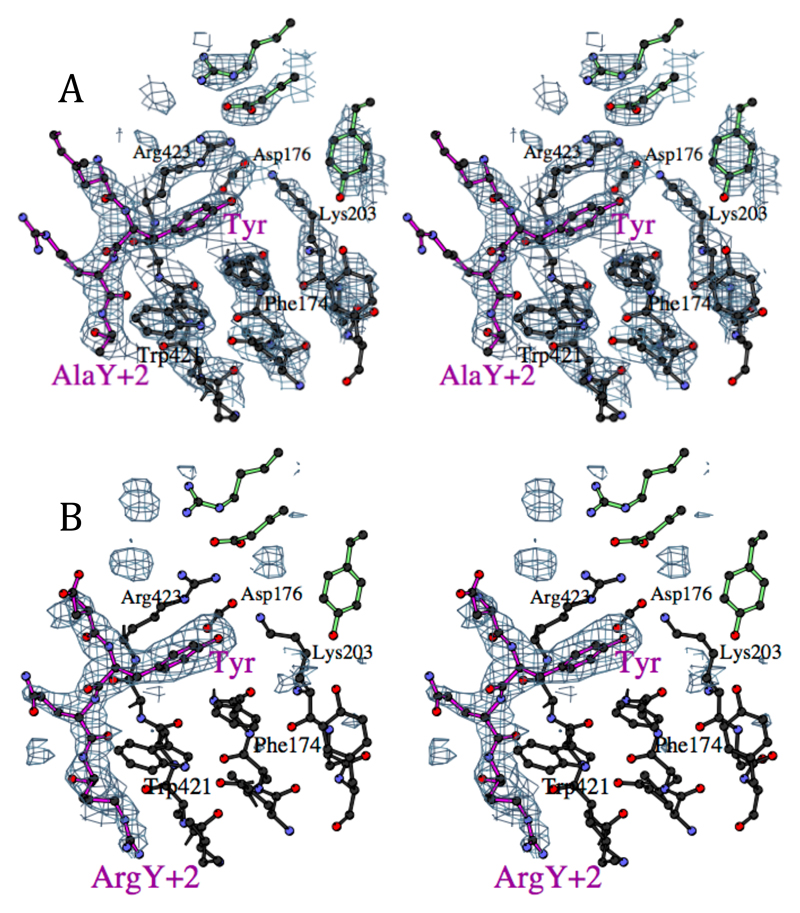
Figure 2.
A Stereo view of the binding site for the tyrosine residue in the EGFR internalisation signal FYRALM, showing part of the experimental electron density map, with phases calculated using the peptide complex data as native with the Xe and EMTS derivatives, and solvent flattening with a 70% solvent content. The peptide is represented with magenta bonds, and the residues at the top right with green bonds come from the other subunit in the crystallographic dimer. (Figures drawn with BOBSCRIPT (32))
B Stereo view of the binding site for the TGN38 internalisation signal DYQRLN, in the same view as D. The difference electron density shown was calculated using the model from the FYRALM peptide structure with the peptide removed: density for the arginine in the Y+2 position is clearly visible, packed against Trp421.
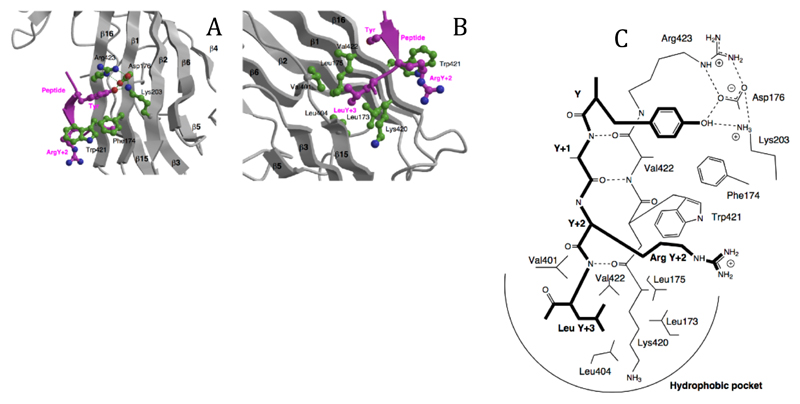
The tyrosine residue of the internalization peptide makes extensive interactions with side chains in its binding pocket. There are hydrophobic interactions between the tyrosine ring and Trp421 and Phe 174 as well as stacking on the guanidinium group of Arg 423. The hydroxyl group of the tyrosine participates in a network of hydrogen bonds with Asp176, Lys203 (from β2) and again Arg 423, explaining why a Phe at this position gives only poor binding (19). As well as contributing directly to the strength of binding via a direct hydrogen-bond to the tyrosine OH, Asp176 appears to play an important role in correctly orientating the guanidinium group of Arg423. The critical role of Asp176 is reflected in its absolute conservation among all μ2, μ1 and μ3 sequences (Fig.1C). The other major determinant as defined by sequence and combinatorial peptide library analysis of internalisation signals is the presence of a bulky hydrophobic residue at the Y+3 position (7). The binding site for this residue is a cavity lined with aliphatic residues (Fig.2B). The size and flexibility of the side chains within this pocket would allow for the accommodation of any of the residues (Leu, Phe, Met, Ile) that are possible at this position.
Peptide library screening has revealed a preference for an arginine residue at either Y+2 (strong) or Y+1 (weak) (7). In the DYQRLN (TGN38) complex, the arginine forms hydrophobic interactions mainly with Trp421 but also with Ile419 (Fig 2), with its guanidinium group exposed to solvent, and a hydrogen bond between Nε and the carbonyl of Lys420: the favourable hydrophobic interaction outweighs the unfavourable electrostatic interaction with the marked positive potential of the peptide binding surface (Fig.3C and 3D). The FYRALM (EGFR) peptide contains an arginine at the Y+1 position which is not well ordered, implying that it has no significant interaction with μ2. The nature and disposition of the pockets explains why the di-leucine type of internalisation motif is unable to bind to μ2 because there would be no residue capable of filling the tyrosine binding pocket. It also indicates that if the low density lipoprotein receptor internalisation signal NPVY does bind weakly to μ2 (7), and not via an adaptor protein, it would have to do so in the reverse orientation that is with its Asn residue in the Y+3 pocket.
Figure 3. The peptide binding site.
A The binding of the tyrosine residue of the internalisation signal peptide is in a hydrophobic pocket created by Phe174, Trp421 and Arg423, with a hydrogen-bonding network between the tyrosine OH and Asp176, Lys203 and Arg423. The structure shown is that of the DYQRLN TGN38 peptide. B The binding pocket for the bulky hydrophobic residue at Y+3 (Leucine in both peptides) is lined with aliphatic sidechains of Leu173, Leu175, Val401, Leu404, Val422 and the aliphatic portion of Lys420. ArgY+2 of the TGN38 peptide is packed against Trp421. C Schematic representation of the interactions between the internalisation signal of TGN38 and μ2, showing both side chain contacts and the short stretch of β-sheet formed between the peptide and β-strand 16. The peptide is shown with bold lines.
Src homology region 2 (SH2) domains bind similar YxxØ motifs in an extended conformation with the tyrosine phosphorylated (20, 21), but there is no homology either in the structure of the proteins or in their mode of binding. In the case of SH2 domains the specificity and strength of binding to the target peptide arise predominantly from ionic interactions with the phosphate moiety. The structure of the complex demonstrates that if the tyrosine residue were to be phosphorylated, it would be incapable of binding to μ2 both because the size of the tyrosine pocket is too small, and because Asp176 would repel the phosphate. This is supported by data which suggests that phosphorylated peptides will not bind to μ2 subunit (19) and that phosphotyrosine cannot displace EGFR that is bound to AP2 (22).
The residues involved in signal recognition are conserved in μ2 subunits from all species (Fig.1C). The binding sites in the μ1 subunit of AP1 (AP47) are also very similar, though the change K420P may alter the specificity for the Y+3 residue. In the AP3 homologue (μ3A or p47A) the residues K203 and R423 in μ2 involved in binding the tyrosine of the Yxxϕ motif are replaced by C and K respectively, which would be expected to reduce the affinity for tyrosine signals to μ3A. The substitutions Leu173→Ala and Leu175 → Phe in the Y+3 pocket (Fig.1C) may alter the selectivity for residues at this position. The exchange of W421 in μ2 for a glycine in μ3A would remove the specificity for an arginine at the Y+2 position.
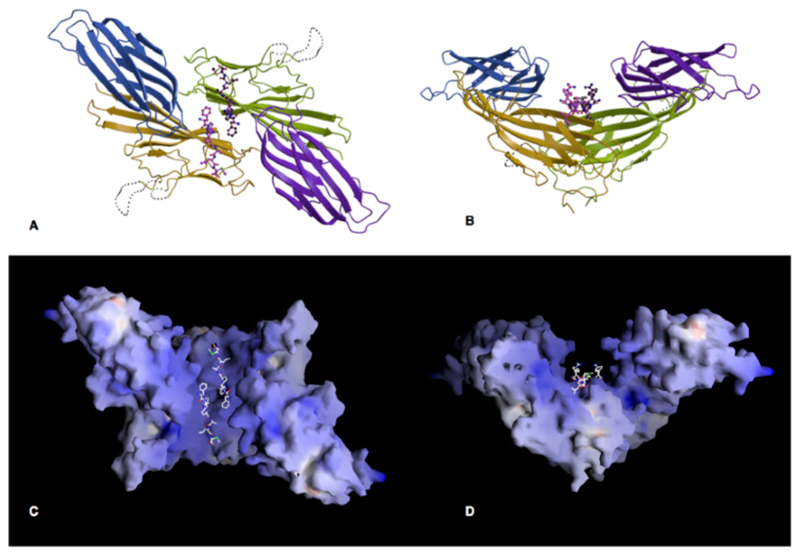
How does the machinery of endocytosis recognize a relatively non-specific signal such as the sequence YxxØ? One possibility arises from the observation that most receptors are internalized as dimers, often induced by ligand binding on the outside of the cell, which could place two internalisation signals adjacent to each other. Recognition of this dimer would increase the avidity of binding relative to the monomer, without necessarily precluding binding of monomeric receptors. In the crystal structure the μ2 molecules form a dimer around a crystallographic twofold axis, placing the internalization signal peptides close to each other in a large groove (Fig.3). The dimer buries 1100Å2 of accessible surface, which is smaller than most stable dimer interfaces (typically at least 1200Å2), but μ2 is only a small part of the whole AP2 molecule, and additional interactions may be formed between other subunits of AP2 in a dimer. This provides an attractive explanation for the recognition of dimeric receptors, particularly as peptide binding would favour dimerization, because the peptide contributes 17% of the interface. Dimerization of AP2 complexes has been suggested by the observation that they bind in a 1:1 molar ratio with ligand-activated, and therefore dimeric, EGF receptors (23). Binding of dimeric receptors to AP2 dimers which in turn bind multimers of clathrin provides an implicit mechanism for the formation of the clathrin lattice. The position of the peptide binding sites in the groove of the dimer predicts that the internalization signal must be presented as an accessible region without defined secondary structure, which is in agreement with the observation that EGFR binding to AP2 is increased by the presence of urea (22).
The striking positive electrostatic potential of the μ2 dimer may reflect an ability to interact with negatively charged moieties including proteins (for example the domain following the internalisation signal in EGFR) or the headgroups of negatively charged phospholipids (for example phosphatidyl serine). The planar face shown at the top of Fig.3D would provide a large non-specific ionic interaction with the membrane which would increase the strength of binding to membrane proteins containing appropriately positioned internalisation signals in a manner similar to proteins such as Src and HIV1 gag (24), and may also contribute in recruiting AP2 complexes to the plasma membrane.
The novel structure of the μ2 subunit of the plasma membrane AP2 complexed with the FYRALM peptide explains the specific binding of YxxØ internalisation motifs, the absolute requirement for the motif to be in an extended β-strand conformation, and for the tyrosine residue to be non-phosphorylated. The dimeric packing of the molecules in the crystal suggests that strength and selectivity of binding of receptors may be enhanced by their binding as dimers to dimeric μ subunits.
Figure 4. The crystallographic dimer.
A, B Orthogonal views of the dimer formed in the crystal, along and perpendicular to the crystallographic twofold axis. The A subdomains are coloured gold and green and the B domains blue and purple.
C and D. The surface of the μ2 dimer coloured according to electrostatic surface potential (blue positive, red negative, scale from -30 to +30 kT e-1)), in the same view as A and B. The planar face at the top of D may interact with the membrane. (Drawn with GRASP(33))
References and Notes
- 1.Kirchausen T, Bonifacino JS, Riezman H. Curr Op Cell Biology. 1997;9:488. doi: 10.1016/s0955-0674(97)80024-5. [DOI] [PubMed] [Google Scholar]
- 2.Schlessinger J, Ullrich A. Neuron. 1992;9:383. doi: 10.1016/0896-6273(92)90177-f. [DOI] [PubMed] [Google Scholar]
- 3.Chen WS, et al. Cell. 1989;59:33. doi: 10.1016/0092-8674(89)90867-2. [DOI] [PubMed] [Google Scholar]
- 4.Wells A, et al. Science. 1990;247:962. doi: 10.1126/science.2305263. [DOI] [PubMed] [Google Scholar]
- 5.Schmid SL. Annu Rev Biochem. 1997;66:511. doi: 10.1146/annurev.biochem.66.1.511. [DOI] [PubMed] [Google Scholar]
- 6.Wigge P, McMahon HT. Trends Neurosci. 1998;21:339. doi: 10.1016/s0166-2236(98)01264-8. [DOI] [PubMed] [Google Scholar]
- 7.Boll W, et al. EMBO J. 1996;15:5789. [PMC free article] [PubMed] [Google Scholar]
- 8.Ohno H, et al. Science. 1995;269:1872. doi: 10.1126/science.7569928. [DOI] [PubMed] [Google Scholar]
- 9.Rapoport I, Chen YC, Cupers P, Shoelson SE, Kirchhausen T. EMBO J. 1998;17:2148. doi: 10.1093/emboj/17.8.2148. [DOI] [PMC free article] [PubMed] [Google Scholar]
- 10.Foti M, et al. J Cell Biol. 1997;139:37. doi: 10.1083/jcb.139.1.37. [DOI] [PMC free article] [PubMed] [Google Scholar]
- 11.Grzesiek S, Stahl SJ, Wingfield PT, Bax A. Biochemistry. 1996;35:10256. doi: 10.1021/bi9611164. [DOI] [PubMed] [Google Scholar]
- 12.Residues 122-435 or 158-435 (TGN38 peptide complex) of rat μ2 adaptin were expressed in E.coli as an NH2-terminal H6 fusion protein, and purified by NiNTA agarose and S200 gel filtration. Crystals were grown by hanging drop vapour diffusion at 16°C against a reservoir containing 2.2M NaCl, 0.4M Na/K phosphate, 10mM dithiothreitol, 15% v/v glycerol, 0.1M MES pH 6.5-7.1 over a period of two weeks. Crystals of the complex with the synthetic hexapeptides FYRALM or DYQRLN were grown under similar conditions with a 3-fold molar ratio of peptide to protein. The crystals belong to space group P64 (unit cell a=b=125.7Å, c= 73.2Å) with a single molecule in the asymmetric unit. All data were collected at 100K, at SRS Daresbury, station 9.6 (native, Xe and Hg derivatives, DYQRLN complex, λ = 0.87Å) and station 7.2 (FYRALM complex, λ = 1.488Å), integrated with MOSFLM (26) and scaled with CCP4 programs (27) (see Table 1). Despite the weak diffraction beyond 3Å resolution, the high redundancy of the data gives significant information for the two peptide complexes to 2.7Å. The structure was solved using a single site xenon derivative (incubated at 7bar for 10min, then frozen quickly after releasing the pressure) and a mercury derivative (soaked in 10mM ethymercury thiosalicylate (EMTS) for 30min). The sites were determined from difference Pattersons, and the refinement and phasing were performed with SHARP (28), followed by solvent flattening with SOLOMON (29), using a solvent content of 70%. The initial model was built with O (30) to the map for the native dataset at 3.0Å resolution, then transferred to the higher resolution dataset for the FYRALM complex and refined with REFMAC (31). The model of this complex includes the bound peptide, and 51 water molecules, but is missing the first 44 residues (MH6 tag and residues 122→158), and two loops, residues 221→237 and 256→260, for which there is no interpretable density. The native structure also contains electron density in the peptide binding site, probably from binding of an unidentified part of the NH2-terminus, so the derivatives were sufficiently isomorphous to the peptide complex to be used in phase calculations (see fig 1D). The shorter 158-435 construct used for the DYQRLN peptide complex did not crystallize in the absence of peptide: this isomorphous complex was refined starting with a model of the first complex with the peptide removed (see Fig 1E). Although the R-factors are rather high, presumably because of the high overall B-factor and the disordered regions, the experimental maps and the details of the peptide binding are clear (Figs 1D & 1E). The coordinates and structure factors have been deposited in the Protein Data Bank with codes 1BW8 (EGFR peptide complex) and 1BXX (TGN38 complex)
- 13.Sorkin A, Mazzoti M, Sorkina T, Scotto L, Beguinot L. J Biol Chem. 1996;271:13377. doi: 10.1074/jbc.271.23.13377. [DOI] [PubMed] [Google Scholar]
- 14.Bos K, Wraight C, Stanley KK. EMBO J. 1993;12:2219. doi: 10.1002/j.1460-2075.1993.tb05870.x. [DOI] [PMC free article] [PubMed] [Google Scholar]
- 15.Humphrey JS, Peters PJ, Yuan LC, Bonifacino JS. J Cell Biol. 1993;120:1123. doi: 10.1083/jcb.120.5.1123. [DOI] [PMC free article] [PubMed] [Google Scholar]
- 16.Collawn JF, et al. Cell. 1990;63:1061. doi: 10.1016/0092-8674(90)90509-d. [DOI] [PubMed] [Google Scholar]
- 17.Lowe ED, et al. EMBO Journal. 1997;16:6646. doi: 10.1093/emboj/16.22.6646. [DOI] [PMC free article] [PubMed] [Google Scholar]
- 18.Egloff M-P, et al. EMBO J. 1997;16:1876. doi: 10.1093/emboj/16.8.1876. [DOI] [PMC free article] [PubMed] [Google Scholar]
- 19.Ohno H, Fournier M-C, Poy G, Bonifacino JS. J Biol Chem. 1996;271:29009. doi: 10.1074/jbc.271.46.29009. [DOI] [PubMed] [Google Scholar]
- 20.Songyang Z, et al. Cell. 1993;72:767. doi: 10.1016/0092-8674(93)90404-e. [DOI] [PubMed] [Google Scholar]
- 21.Waksman G, et al. Nature. 1992;358:646. doi: 10.1038/358646a0. [DOI] [PubMed] [Google Scholar]
- 22.Nesterov A, Kurten RC, Gill GN. J Biol Chem. 1995;270:6320. doi: 10.1074/jbc.270.11.6320. [DOI] [PubMed] [Google Scholar]
- 23.Sorkin A, McKinsey T, Shih W, Kirchhausen T, Carpenter G. J Biol Chem. 1995;270:619. doi: 10.1074/jbc.270.2.619. [DOI] [PubMed] [Google Scholar]
- 24.Murray D, Ben-Tal N, Honig B, McLaughlin S. Structure. 1997;5:985. doi: 10.1016/s0969-2126(97)00251-7. [DOI] [PubMed] [Google Scholar]
- 25.Diederichs K, Karplus PA. Nature Structural Biology. 1997;4:269. doi: 10.1038/nsb0497-269. [DOI] [PubMed] [Google Scholar]
- 26.Leslie AGW. Joint CCP4 and ESF-EACMB Newsletter on Protein Crystallography No. 26. SERC, Daresbury Laboratory; Warrington, UK: 1992. [Google Scholar]
- 27.Collaborative Computational Project 4. Acta Crystallogr D. 1994;50:760. [Google Scholar]
- 28.de la Fortelle E, Bricogne G. Carter CW Jr, Sweet RM, editors. Methods in Enzymology. 1997;276:472. doi: 10.1016/S0076-6879(97)76073-7. [DOI] [PubMed] [Google Scholar]
- 29.Abrahams JP, Leslie AGW. Acta crystallogr. 1996;D52:30. doi: 10.1107/S0907444995008754. [DOI] [PubMed] [Google Scholar]
- 30.Jones TA, Zou JY, Cowan SW, Kjeldgaard M. Acta crystallogr A. 1991;47:110. doi: 10.1107/s0108767390010224. [DOI] [PubMed] [Google Scholar]
- 31.Murshudov GN, Vagin AA, Dodson EJ. Acta Cryst. 1997;D53:240. doi: 10.1107/S0907444996012255. [DOI] [PubMed] [Google Scholar]
- 32.Esnouf RM. Journal of Molecular Graphics. 1997;15:133. doi: 10.1016/S1093-3263(97)00021-1. [DOI] [PubMed] [Google Scholar]
- 33.Nicholls A, Sharp KA, Honig B. Proteins. 1991;11:281. doi: 10.1002/prot.340110407. [DOI] [PubMed] [Google Scholar]
- 31.We thank M.S.Robinson for the rat μ2 clone, A.J.McCoy and the staff of SRS Daresbury for assistance in data collection, L.LoConte and J.Janin for the surface area calculations, and H.T.McMahon, M.S.Robinson, & M.E.M.Noble for discussions.
Table 1. Statistics on data collection and phasing.
| Native | Xe | EMTS | FYRALM peptide complex | DYQRLN peptide complex | ||
|---|---|---|---|---|---|---|
| Protein construct | 122-435 | 122-435 | 122-435 | 122-435 | 158-435 | |
| Data collection+ | ||||||
| Resolution (Å) (outer bin) | 3.0 (3.16) | 3.0 (3.16) | 4.0 (4.22) | 2.65 (2.79) | 2.70 (2.85) | |
| Rmerge* | 0.101 (0.910) | 0.079 (0.851) | 0.116 (0.302) | 0.089 (0.882) | 0.101 (1.47) | |
| Completeness(%) | 99.9 (99.9) | 99.8 (99.8) | 99.7 (100) | 99.4 (96.7) | 98.4 (99.8) | |
| <<I>/σ(<I>)> | 17.3 (2.9) | 25.9 (2.2) | 20.2 (7.2) | 21.3 (2.1) | 23.5 (2.2) | |
| Multiplicity | 10.9 (10.6) | 10.7 (8.2) | 10.4 (10.6) | 9.2 (8.1) | 15.8 (14.7) | |
| Rmeas† | 0.106 (0.957) | 0.088 (0.985) | 0.124 (0.334) | 0.094 (0.942) | 0.104 (1.52) | |
| Wilson plot B (Å2) | 100 | 85 | 78 | |||
| Multiple isomorphous replacement Phasing: | ||||||
| Number of sites | 1 | 8 | ||||
| Rderiv‡ | 0.096 | 0.255 | ||||
| Rcullis¶: acentric (centric) | 0.643 (0.707) | 0.662 (0.683) | ||||
| Phasing power: acentric(centric)** | 1.88 (1.19) | 2.29 (1.87) | ||||
| Anomalous phasing power | 0.54 | 2.28 | ||||
| Mean figure of merit: acentric (centric) | 0.374 (0.350) | 0.187 (0.205)§ | ||||
| Figure of merit after solvent flattening (all data) | 0.864 | 0.849§ | ||||
| Refinement | ||||||
| R (Rfree)†† | 0.273 (0.297) | 0.282 (0.325) | ||||
| <B> (Å2) | 60 | 75 | ||||
| Nreflections (Nfree) | 19296 (842) | 18413 (801) | ||||
| Natoms (Nwater) | 2143 (51) | 2143 (50) | ||||
| rmsd bondlength (Å) | 0.010 | 0.012 | ||||
| rmsd angle distance (Å) | 0.038 | 0.040 | ||||
values in brackets apply to the high resolution shell
Rmerge = ΣΣi |Ih - Ihi| / ΣΣi Ih, where Ih is the mean intensity for reflection h
Rmeas = Σ√(n/n-1)Σi |Ih - Ihi| / ΣΣi Ih, the multiplicity weighted Rmerge (25)
Rderiv = Σ|FPH-FP|/ΣFP
Rcullis = Σ||FPH-FP|-|FHcalc||/Σ|FPH-FP|
Phasing power = < | FHcalc| / phase-integrated lack of closure>
Phasing using the FYRALM complex data as native
R = Σ|FP-Fcalc|/ΣFP


