Abstract
The reasons for the start and end of the induction period of cement hydration remain topic of controversy. One long-standing hypothesis is that a thin metastable hydrate forming on the surface of cement grains significantly reduces the particle dissolution rate; the eventual disappearance of this layer re-establishes higher dissolution rates at the beginning of the acceleration period. However, the importance, or even the existence, of this metastable layer has been questioned because it cannot be directly detected in most experiments. In this work, a combined analysis using nano-tomography and nano-X-ray fluorescence makes the direct imaging of early hydration products possible. These novel X-ray imaging techniques provide quantitative measurements of 3D structure, chemical composition, and mass density of the hydration products during the induction period. This work does not observe a low density product on the surface of the particle, but does provide insights into the formation of etch pits and the subsequent hydration products that fill them.
Keywords: Induction period, C3S hydration, C-S-H, Microstructure, Nanoscale
1. Introduction
The dissolution of tricalcium silicate (C3S2) and subsequent formation of hydration products are important processes that have been hypothesized to control the induction period of hydration of portland cement [1-5]. The induction period is of practical significance as it gives time for the concrete to be transported and cast into the desired shape. Although C3S dissolution has been studied for over a decade, there is still disagreement on the basic mechanisms due to a lack of sufficiently detailed observations, especially of direct, in-situ evolution of the microstructure of the C3S surface and the hydration products [1-8].
Recent publications have emphasized the importance of mineral dissolution in the induction period [9-12]. Initially, when solution is undersaturated with respect to the solid mineral, material is proposed to dissolve rapidly at surface defects such as screw dislocations, leaving etch pits [9,10]. Later, as the solution becomes increasingly saturated, the driving force for dissolution is evidently too low to sustain the unwinding of the etch pits, so dissolution may switch to a slower but more uniform step flow mechanism. Recent experimental work supports these ideas [8,13-17]. The uneven reaction on alite grains has been reported using scanning electron microscopy (SEM) and transmission electron microscopy (TEM) after two hours of hydration [8]. This preferential reactivity is related to the density of etch pits on the grains. From another pure dissolution experiment under a highly undersaturated solution flow on a polished section of a C3S sample, the reaction has been found to cause irregular morphological changes on the polished surface [15].
The formation of etch pits is suggested to be related to the high density of crystallographic dislocations, mechanical damage or other disordered defects in the crystal structure [9,16]. These defects on some anhydrous C3S particles have been imaged using TEM [16]. The impact of the density of defects on the induction period has also been confirmed by studying the same C3S material before and after annealing using calorimetry [16,17]. However, calorimetry experiments measure bulk heat release and do not provide insights into the details of the hydration product formation and dissolution process [18-21].
The formation of early age hydration products could impact the dissolution process. The exothermic behavior during the induction of C3S hydration observed using high-resolution differential calorimetry suggests that there is an early formation of hydration products over that period [20]. This early hydration product has been suggested to be a metastable phase, which could account for the slow hydration of C3S at this early period [19]. Recent experimental work has found that the pure dissolution of C3S in the absence of any precipitate happens at a much higher rate than the same material in a diluted suspension that promotes the formation of hydration products [22]. These results suggest that early hydration rate of C3S may be influenced by mechanisms other than its pure dissolution, namely the presence of hydration products. Additional analytical studies have suggested the importance of early hydration products on the dissolution of C3S and the impact of these early hydration products on the formation and structure of etch pits [5,23].
To better understand how hydration products are involved in the dissolution process, it would be helpful to have an experimental technique that could track the location, density, and chemical composition of the dissolution sites and hydration products. Both SEM and TEM have been widely used to study the early age microstructure during the induction period [8,9,13-16]. The hydration product is typically classified in terms of inner product or outer product, based on its location relative to the original boundary of the cement grain and the perceived differences in density or composition [24,25]. These early hydration products are typically found to have varied density and composition, the latter characterized by a molar Ca to Si ratio (Ca/Si) typically between 1 and 2, with a value of 1.7 commonly reported [8,19,18,26-28]. However, SEM and TEM imaging are not able to reliably locate the original surface of the anhydrous particle, so classifying C-S-H based on location can be challenging by these techniques.
In-situ soft X-ray microscopy has been used to capture time-lapse transmission images while C3S is reacting at an average water-to-solid mass ratio (w/s) of five [29]. The results provide insight into the changes in structure of the original particle and the surrounding hydration product, but image analysis is challenging because the 3D dataset is projected onto a 2D transmission image. This is similar to the radiographs shown later in this paper. The soft X-ray microscopy experiments show that in the presence of an accelerator, such as CaCl2, the reaction of C3S could form inner product to maintain the overall boundary of the particles during the early hydration period [29]. This inner product is found to be less dense than the hydration products observed from the solution without CaCl2, based on their X-ray absorption. However, detailed information about the chemical composition and density of the inner product material cannot be obtained by this technique.
Recent advances with synchrotron hard X-ray nanoprobes have allowed X-ray nano-computed tomography (nCT) and nano X-ray fluorescence to (nXRF) to become a reality. In addition, lab scale X-ray tomography instruments are able to achieve quite comparable measurements. These techniques are capable of non-destructively imaging at the nanoscale. The sample preparations for these techniques are minimal and so lend themselves to evaluating processes that change over time. These techniques can also be combined with other chemical mapping techniques or other experimental methods and the results can be used as a starting point for, or as a comparison to, computer simulations [30-37].
X-ray computed tomography (CT) is commonly used in the medical sciences to non-destructively image the internal structure of organisms. This technique combines a series of X-ray radiographs at small angles of rotation to produce a 3D model or tomograph [38,39]. The X-ray absorption contrast of the materials as a function of density and chemistry permits extraction of 3D structural information [40-42]. New lab-scale nCT systems that can use X-ray imaging energies as low as 5.4 keV have been developed. These lower X-ray energy levels provide sufficient transmission and improved contrast for cementitious and geologic materials; however, their imaging times are often longer than those at the synchrotron.
The nXRF technique uses a focused X-ray beam to illuminate a sample. Each chemical element fluoresces at characteristic energies along the path of the beam. An energy dispersive detector measures the fluorescence X-rays emitted by the sample. By rastering the primary X-ray beam over the sample it is possible to create 2D maps of its composition [31,33,43]. This technique can provide elemental maps with detection limits better than a part per million (ppm) by mass. One challenge with nXRF is the interaction volume of the X-ray beam with the sample, the extent of which is not well known. This means that the measurements are reported in terms of the elemental concentration only divided by the area of the beam without considering the length of each path of X-ray. As shown in previous publications, the combination of nCT and nXRF can be used to overcome this limitation. When combined in this fashion, the technique has been named nano-tomography assisted chemical correlation (nTACCo) [31].
In this paper, nCT was used to image individual C3S particles with sizes from 2 μm to 5 μm before and after 2.5 h of hydration and to make direct comparisons at different hydration times. The 3D microstructure datasets showed the reactions of these particles at their surfaces and in their interior. Two particles were analyzed by nTACCo, from which the chemical composition and mass density of the different regions of the reacted particles were measured. These results provide new insights into the dissolution and formation of early age hydration products and their role in the induction period.
2. Methodology
2.1 Materials
The triclinic C3S used in this study was manufactured by Mineral Research Processing3 (Meyzieu, France). This material was characterized with inductively coupled plasma optical emission spectroscopy (ICP-OES) for elemental composition, X-ray diffraction (XRD) for crystalline phase abundance, automated scanning electron microscopy (ASEM) on the dispersed powder for particle size distribution (PSD), multi-point nitrogen adsorption isotherms (BET) for specific surface area, and isothermal calorimetry for average hydration rates in water. The results from ICP-OES analysis using a dilution of 10 by mass and acidification with a 5 % nitric acid solution, and BET are shown in Table 1 and the calorimetry measurements are shown in Fig 1. The XRD analysis indicates this material is close to pure triclinic phase (T3). The PSD measured by ASEM using 4000 individual particles suggests that 95 % of the particles are between 1 μm and 7.5 μm in characteristic linear dimension. One sample in the calorimetry experiments used a 15 mmol/L lime solution with w/s = 5 to replicate the conditions of the experiments in this paper. Another sample of w/s = 0.40 reacted with deionized water was used to study the performance of this material at an industrially relevant w/s. A time period of 2.5 h is highlighted on the X-axis as a black wide bar. This is the time period used for the imaging experiments. Some sedimentation (bleeding) could occur in the sample with w/s = 5 during the experiment, but the results provide an average w/s that matches the nCT experiments. The details of these experiments are given in a previous publication [44].
Table 1.
The elemental composition based upon a single analysis and the surface area of C3S based on two analyses. An uncertainty in the surface area measurement of one standard deviation is given.
| ICP Elemental analysis (mole %) | Al <0.2 |
Ca 74.8 |
Mg #x0003C;0.002 |
Si 25 |
Sr 0.018 |
|
| |||||
| BET surface area (m2/g) | 1.2156± 0.0028 | ||||
Fig 1.
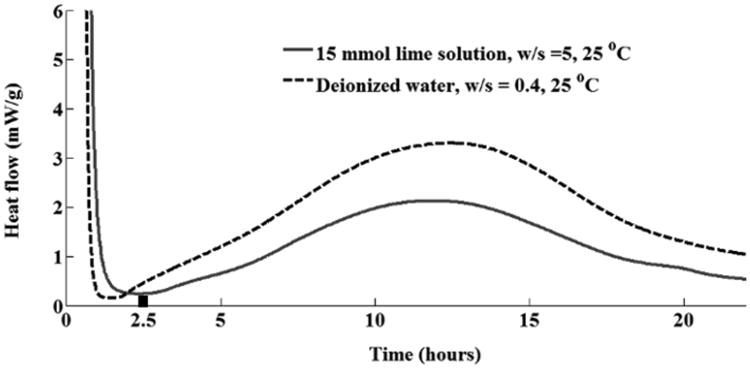
Curve from isothermal calorimeter. The wide bar on the X-axis shows the time period of hydration used in the imaging experiments.
2.2 Sample preparation and experimental steps
The sample was prepared by gluing multiple C3S particles on the tip of a tungsten needle with Devcon 5 minutes epoxy as shown in Fig 2. A plastic cone that fit tightly to the needle was used as a solution container. The cup has a small hole that allowed the needle to penetrate through it. The cup fit tightly to the needle and stayed in place due friction unless intentionally pulled up or down the needle. Additional C3S powder was attached on the side of the needle to make the average w/s = 5 within the cone volume.
Fig 2.
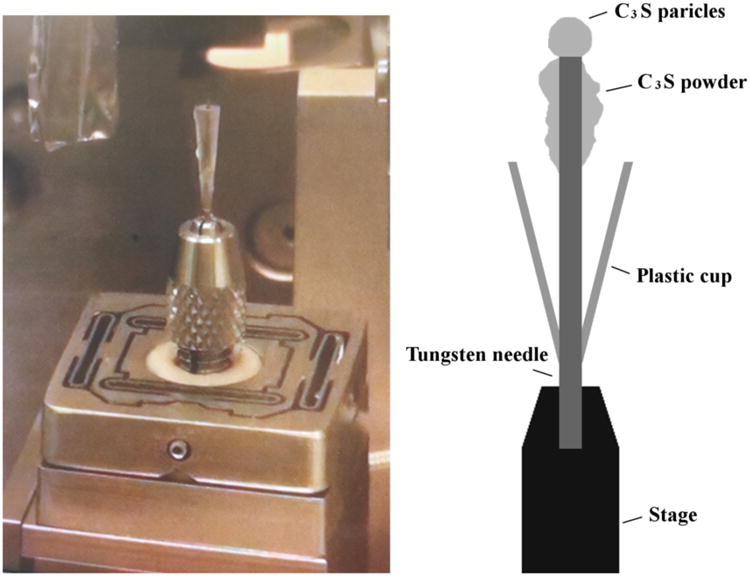
An overview of the experimental setup and the assembled setup on the beam line.
At the beginning of the experiment, an initial scan of the dry particle-needle configuration was made with the cup at the lowest location. Next, the sample was placed in an ultrahigh purity nitrogen environment and the cup was filled with 15 mmol/L lime solution at 25 °C. The cup was then raised to submerge the sample in solution. The sample was then sealed in the nitrogen environment to avoid carbonation and allowed to hydrate for 2.5 h. The seal was removed after the prescribed hydration time, the solution was removed, and the sample was submerged in 99 % isopropyl alcohol (IPA) for five minutes to arrest hydration. IPA was used because it has been suggested previously to have the least impact on the microstructure of hydrated samples [45,46]. Previous work with these same materials and techniques has indicated no observed differences in the microstructure before and after using IPA to stop hydration [44]. The cup was then lowered and the sample was placed back on the nCT scanner to obtain the final tomography scan. nXRF scans were also completed on two of the single particles for subsequent nTACCo analysis.
A w/s of 5 was used because it allowed sufficient X-ray transmission for tomographic imaging. If pure water had been used, the mounted particle might have reacted too quickly to make meaningful measurements, so a solution containing 15 mmol/L lime solution was chosen instead. Past research on microcalorimetry of continually stirred C3S in lime solutions, confirmed by the data in Fig 1, showed little influence on the hydration rate for w/s from 0.5 to 5 [47,48].
2.3 nano-tomography (nCT)
The nCT scanner used in this experiment was a Zeiss 810 Ultra (Carl Zeiss X-ray Microscopy, CA, USA) with X-ray energy level of 5.4 keV at the resolution of 65 nm per pixel. A detailed summary of the scan setting is given in Table 2. One nCT scan produces two different types of data sets. A radiograph is a 2D projection of the X-rays that pass through the sample in one direction. An example of a radiograph is shown in Fig 3. A tomograph is created from the reconstruction of all the radiographs from multiple angles. One tomograph is a 3D data set that contains a number of 2D virtual slice images through the sample, an example of which is shown in Fig 3. The grayscale value of a pixel represents the X-ray absorption of the material as a function of its local composition and density. With enough contrast, the segmentation of different phases can be made by the direct threshold of their gray values. This allows the 3D structure of the material to be rendered.
Table 2. The summary of the instrument settings for nCT and nXRF experiments.
| Resolution | 65 nm/pixel | |
| Numbers of radiographs from 0° to 180° | 901 | |
| nCT | Exposure time | 20 s |
| Source energy | 5.4 kev | |
| min | -5000 | |
| Dynamic ranges* | ||
| max | 5000 | |
|
| ||
| Resolution | 50 nm/pixel | |
| nXRF | Detector dwelling time | 0.1 s |
| Scaler count time | 0.1 s | |
the data is displayed in FLOAT type
Fig 3.
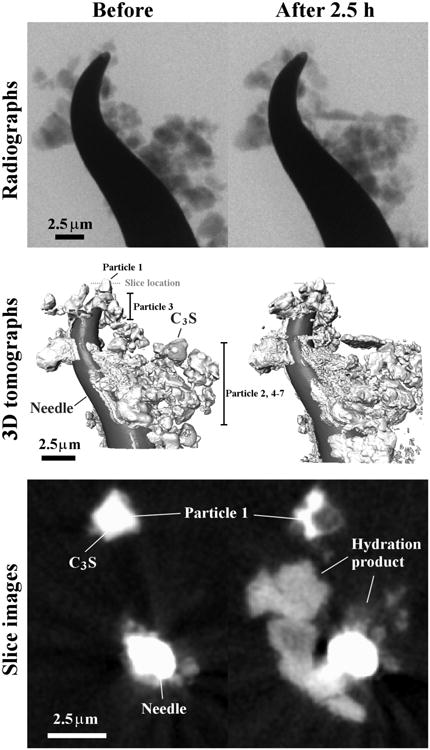
The nCT dataset showing a radiograph, tomograph, and a slice image crossing Particle 1.
Because of the nanometric length scale of this experiment, any small shifting of the sample due to thermal expansion or imperfection of stage positioning could change the position of the sample in the nCT data sets. To compensate for these movements and allow the same region to be compared, the data from before- and after hydration scans need to be aligned. Usually, this alignment can be accomplished by using the mounting needle as a reference point. However, because individual particles may have independent movements that do not match the needle, these individual particles were first separated from the sample and then their data were aligned individually. A computer algorithm was developed to find a rigid-body translation and rotation needed to match the scans taken before and after the reaction. The algorithm is explained in supplementary information. Seven particles were investigated in this study, which were chosen because they could be found in the scan before and after hydration. An example of a data set for an individual particle is shown in Fig 4.
Fig 4.
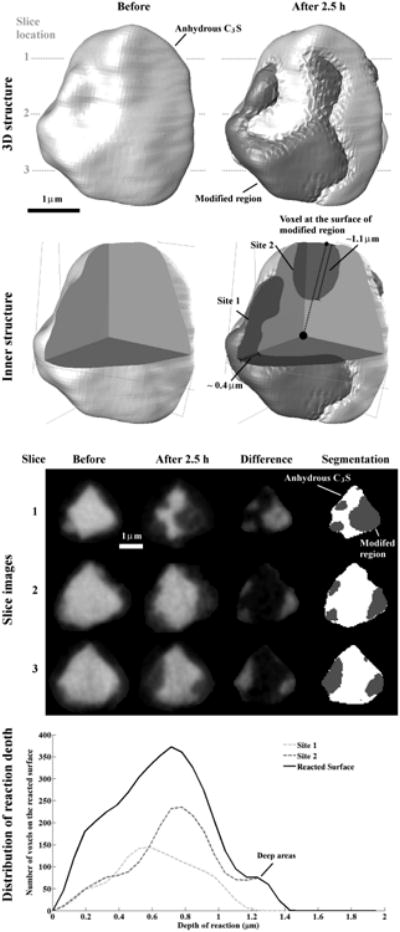
The nCT datasets of Particle 1 showing before and after 2.5 h of reaction with the 3D outer and inner structure, typical cross sections, and the distribution of reaction depths. The modified regions is a darker gray and the anhydrous C3S is lighter. These results show that certain regions of the particle show higher amounts of reaction while still maintaining the original particle border.
Repeatability of this experiment was not possible because of the significant time required for data collection and analysis. However, measurement variation is reported whenever possible and the raw measurements have been included. The reader should be encouraged that over ten thousand measurements are made on each particle both before and after the reaction. This means that the included measurements are numerous.
2.4 Depth of reaction
The depth of reaction of each particle was quantified by drawing a straight line from the reacted surface to the centroid of the particle. When this line reaches anhydrous C3S, the distance is recorded and this determines the depth of reaction. With this technique, every voxel on the reacted surface provides an independent measurement of the reaction depth. A histogram for the reaction depths was determined at 65 nm intervals. In addition, an alternative approach, details of which are given in the supplementary information, was also applied to measure the depth of reaction normal to the surface of the particle. Both analyses show similar results. The depths of reaction reported in the paper were measured using the first approach.
To examine the distribution of reaction depth for every particle, the histogram for all the voxels on the reacted surface is plotted as the “Reacted Surface” as shown at bottom of Fig 4. For some particles, the reactions are localized on some disconnected regions. These areas are selected as individual sites to plot their distributions separately in order to compare their depths to other regions.
For some particles, zones of total dissolution were observed. These material existed before hydration but are no longer present after hydration. To quantify the depths of these dissolved regions, the same method is used by measuring the centroid distance from the original surface, but counting only the length within the dissolved regions. This depth is plotted as the “Dissolved Regions”.
2.5 nano-X ray fluorescence
The nXRF measurements were made with an X-ray spot size smaller than 50 nm at the hard X-ray nano-probe beamline at sector ID-26 of the Advanced Photon Source (APS) and the Center of Nanoscale Materials (CNM) at Argonne National Laboratory. The instrument settings are given in Table 2 and more details can be found in Winarski et al. [49].
X-ray fluorescence radiation is detected with a four-element silicon drift energy dispersive detector (Vortex ME4) [49]. Additional details can be found in Hu et al. [31]. Fluorescence was analyzed using the software package MAPS [50]. Fitting and quantification of the fluorescence data were performed with thin film standards (National Bureau of Standards, Standard Reference Material 1832 and 1833). An anhydrous C3S particle was used as an additional standard material to increase the accuracy.
nXRF has two limitations that make its interpretation challenging: 1) the X-ray beam penetrates through the material and causes X-ray fluorescence along its path, which makes it challenging to determine depth-dependent information in the sample; 2) a portion of the fluoresced X-rays is absorbed by the sample before it can reach the detector. Both of these limitations can be overcome by combining the structural information from nCT with the nXRF datasets.
After aligning the two data sets, the nCT measurements can determine the travel path of the nXRF beam as well as the different materials the beam traverses. Next, the areas analyzed by nXRF are carefully chosen so that they are close to the EDS detector (less than 4 μm from the edge). By reducing the travel path of the X-rays, the absorption is reduced to about 10 % for Si and 5 % for Ca [51]. Finally, a region of anhydrous C3S was purposely included in this analysis so that these measurements could be compared to measurements of the C3S standard.
2.6 Data Fusion of nCT and nXRF (nTACCo)
An overview of the data fusion of nCT and nXRF, which will be called nTACCo for brevity, is shown in Fig 5. The nCT and nXRF data are aligned by comparing 2D radiographs to match the particle boundary and areas of uniquely identifiable chemical composition. Additional details about nTACCo are provided in earlier publications [31,44].
Fig 5.
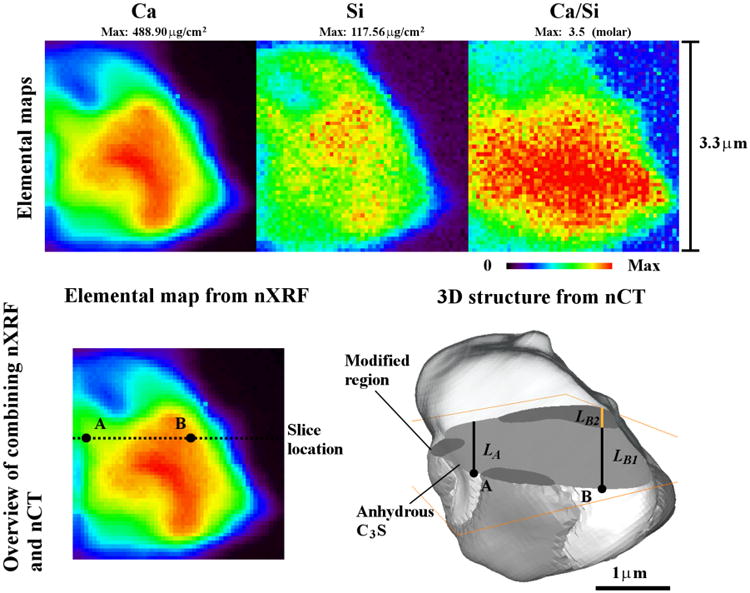
The elemental maps from nXRF analysis of Particle 1. An overview of the scheme of de-convoluting the nXRF elemental maps by using the structural information from nCT datasets.
The nXRF signal can be deconvoluted after aligning the data sets to determine the chemical composition for each individual constituent in the particle. Examples of this process are shown using Particle 1 in Fig 5 at locations A and B. At location A, the nCT data show that the X-ray beam only passes through the anhydrous C3S. This material will have a concentration, CA, per unit area of the beam (μg/μm2), and the length of travel, LA, is expressed in μm. The concentration density can then be calculated at point A in μg/μm3 as
| (1) |
This process is then repeated at location B. According to the nCT data, this location has two constituents present and the aligned data can help determine the path length of the X-ray beam through each constituent (LB1, LB2). Since the concentration density of the anhydrous C3S was determined in the calculation of location A, and at 119 other points like it, the average value, , can be used to estimate the concentration of the region modified during hydration (DMod). The concentration density of the modified region, DMod, can be found by subtracting the average concentration of the anhydrous C3S multiplied by the length of the path through that material (LB1) from the total concentration at point B and then dividing by the depth of the modified region at that location (LB2), using the equation
| (2) |
This process was completed for 497 points. The average and one standard deviation are given in Table 4. For Particle 3, the number of measurements is 122 for the modified region. The results for anhydrous C3S are not reported due to the insufficient number of measurements of this material.
Table 4.
The elemental density and mass density of the constituents on Particle 1 and 3.
| Modified region | Anhydrous C3S | |||
| Particle 1 | Particle 3 | Particle 1 | Standard | |
|
| ||||
| Ca (g/cm3) | 0.62±0.18 | 0.47±0.09 | 1.69±0.18 | 1.69±0.06 |
| Si (g/cm3) | 0.26±0.06 | 0.24±0.07 | 0.40±0.06 | 0.40±0.03 |
| Mass density (g/cm3) | 1.69±0.43 | 1.34±0.22 | 3.22±0.36 | 3.20±0.13 |
| Ca/Si (molar) | 1.68±0.55 | 1.53±0.64 | 3.01±0.28 | 3.03±0.16 |
3. Results
The calorimetry data in Fig 1 indicate that the measurements taken at 2.5 h occur during the period of slow reaction that commences shortly after mixing with water. In Fig 3, the nCT data of the entire sample shows some changes caused by the formation of hydration products and the movement of individual particles; however, there are no large changes in volume or dimensions. A slice from the 3D tomograph shows a cross-section from Particle 1 before and after the 2.5 h reaction. This particle is modified in some areas within its original boundary, but has not formed a significant amount of outer product (i.e., outside the original surface of the C3S grain). Seven particles have been investigated in detail for this paper and their locations are shown on the 3D tomograph. The volumetric changes of these particles are summarized in Table 3. The initial volume of the particle is labeled as “Original”. After hydration for 2.5 h, the volumes are labeled as “Modified”, “Dissolved” and “Total”. The modified region is a portion of the particle that has changed in gray value when compared to the original scan. The dissolved material corresponds to an area where there was material in the original scan, but after 2.5 h the material in the region is gone. The column labeled “Total” is the sum of the modified and dissolved material. The percentage of change in volume for each particle is calculated by dividing the total volume of hydrated phases by the initial particle volume.
Table 3.
The summary of the measurements of volume and drilling depth of dissolution for seven particles.
| Particles | Original (μm3) | After hydration(μm3) | |||||
|---|---|---|---|---|---|---|---|
|
| |||||||
| Anhydrous C3S | Regions of changes | Percentage of change | Depth of reaction (μm) Ave±Std | ||||
| Modified | Dissolved | Total | |||||
| 3 | 12.33 | 1.21 | 11.12 | ∼0 | 11.12 | 90.2% | 1.40±0.30 |
| 5 | 17.21 | 12.47 | 4.74 | ∼0 | 4.74 | 27.5% | 0.72±0.29 |
| 1 | 22.32 | 13.87 | 8.44 | ∼0 | 8.44 | 37.8% | 0.61±0.29 |
| 6 | 27.75 | 19.01 | 8.74 | ∼0 | 8.74 | 31.5% | 0.59±0.45 |
| 7 | 50.43 | 38.16 | 12.27 | ∼0 | 12.27 | 24.3% | 0.59±0.40 |
| 4 | 88.17 | 81.30 | 5.89 | 0.98 | 6.87 | 9.0% | 0.52±0.40 |
| 2 | 97.71 | 68.73 | 20.13 | 8.85 | 28.98 | 30.2% | 0.64±0.35 |
|
| |||||||
| Avg= | 33.7% | 0.72 | |||||
| Std dev | 23.6% | 0.3 | |||||
3.1 Analysis of individual particles
The nCT data for each particle are used to show its 3D structure, inner structure, typical slices and the distribution of reaction depth. A typical example is shown in Fig 4. The slice locations are indicated by gray dashed lines on the 3D structural model. The inner structure shows the particle with a quadrant removed so that the internal structure of the particle can be observed. These slices and inner structure are chosen to highlight the interior changes of the particle. The images in the column “Before” give the original boundary of the anhydrous C3S particle; the images in column “After 2.5 h” show how these same areas changed after 2.5 h of hydration.
None of the particles investigated undergo much change in their overall size or shape, but portions of all of them have regions with some changes in gray value. Changes in gray value mean that the reacted regions could have different density, different composition, or both. To determine the regions of high change, the “Before” and “After” images are subtracted so that the areas of change are highlighted in the “Difference” column of Fig 4. These areas of significant change are collectively called the “modified region”. The modified region could be partially dissolved C3S or perhaps a newly formed hydration product. However, this cannot be determined from just the nCT results. The nXRF data will be used to provide more insight into these regions later in the paper.
Next, the data are separated into different materials by using a set of constant gray value ranges. These regions were labeled as “Anhydrous C3S”, “Modified region”, or “Dissolved region”. The dissolved regions were defined as those high change regions with a gray value close to that of air.
3.2 Detailed Analysis of Particle 1
As shown in Table 3, Particle 1 had an original volume of 22.32 μm3. After 2.5 hours of hydration, 37.8 % of the particle volume was modified. In Fig 4, these modified regions are localized to two primary sites, Site 1 and Site 2. As revealed by removing a quadrant from the particle to examine the internal structure, the depths of the two sites are significantly different, being about 0.4 μm for Site 1 and about 1.1 μm for Site 2. The differences in depths for two sites are further described by comparing their distributions, which show that Site 2 has more areas with depth greater than 0.6 μm than Site 1 (the bottom figure in Fig 4). Moreover, a peak can be observed from the depth distribution of Site 2 near 1.2 μm, which indicates some local areas on the particle can react to much greater depths than other regions. The average reaction depth of the entire reacted surface is calculated as 0.61 μm with one standard deviation of 0.29 μm as given in Table 3.
3.3 Detailed Analysis of Particle 2
The data for Particle 2 are shown in Fig 6. Originally, this particle had a volume of 97.71 μm3. After 2.5 h of hydration, 21 % of the particle was modified and 9 % dissolved. The images from five different internal locations show the formation of interior structures, including a deep pit and a hole in slice 1 to 3 and 5. This pit penetrates much farther than the other regions, reaching 1.4 μm, compared with the average reaction depth of 0.64 μm.
Fig 6.
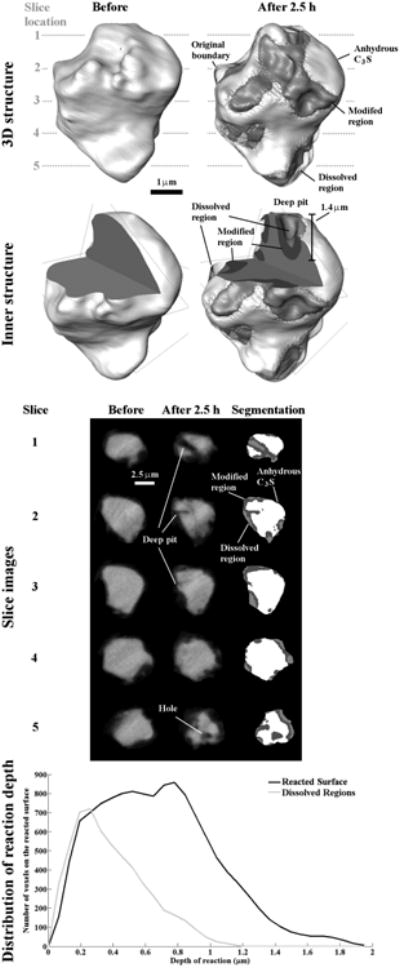
The nCT datasets for Particle 2 showing changes before and after 2.5 h of reaction. This particle shows changes in the overall geometry from the dissolution.
The distribution in reaction depth for this particle was examined by plotting the Reacted Surface based on the depths of the modified regions. The majority of the reaction depths are limited to within one standard deviation of the mean, which is (0.64 ± 0.35) μm; however, some areas of the particle have pits with depths greater than 1.5 μm. The depths for the Dissolved regions are plotted separately based on measuring the depth only within these regions. The majority of the dissolved areas are within one standard deviation range of the mean, (0.38 ± 0.23) μm, but some areas can still reach as deep as 1 μm.
3.4 Particles with different degrees of reaction
The apparent extents of reaction among different particles are quite variable. As an example, Particle 3 in Fig 7 shows almost 90 % change in its interior while still maintaining the original boundary. Only a small region of the particle remains unreacted on the surface. This anhydrous region corresponds to the areas of low reaction depth that appear as a small peak located at about 0.4 μm in the bottom figure of Fig 7.
Fig 7.
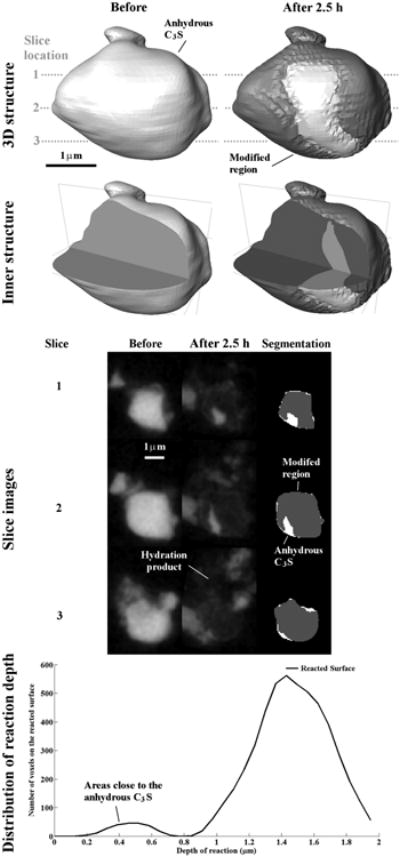
The nCT datasets for Particle 3 showing changes in the particle before and after 2.5 h of reaction. The particle shows a high amount of modified material.
In contrast to Particle 3, Particle 4 (Fig 8) changed in volume by 9 %. Like Particle 2, Particle 4 also has some regions that are “Dissolved”. In the image of “Before” at slice 1, a split in the lower left corner of the particle indicates this area may be damaged. After reaction, the regions close to that split show more reaction than any other regions on the particle, forming a localized reaction site (Site 1). Site 1 is the only area on this particle that has a depth greater than 1 μm.
Fig 8.
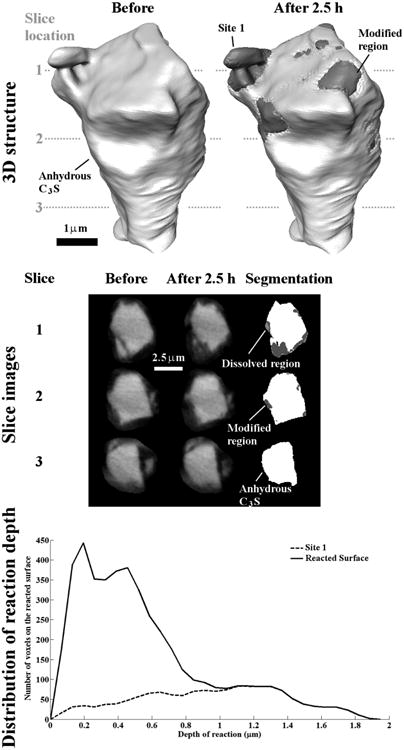
The nCT datasets for Particle 4 before and after 2.5 h of reaction. This particle shows a very low amount of modified material.
3.5 The chemical composition of the modified region
The molar Ca/Si and estimated mass densities for Particles 1 and 3 are given in Table 4. Their probability distributions are estimated by dividing individual number of measurements by the total within an interval of 0.06 g/cm3 for Ca and Si density, 0.2 for Ca/Si, and 0.2 g/cm3 for mass density as shown in Fig 9. The resulting distributions are close to a Gaussian shape. For the modified region on Particle 1, average densities of Ca and Si are (0.62 ± 0.18) g/cm3 and (0.26 ± 0.06) g/cm3, respectively, corresponding to an average Ca/Si molar ratio of 1.68 ± 0.55. The modified region on Particle 3 shows a similar density of Si, (0.24 ± 0.0) g/cm3, but lower density of Ca, (0.4 ± 0.09) g/cm3, yielding an average Ca/Si molar ratio of 1.53 ± 0.64. Based on previous publications, these ratios suggest C-S-H [8,19,21,26,27,52]. One possible explanation is the preferential leaching of Ca ions, but others have shown that C3S dissolution is congruent [3,53]. To determine the stoichiometry for these regions of C-S-H, the amount of bonded H2O needs be determined. According to a recent study on the structural modeling for C-S-H, the H2O/Si of the hydration product after drying at 110° C is approximately a linear function of the Ca/Si [54]:
Fig 9.
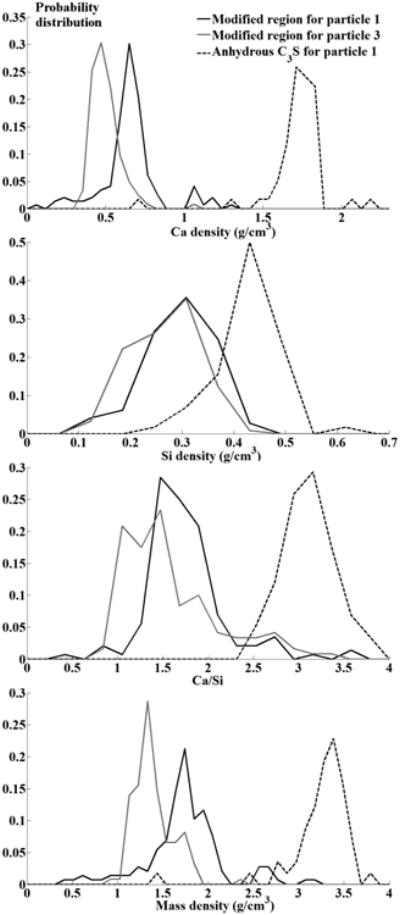
The probability distribution of Ca and Si, Ca/Si ratio, and mass density for each constituent analyzed by nTACCo technique.
| (3) |
Assuming the generic chemical formula to be Cx-S-Hy, where x is the Ca/Si ratio and y is the H2O/Si ratio in equation (3), one could estimate the mass density based on the measured Ca and Si densities.
Using this procedure, the calculated average dried mass densities are (1.69 ± 0.43) g/cm3 and (1.34 ± 0.22) g/cm3 for the modified region on Particles 1 and 3, respectively, which could be higher if the pores are filled with solution. The predicted density in the literature is about 1.7 g/cm3 for the low-density product, or even lower if the material has higher porosity based on the colloidal structural models of C-S-H [55]. The variation among the calculated mass densities is mainly attributed to the different Ca densities between the two materials. Although nXRF measurements were not made on all the particles, similar gray values were measured in the tomographs for these regions. Since the gray value is an indication of the X-ray absorption, this suggests that all of these regions would have composition and density close to what has been classically called low-density C-S-H.
3.6 Summary of particle modifications
The volumetric results of seven particles are summarized in Table 3. The additional nCT data for Particles 5, 6 and 7 are given in the supplementary information. The amount of modification of the particles varied from 9 % to 90 %, indicating that the reaction behavior of individual particles is quite different and that the particle modification does not happen uniformly around the particle surface. This could be attributed to the differences in particle sizes, the number density of the reaction sites, and the reactivity of the sites. Excluding Particles 3 and 4, the remaining particles have a similar average degree of modification (34 %), but the standard deviation of 24 % indicates that the local extents of reaction are quite variable. All particles except for Particle 3 show similar average depths of reaction, within one standard deviation of the mean, (0.72 ± 0.3) μm.
The modified particles lie completely within their original boundaries. This means that the phenomenon of forming hydration product while the C3S is reacting at the same location predominates over pure dissolution without precipitation. However, certain regions of the two largest particles (Particles 2 and 4) dissolved completely, and have modified regions of much larger volumes.
4. Discussion
4.1 Degree of modification
The percentage changes in volume shown in Table 3 are higher than one would expect from the literature based on bulk analysis [3,21,56]. It should be noted that all of the particles investigated were quite small (< 5 μm diameter) and the reaction depths of the particles were similar. If similar reaction depths were observed in larger particles, those particles would have significantly lower percentage volume change than indicated Table 3. Larger particles will be the primary contribution to the volume of material in the bulk analysis, which may be why bulk measurements do not correspond to the measurements in this study.
4.2 Preferential reactions
Although the triclinic C3S used in this experiment is a pure material, the reaction on every particle is not uniform and does not cover the entire surface. Some regions show more reactions than others. This preferential reaction could be caused by the high density of defects, such as crystallographic imperfections, mechanical damage, or other disorder in the crystal structure [9]. These high-defect regions could cause more etch pits to form and lead to rapid localized dissolution. This observation of preferential reaction agrees with the findings of earlier SEM/TEM studies [8,13-16]. Also, the smaller particles may be more reactive because they could originate from material that has been broken off during the grinding process and so could have originated from these high defect areas from a larger particle. Further work is needed to investigate this.
4.3 The formation of inner product
Congruent dissolution is expected for crystalline materials such as C3S with ionic bonding, and indeed has been demonstrated previously for C3S [3,56]. One important observation in Figures 4–8 is that little, if any, hydration product extends beyond the surface of the original particle but rather fills in the regions where dissolution has occurred
Observations from soft X-ray microscopy have suggested that the rapid dissolution of C3S caused by adding CaCl2 accelerator leads to the formation of inner product (i.e., product within the boundary of the original particle) as the material dissolves [29]. This would cause the particles to appear to maintain their original boundaries despite rapid dissolution. The rapid reaction may increase the local ion concentration faster than the ions can be transported away from the surface, resulting in immediate precipitation.
4.4 Possible mechanism and influences
Figure 10 illustrates one hypothesized mechanism for the formation of hydration product entirely within the boundaries of the original particle. First, as regions of anhydrous C3S react with solution, etch pits start to form on the surface. Rapid dissolution continues to occur inside the pit. This dissolution makes the ionic concentration inside the pit much higher than the surrounding regions. If the ionic concentration continues to increase within the pit at a greater rate than it can diffuse into the bulk solution, the locally supersaturated solution may drive hydration products to nucleate in, and begin filling, the pit. This would continue until the hydration product reaches the original surface of the particle. Growth could slow down significantly or stop when the product nears the top of the pit where it begins to encounter bulk solution that is significantly less concentrated than the solution in the pit, especially considering the relatively high w/s used in this experiment. If the w/s were lower, the ionic concentration in the surrounding fluid would likely be higher and therefore the hydration product might continue to form outside the original particle boundary. Investigating this possibility is an area of future work.
Fig 10.
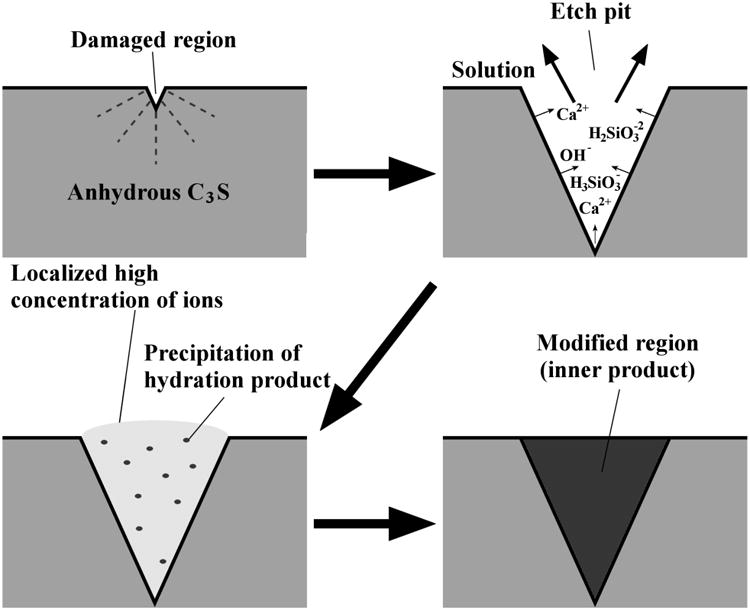
A demonstration of mechanism of how the hydration could form in the etch pit during dissolution.
It is also possible that other mechanisms cause the formation of the hydration products within the pit. For example the high-energy surface created by the expansion of an etch pit could promote preferential precipitation of hydration products inside the pits [23].
For Particles 2 and 4, the geometry or reactivity of the pit appears to lead to a low local concentration, so these portions of the particle dissolve and do not fill with hydration product. In any case, important changes are occurring before 2.5 h of hydration, which are characterized by rapid localized dissolution and precipitation. Ionic concentration gradients in the local areas appear to be important on this length scale and may control localized hydration.
The early formation of some kind of hydration product has been hypothesized to influence reaction rates during the early periods of hydration [18-21]. According to this hypothesis, the early hydration product preferentially forms at locations where the C3S has rapidly dissolved. Once this hydration product forms at an active C3S reaction site, it may physically block further dissolution or at least reduce diffusive mass transfer away from these sites; either way, this hydration product would reduce the reaction rates of the covered C3S. This proposed mechanism supports the importance of the formation of early hydration products and their control of dissolution of C3S during the induction period. Numerical models have been used to show that hydration products formed within etch pits could inhibit the further reaction of C3S [23].
5. Conclusion
Seven individual C3S particles were studied by nCT, and two of these particles with nXRF, after hydration for 2.5 h with w/s = 5 in 15 mmol/L lime solution. The nCT technique is able to give a one-to-one comparison of the same region before and after reaction to show precisely how and where the reaction happens. These datasets can be turned into 3D models to show the reactions on both the surface and interior of the particles. These observations can also be quantified into volumetric datasets. Using nTACCo, the nCT and nXRF data were combined to characterize the chemical compositions and mass densities of the constituents on two reacted particles.
The following results on the microstructural changes of individual C3S particles have been found from nCT datasets:
The reactions of individual particles are not uniformly distributed on the surface or within the particles.
The percentage volume change varies from 9 % to 90 % for different particles, with an average of 33.7 % and standard deviation of 23.6 %.
The depth of reaction after 2.5 h also varies with location with an average depth of reaction of 0.72 μm and standard deviation of 0.3 μm.
Two larger particles are observed to have regions that dissolved.
The particles retain their original geometry after they react for 2.5 h. The modified region seems to fill the space of the dissolved material.
Based on nTACCo the following results were found:
The modified region seems to be C-S-H with average Ca/Si of 1.53 and 1.68 for two different particles with similar Si density, but different Ca density.
The average mass densities for these modified materials are 1.34 g/cm3 and 1.69 g/cm3 for two particles.
The formation of this hydration product is hypothesized to form because of local supersaturation inside etch pits. This observation suggests that the formation of this hydration product may reduce the activity of these reactive sites on the C3S.
Supplementary Material
Fig S.1. The nCT datasets for Particle 5
Fig S.2. The nCT datasets for Particle 6
Fig S.3. The nCT datasets for Particle 7
Fig S.4. The distributions of reaction depth for particles 1 to 7 given in (a) – (g), using the measurement along the orientation perpendicular to the surface.
Table S.1. The comparisons of mean and standard deviation of the reaction depths measured between first and second approach to calculate the depth of reaction.
Footnotes
Conventional cement chemistry notation is used throughout this paper: C = CaO, S = SiO2, H = H2O.
Certain commercial equipment, instruments, or materials are identified in this report in order to specify the experimental procedure adequately. Such identification is not intended to imply recommendation or endorsement by the National Institute of Standards and Technology, nor is it intended to imply that the materials or equipment identified are necessarily the best available for the purpose
References
- 1.Bullard JW, Jennings HM, Livingston RA, Nonat A, Scherer GW, Schweitzer JS, Scrivener KL, Thomas JJ. Mechanisms of cement hydration. Cement and Concrete Research. 2011;41:1208. [Google Scholar]
- 2.Taylor HFW, Barret P, Brown PW, Double DD, Frohnsdorff G, Johansen V, Menetrier-Sorrentino D, Odler I, Parrott LJ, Pommersheim JM, Regourd M, Young JF. The hydration of tricalcium silicate. Materiaux et Constructions. 1984;17:457. [Google Scholar]
- 3.Nicoleau L, Nonat A, Perrey D. The di- and tricalcium silicate dissolutions. Cement and Concrete Research. 2013;47:14. [Google Scholar]
- 4.Garrault S, Finot E, Lesniewska E, Nona A. Study of C-S-H growth on C3S surface during its early hydration. Materials and Structures. 2005;38:435. [Google Scholar]
- 5.Bullard JW, Scherer GW, Thomas JJ. Time dependent driving forces and the kinetics of tricalcium silicate hydration. Cement and Concrete Research. 2015;74:26. [Google Scholar]
- 6.Scrivener KL, Juilland P, Monteiro JM. Advances in understanding hydration of Portland cement. Cement and Concrete Research. 2015;78:38. [Google Scholar]
- 7.Scrivener KL, Nonat A. Hydration of cementitious materials, present and future. Cement and Concrete Research. 2011;41:651. [Google Scholar]
- 8.Gallucci E, Mathur P, Scrivener K. Microstructural development of early age hydration shells around cement grains. Cement and Concrete Research. 2010;40:4. [Google Scholar]
- 9.Juilland P, Gallucci E, Flatt R, Scrivener K. Dissolution theory applied to the induction period in alite hydration. Cement and Concrete Research. 2010;40:831. [Google Scholar]
- 10.Lasaga AC, Luttge A. Variation of crystal dissolution rate based on a dissolution stepwave model. Science. 2001;291:2400. doi: 10.1126/science.1058173. [DOI] [PubMed] [Google Scholar]
- 11.Dove PM, Han N. Kinetics of mineral dissolution and growth as reciprocal microscopic surface process across chemical driving force. AIP Conference Proceeding. 2007;916:215. [Google Scholar]
- 12.Dave PM, Han N, De Yoreo JJ. Mechanisms of classical crystal growth theory explain quartz and silicate dissolution behavior. PNAS. 2005;102:15357. doi: 10.1073/pnas.0507777102. [DOI] [PMC free article] [PubMed] [Google Scholar]
- 13.Menetrier D, Jawed J, Sun TS, Skalny J. ESCA and SEM studies on early C3S hydration. Cement and Concrete Research. 1979;9:473. [Google Scholar]
- 14.Makar JM, Chan GW. End of induction period in ordinary Portland cement as examined by high-resolution scanning electron microscopy. J Am Ceram Soc. 2008;91:1292. [Google Scholar]
- 15.Juilland P, Gallucci E. Morpho-topological investigation of the mechanisms and kinetic regions of alite dissolution. Cement and Concrete Research. 2015;76:180. [Google Scholar]
- 16.Bazzoni A, Cantoni M, Scrivener K. Impact of annealing on the early hydration of tricalcium silicate. J Am Ceram Soc. 2014;97:584. [Google Scholar]
- 17.Fierens P, Verhaegen JP. Induction period of hydration of tricalcium silicate. Cement and Concrete Research. 1976;2:287. [Google Scholar]
- 18.Makar JM, Beaudoin JJ, Sato T, Alizadeh R, Raki L. Discussion of “Dissolution theory applied to the induction period in alite hydration”. Cement and Concrete Research. 2011;41:565. [Google Scholar]
- 19.Jennings HM. Aqueous solubility relationships for two types of calcium silicate hydrate. J Am Ceram Soc. 1986;69:614. [Google Scholar]
- 20.Hou P, Kong D, Kawashima S, Qian J, Corr DJ, Shah SP. A novel evidence for the formation of semi-permeable membrane surrounding the Portland cement particles during the induction period. J Therm Anal Calorim. 2013;113:881. [Google Scholar]
- 21.Gartner E. Discussion of the paper “Dissolution theory applied to the induction period in alite hydration” by P. Juilland et al., Cem. Concr. Res 40 (2010) 831-844. Cement and Concrete research. 2011;41:560. [Google Scholar]
- 22.Bellmann F, Sowoidnich T, Ludwig H, Damidot D. Dissolution rates during the early hydration of tricalcium silicate. Cement and Concrete Research. 2015;72:108. [Google Scholar]
- 23.Nicoleau L, Bertolim MA. Analytical model for the alite (C3S) dissolution topography. J Am Ceram Soc. 2015 [Google Scholar]
- 24.Kjellsen KO, Lagerblad B. Microstructure of tricalcium silicate and Portland cement system at middle of hydration-development of Hadley grain. Cement and Concrete Research. 2007;37:13. [Google Scholar]
- 25.Kjellsen KO, Justnes H. Revisiting the microstructure of hydrated tricalcium silicate –a comparison to Portland cement. Cement & Concrete Composite. 2004;26:947. [Google Scholar]
- 26.Richardson IG. The nature of C-S-H in harden cements. Cement and Concrete Research. 1999;29:1131. [Google Scholar]
- 27.Richardson IG. The calcium silicate hydrates. Cement and Concrete Research. 2008;38:137. [Google Scholar]
- 28.Chen JJ, Sorelli L, Vandamme M, Ulm F, Chanvillard G. A coupled Nanoindentation /SEM-EDS study on low water/cement ratio Portland cement paste: evidence for C-S-H/Ca(OH)2 nanocomposites. J Am Ceram Soc. 2010;93:1484. [Google Scholar]
- 29.Juenger M, Monteiro P, Gartner EM, Denbeaux GP. A soft X-ray microscope investigation into the effects of calcium chloride on tricalcium silicate hydration. Cement and Concrete Research. 2005;35:19. [Google Scholar]
- 30.Provis JL, Rose V, Winarski RP, van Deventer JS. Hard X-ray nanotomography of amorphous aluminosilicate cements. Scripta Materialia. 2011;65:316. [Google Scholar]
- 31.Hu Q, Aboustait M, Ley MT, Hanan J, Rose V, Winarski RP. Combined three-dimensional structural and chemistry imaging with nanoscale resolution. Acta Materialia. 2014;77:173. [Google Scholar]
- 32.Wang J, Chen-Wiegart YK, Wang J. In situ three-dimensional synchrotron X-ray nanotomography of the (De)lithiation processes in tin anodes. Angew Chem Int Ed. 2004;53:4460. doi: 10.1002/anie.201310402. [DOI] [PubMed] [Google Scholar]
- 33.Bernal SA, Provis JL, Rose V, Mejia de Gutierrez R. High-resolution X-ray diffraction and fluorescence microscopy characterization of alkali-activated slag-metakaolin binders. J Am Cerm Soc. 2013;96:1951. [Google Scholar]
- 34.Chae SR, Moon J, Yoon S, Bae S, Levitz P, Winarsk R, Monteiro P. Advanced nanoscale characterization of cement based materials using X-ray synchrotron radiation: a review. International journal of concrete structure and materials. 2013;7:95. [Google Scholar]
- 35.Holt M, Harder R, Winarski R, Rose V. Nanoscale hard X-ray microscopy method for materials studies. Annu Rev Mater Res. 2013;43:183. [Google Scholar]
- 36.Chen Y, Geddes JB, III, Yin L, Wiltzius P, Braun PV. X-ray computed tomography of holographically fabricated three-dimensional photonic crystals. Adv Mater. 2012;24:2863. doi: 10.1002/adma.201200411. [DOI] [PubMed] [Google Scholar]
- 37.Shirato N, Cummings M, Kersell H, Li Y, Stripe B, Rosenmann D, Hla SW, Rose V. Elemental Fingerprinting of Materials with Sensitivity at the Atomic Limit. Nano Letters. 2014;14:6499. doi: 10.1021/nl5030613. [DOI] [PubMed] [Google Scholar]
- 38.Kak AC, Slaney M. Principal of Computerized Tomographic Imaging. Philadelphia: Society of Industrial and Applied Mathematics; 2001. [Google Scholar]
- 39.Kalender WA. Computed Tomography: Fundamentals, System Technology, Image quality, Applications. 3rd. Erlangen: Publicis Publishing; 2011. [Google Scholar]
- 40.Trtik P, Diaz A, Guizar-Sicairos M, Menzel A, Bunk O. Density mapping of hardened cement paste using ptychographic X-ray computed tomography. Cement & Concrete Composites. 2013;36:71. [Google Scholar]
- 41.Gallucci E, Scrivener K, Groso A, Stampanoni M, Margaritondo G. 3D experimental investigation of the microstructure of cement pastes using synchrotron X-ray microtomography (mCT) Cement and Concrete Research. 2007;37:360. [Google Scholar]
- 42.Hu Q, Ley T, Davis J, Hanan J, Frazier R, Zhang Y. 3D chemical segmentation of fly ash particles with X-ray computed tomography and electron probe microanalysis. Fuel. 2014;116:229. [Google Scholar]
- 43.Provis JL, Rose V, Bernal SA, van Deventer JS. High-resolution nanoprobe X-ray fluorescence characterization of heterogeneous calcium and heavy metal distribution in alkali-activated fly ash. Langmuir. 2009;25:11897. doi: 10.1021/la901560h. [DOI] [PubMed] [Google Scholar]
- 44.Hu Q, Aboustait M, Kim T, Ley MT, Hanan JC, Bullard J, Winarski R, Rose V. Direct three-dimensional observation of the microstructure and chemistry of C3S hydration. doi: 10.1016/j.cemconres.2016.07.006. Submitted. [DOI] [PMC free article] [PubMed] [Google Scholar]
- 45.Zhang J, Scherer G. Comparison of methods for arresting hydration of cement. Cement and Concrete Research. 2011;41:1024. [Google Scholar]
- 46.Snoeck D, Velasco LF, Mignon A, Van Vlierberghe S, Dubruel P, Lodewyckx P, De Belie N. The influence of different drying techniques on the water sorption properties of cement-based materials. Cement and Concrete Research. 2014;64:54. [Google Scholar]
- 47.Damidot D, Nonat A, Barrel P. Kinetics of tricalcium silicate hydration in diluted suspensions by microcalorimetric measurements. J Am Cerm Soc. 1990;73:3319. [Google Scholar]
- 48.de Jong JG, Stein HN, Stevels M. Hydration of tricalcium silicate. J appl Chem. 1967;17:246. [Google Scholar]
- 49.Winarski RP, Holt MV, Rose V, Fuesz P, Carbaugh D, Benson C, et al. A hard X-ray nanoprobe beamline for nanoscale microscopy. J Synchrotron Rad. 2012;19:1056. doi: 10.1107/S0909049512036783. [DOI] [PMC free article] [PubMed] [Google Scholar]
- 50.Vogt S. MAPS: A set of software tools for analysis and visualization of 3D X-ray fluorescence data sets. J Phys IV France. 2003;104:635. [Google Scholar]
- 51.Hubbell J. Photon Mass Attenuation and Energy-Absorption Coefficients from 1 keV to 20 MeV. Int J Appl Radiat Isot. 1982;33:1269. [PubMed] [Google Scholar]
- 52.Allen AJ, Thomas JJ, Jennings HM. Composition and density of nanoscale calcium-silicate-hydrate in cement. Nature Materials. 2007;6:311. doi: 10.1038/nmat1871. [DOI] [PubMed] [Google Scholar]
- 53.Barret P, Menetrier D, Bertrandie D. Mechanism of C3S dissolution and problem of the congruency in the very initial period and later on. Cement and Concrete Research. 1983;13:728. [Google Scholar]
- 54.Richardson IG. Model structures for C-(A)-S-H (I) Acta Cryst. 2014;B70:903. doi: 10.1107/S2052520614021982. [DOI] [PMC free article] [PubMed] [Google Scholar]
- 55.Jennings HM, Thomas JJ, Gevrenov JS, Constantinides G, Ulm F. A multi-technique investigation of nanoporosity of cement paste. Cement and Concrete Research. 2007;37:329. [Google Scholar]
- 56.Barret P, Menetrier D, Bertrandie D. Mechanism of C3S dissolution and problem of the congruency in the very initial period and later on. Cement and Concrete Research. 1983;13:728. [Google Scholar]
Associated Data
This section collects any data citations, data availability statements, or supplementary materials included in this article.
Supplementary Materials
Fig S.1. The nCT datasets for Particle 5
Fig S.2. The nCT datasets for Particle 6
Fig S.3. The nCT datasets for Particle 7
Fig S.4. The distributions of reaction depth for particles 1 to 7 given in (a) – (g), using the measurement along the orientation perpendicular to the surface.
Table S.1. The comparisons of mean and standard deviation of the reaction depths measured between first and second approach to calculate the depth of reaction.


