

Summary
We have applied high field (W-band) pulse electron-nuclear double resonance (ENDOR) and electron-electron double resonance (ELDOR) detected NMR (EDNMR) to characterize the coordination sphere of the Mn2+ co-factor in the nucleotide binding sites (NBSs) of ABC transporters. MsbA and BmrCD are two efflux transporters hypothesized to represent divergent catalytic mechanisms. Our results reveal distinct coordination of Mn2+ to ATP and transporter residues in the consensus and degenerate NBSs of BmrCD. In contrast, the coordination of Mn2+ at the two NBSs of MsbA is similar which provides a mechanistic rationale for its higher rate constant of ATP hydrolysis relative to BmrCD. Direct detection of vanadate ion, trapped in a high-energy post-hydrolysis intermediate, further supports the notion of asymmetric hydrolysis by the two NBSs of BmrCD. The integrated spectroscopic approach presented here, which link energy input to conformational dynamics, can be applied to a variety of systems powered by ATP turnover.
eTOC Blurb
Collauto, Mishra et al. used W-band hyperfine spectroscopy to follow ATP hydrolysis at the nucleotide binding sites of two ABC transporters, the homodimer MsbA and the heterodimer BmrCD. The results provide direct evidence of asymmetric hydrolysis at the nucleotide binding sites of BmrCD arising from different coordination of the bound ATP molecule.

Introduction
ATP-hydrolysis coupled conformational change is a central theme in many molecular machines including helicases, transporters, molecular chaperons and others (Mayer and Bukau, 2005; Prabu et al., 2015; Pyle, 2011; Rees et al., 2009). The structural features underlying this coupling are often not well defined and therefore the mechanistic understanding of the catalytic cycle of such systems is incomplete. Resolving these features requires atomic level observation of structural rearrangements at the ATP hydrolysis site (ATPase site) along with the associated conformational changes in the protein under turnover conditions. Here, we introduce a new EPR (electron-paramagnetic resonance) based spectroscopic approach that allows focusing on the local atomic details in the ATPase site under turnover conditions, combined with long range distance measurements that track the coupled conformational change, and apply it to resolve an important, open mechanistic question in the ABC transporter field.
ABC (ATP binding cassette) transporters transduce the energy of ATP hydrolysis to drive the energetically uphill movement of substrates across cell membranes (Rees et al., 2009). ABC exporters efflux substrates out of the cytoplasm while ABC importers traffic substrates into the cytoplasm (George and Jones, 2012; Higgins and Linton, 2004). A dedicated domain, referred to as the ATP binding cassette or nucleotide binding domain (NBD), contains conserved sequence motifs including Walker A and Walker B that enable the binding and turnover of ATP and the release of ADP and inorganic phosphate, Pi (Higgins and Linton, 2004; Rees et al., 2009). The core functional unit of an ABC transporter consists of two NBDs and two transmembrane domains (TMDs) (Higgins and Linton, 2004). Two nucleotide binding sites or NBSs form at the interface between the two NBDs with one domain contributing a Walker A motif while the other contributing an ABC signature sequence. Other catalytic elements such as the Walker B and Q loop are required to carry out the hydrolysis of the ATP (Locher, 2016). It has been demonstrated that the catalytic cycle involves a high-energy post-hydrolysis state (HES) that is populated following the scission of the γ-phosphate bond but prior to the release of the inorganic phosphate. The HES, sometimes referred to as the transition state of ATP hydrolysis, can be trapped by the addition of vanadate along with ATP (Oldham and Chen, 2011; Sharma and Davidson, 2000). ATP binding and turnover in the NBD powers conformational changes in the TMD to drive the transporter from inward-to outward-facing conformations presumably translocating the substrate across the membrane (George and Jones, 2012).
Multiple models have been proposed to describe the mechanism of ATP turnover and the coupling of the input energy to the TMD of ABC exporters (George and Jones, 2012; Higgins and Linton, 2004). Crystallographic and spectroscopic analyses of homodimeric ABC exporters, which have consensus sequence motifs in the NBDs demonstrated that ATP turnover can be carried out at both NBSs (Borbat et al., 2007; Ward et al., 2007; Zou et al., 2009). ATP binding drives the formation of a catalytic NBD dimer while its hydrolysis drives dimer dissociation in a two-state transition coupled to alternating access in the TMD (Borbat et al., 2007; Zou et al., 2009). In contrast, a more complex mechanistic scheme has been proposed for ABC heterodimeric exporters where one of the NBSs is impaired through mutations in the conserved sequence motifs (hereafter referred to as the degenerate NBS) (Mishra et al., 2014). Specifically, (Mishra et al., 2014) carried out a detailed analysis of the conformational dynamics of the ABC heterodimer BmrCD by introducing pairs of spin labels at the NBSs and utilizing double electron-electron resonance spectroscopy (DEER) (Jeschke, 2012; McHaourab et al., 2011) to directly monitor structural asymmetry. In contrast to MsbA, detailed analysis of the distance distributions was interpreted to suggest that ATP turnover occurs primarily in the consensus NBS while the impaired NBS, also referred to as the degenerate NBS, tightly binds ATP. The model does not exclude rare turnover of ATP at the latter and transient population of an apo state by the transporter. Alternating hydrolysis between the two NBSs has been proposed for the mammalian ABC transporter Pgp where the NBD sequence motifs are intact but the NBDs have undergone sequence divergence (George and Jones, 2012; Siarheyeva et al., 2010; Tombline and Senior, 2005). Recently, a detailed model of sequential hydrolysis of ATP by Pgp was proposed on the basis of analysis of conformational changes by DEER spectroscopy (Verhalen et al., 2017).
While these distinct models were considered contradictory (George and Jones, 2012), emerging evidence (Mishra et al., 2014) support the notion that there are intrinsic mechanistic divergence between subclasses of ABC exporters at the level of the ATP catalytic cycle. To further investigate molecular bases for these divergences, we have utilized high field (W-band, 95 GHz) pulsed EPR, specifically the hyperfine spectroscopy techniques ENDOR (electron-nuclear double resonance) and EDNMR (electron-electron double resonance (ELDOR) detected NMR) (Schosseler et al., 1994), to directly monitor the state of the bound nucleotide at different steps of ATP turnover in the NBSs of the bacterial homodimer MsbA (Dong et al., 2005; Ward et al., 2007) and the bacterial heterodimer BmrCD (Galian et al., 2011; Mishra et al., 2014). Toward this end, we substituted the EPR-silent essential metal co-factor Mg2+, which is coordinated to nucleotides at the NBSs, with the paramagnetic Mn2+ ion (S = 5/2) and followed the coupling to the 31P nuclei (I = 1/2) of the coordinated nucleotide phosphate and the 14N nuclei contributed by the bound nucleotide and by transporters’ residues, through a series of freeze-quench experiments. While ENDOR is a well-established technique and is particularly useful for characterizing the coordination sphere of Mn2+, EDNMR has been gaining attention only during the last decade as a result of the increase use of high field EPR spectrometers (Banerjee et al., 2011; Bruch et al., 2015; Cox et al., 2013; Cox et al., 2015; Fittipaldi et al., 2008; Florent et al., 2011; Kaminker et al., 2010; Kaminker et al., 2014; Klein et al., 2012; Kulik et al., 2005; Mino and Ono, 2003; Nalepa et al., 2014; Potapov et al., 2012; Rapatskiy et al., 2012; Un, 2013). Here we show that the intensity of the EDNMR signal can be utilized to follow the evolution of the ATP turnover reaction. Moreover, it has a high sensitivity to signals of coupled 14N nuclei, which often pose difficulties for ENDOR due to their low frequency. Together, the two techniques enabled the observation of ATP hydrolysis along with the relevant conformational changes monitored with DEER under the same conditions. Rigorous analysis of EDNMR signals reveal for the first time that asymmetric ATP hydrolysis in an ABC heterodimer results from different coordination of the Mn2+/ATP complex in the degenerate NBS. The findings also confirm intrinsic catalytic differences between ABC homodimers and heterodimers.
Results
Typically, the ATPase activity of enzymes is followed under conditions of excess Mg2+/ATP to ensure complete occupancy of the nucleotide binding sites. Because the goal is to monitor the coordination sphere of Mn2+, an excess of Mn2+/ATP in the solution would mask signals obtained from the protein bound Mn2+/ATP. Therefore, we used conditions of ~1:1.3–1.7 molar ratio of Mn2+/ATP to monomeric transporter, noting that each functional dimeric transporter has two NBSs. Although these conditions results in a significant slow-down of the ATP turnover reaction, it does not alter the reaction mechanism in general, and, more importantly, retains the fundamental differences between the two transporters under study.
Mn2+ Supports ATP Turnover by BmrCD and MsbA
We established that the substitution of Mg2+ by Mn2+ does not abrogate ATP hydrolysis by the transporters (see Figure S1). Vmax of ATP turnover by MsbA were not affected in the presence of Mn2+ (1.38 ± 0.02 μmol/min/mg) but there was a decrease in the Km (0.28 ± 0.015 mM) at 37°C for MsbA-WT* relative to the reaction in Mg2+ [Vmax (1.20 ± 0.03 μmol/min/mg), Km (0.40 ± 0.03 mM)]. In contrast, Vmax of BmrCD-WT* was 2-fold slower in the presence of Mn2+ (20.47 ± 1.78 nmol/min/mg) than Mg2+ (Vmax (40.51 ± 1.44 nmol/min/mg) while Km was greater in the presence of Mn2+ (1.55 ± 0.33 mM) than in the presence of Mg2+ (1.04 ± 0.11 mM).
Low ATP Concentrations Support Conformational Changes
Because of the reduced concentration of nucleotides and Mn2+ required for ENDOR and EDNMR spectroscopy, we carried out DEER analysis to determine if the two transporters undergo ATP-dependent conformational changes under these conditions in detergent micelles. Specifically we monitored the nucleotide binding sites (NBSs) as previously described (Mishra et al., 2014). For BmrCD, two distinct pairs of spin labels reported on the consensus and degenerate NBS respectively. Figure 1 shows that a 1:0.6–1 molar ratio of Mg2+/ATP to transporter supports assembly of the NBS bringing together the Walker A motif of one NBD and the signature motif of the other NBD. In contrast to the apo conditions (nucleotide-free), both degenerate and consensus sites show distance populations corresponding to the HES in the presence of ATP. For reference, the distance distribution of the apo and HES, formed under excess ATP/Mg2+ concentration and trapped by vanadate (Vi), are shown. Because at substoichiometric concentrations of ATP/Mg2+, not all the transporters can have a bound nucleotide, a heterogeneous distribution is observed. Similarly, addition of vanadate to trap the HES under low ATP concentrations does not yield a homogenous distribution as expected from an ensemble of transporters in different catalytic states including a large fraction of transporters in the apo state due to the substoichiometric Mg2+/ATP concentration.
Figure 1. Conformational dynamics of BmrCD and MsbA.
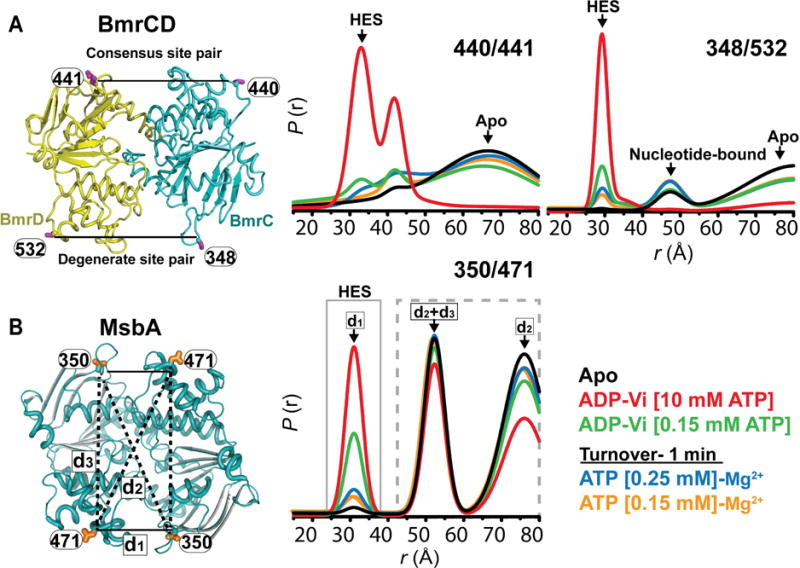
(A) Ribbon model of BmrCD NBDs in the dimer state showing the location of spin label pairs monitoring the consensus (440/441) and the degenerate (348/532) NBSs. The distance distributions show distance components characteristic of the HES in the presence of sub-stoichiometric ratio of Mg2+/ATP. (B) Ribbon diagram of MsbA NBDs (PDB:3B60) in the dimer state showing the location of spin label pair (350/471). Similar to BmrCD, distance components corresponding to the HES are observed under substoichiometric levels of Mg2+/ATP. See also Figure S1 and S2.
DEER analysis of MsbA’s NBS also reveals the assembly of the NBSs in a subpopulation of transporter. As previously described, the short distance component (d1, around 30Å) in the distribution is an exclusive signature of the assembled NBSs. The other components reflect other distances that result from having four spin labels in the homodimer as previously reported and analyzed in details (Mishra et al., 2014).
Identification of Bound Nucleotides by 31P-ENDOR
The identity of the nucleotide phosphates, or their analogues, coordinated to the paramagnetic Mn2+ (S = 5/2) is deduced from analysis of the lineshape of the signals of 31P nuclei (I = 1/2) in the ENDOR spectrum. Initially, we analyzed the ENDOR spectra of the two transporters trapped in their pre-hydrolysis, ATP-bound state upon incubation with the non-hydrolyzable ATP analogue AMPPNP, and in their post-hydrolysis mimic upon incubation with ADP. As described in the Method Details, in both cases the ratio of a 1:1 Mn2+:(nucleotide phosphate) complex was kept sub-stoichiometric with respect to the monomeric protein (1:1.3–1.7) in order to ensure quantitative binding of Mn2+/ATP (ADP).
The 31P-ENDOR spectra of MsbA (Figure 2A) show a doublet with a peak-to-peak splitting of 4 MHz. A detailed comparative inspection of the lineshape reveals two kinds of environment of the Mn2+ ion: an ATP-bound one, characterized by the presence of shoulders at 57.1 MHz and 59.1 MHz (noted by arrows in Figure 2) which correspond to an effective hyperfine coupling, A, of 2 MHz, and an ADP-bound one, characterized by the absence of these signals. The origin of the A=2 MHz features in the spectrum of ATP-bound Mn2+ is ascribed to the hyperfine interaction with the γ-phosphate group of the nucleotide triphosphate analogue (Kaminker et al., 2011; Potapov and Goldfarb, 2006; Un and Bruch, 2015). The corresponding spectra of BmrCD are presented in Figure 2b. No detectable differences are observed between the 31P-ENDOR spectra of the two transporters. Furthermore, the spectra are closely reminiscent of the ones observed in the 31P-ENDOR characterization of the catalytic cycle of the E. Coli RNA helicase DbpA (Kaminker et al., 2011), as well as of the ones observed for the free Mn2+/AMPPNP and Mn2+/ADP complexes in solution (Potapov and Goldfarb, 2006). While the spectra look similar in general, a close look reveals some subtle differences in the intensity of the inner shoulder between free Mn2+/AMPPNP and Mn2+/ATP (Fig. 2C). There are also subtle differences between the free and the bound complexes: the intensity of the inner shoulder is lower for the bound Mn2+/AMPPNP and there is a slight increase in the splitting of the maxima of the ENDOR doublet components (~0.1 MHz) in the bound Mn2+/ADP. These are attributed to very small changes in the coordination geometry of the Mn2+. Detailed simulations of such types of spectra were reported earlier (Potapov and Goldfarb, 2006; Un and Bruch, 2015).
Figure 2. W-band 31P-ENDOR spectra reveal the identity of the coordinated nucleotide.

Normalized 31P-ENDOR of (A) MsbA and (B) BmrCD in the ATP-bound state (+ Mn2+/AMPPNP), under turnover conditions (+ Mn2+/ATP, 1 and 30 minutes) and the post hydrolysis state (+ Mn2+/ADP). For BmrCD the spectrum in the presence of Mn2+/ATP, 30 minutes, 30°C (green) should also correspond to the post hydrolysis state. For reference, the normalized 31P-ENDOR spectra of solutions of Mn2+/AMPPNP, Mn2+/ATP, Mn2+/ADP are presented in (C). The dashed lines and the arrows denote the distinctive features which are present in the spectrum of ATP-bound Mn2+ and absent in the spectrum of ADP-bound Mn2+.
Upon incubation of the transporters with Mn2+/ATP, hydrolysis of ATP is expected to take place in absence of the transport substrate. Therefore, samples were prepared at the same concentrations that were used for the characterization of the pre-hydrolysis and post-hydrolysis states. For MsbA, incubation with Mn2+/ATP for 1 minute at 37°C yields the spectrum of the post-hydrolysis state, as evident from the complete disappearance of the signals at 57.1 and 59.1 MHz (Figure 2). For BmrCD, after incubation with Mn2+/ATP for 1 minute at 30°C these signals can still be identified, thus indicating incomplete ATP hydrolysis under the experimental conditions used. For reference, incubation of BmrCD with Mn2+/ATP for 30 minutes at 30°C yields the spectrum of the post-hydrolysis state. We also observe a general reduction of the ENDOR effect between the ATP-bound and ADP-bound states as evident from the increased noise of the latter. Because the analysis of the ENDOR spectra focuses on lineshape changes, we chose to normalize all spectra to the same intensity to allow for direct comparison.
EDNMR of the Pre-hydrolysis and Post-hydrolysis States Reveals Different Coordination of ATP in BmrCD and MsbA
Unlike ENDOR, EDNMR allows recording the hyperfine spectrum in a rather wide frequency range (typically from 0 MHz to ±150 MHz in our spectrometer) within a single experimental setup resulting in a complete profile of the ligands in the close environment of the Mn2+ ion. We recorded the EDNMR spectra of the transporters trapped in their pre-hydrolysis and post-hydrolysis states (Figure 3). The baseline-corrected spectra from both transporters are similar as observed for the 31P ENDOR spectra. Signals arising from the interaction with 14N (I = 1), 23Na (I = 3/2), 31P (I = 1/2), 55Mn (I = 5/2) and 1H (I = 1/2) are identified, as noted in Figure 3.
Figure 3. EDNMR spectra demonstrates distinct coordination of ATP in the NBSs of MsbA and BmrCD.

(A), (C) MsbA + Mn2+/AMPPNP and + Mn2+/ADP. (B), (D) BmrCD + Mn2+/AMPPNP and + Mn2+/ADP. Panels (A) and (B) show the full scans, panels (C) and (D) show details of the 14N double-quantum region and of the 31P single-quantum region. See also Figure S3 and S4.
Expansion of the regions around the 14N and 31P Larmor frequencies, presented in Figure 3C, D, reveals that the 14N signal arising from the single quantum (ΔmS = ±1, ΔmI(14N) = ±1) forbidden transitions does not show any visible fine structure. In contrast, the signal arising from the double quantum (ΔmS = ±1, ΔmI(14N) = ±2) forbidden transitions, appearing in the region of twice the 14N Larmor frequency, (~20.15 MHz), comprises a doublet. The splitting of this doublet corresponds to twice the 14N hyperfine coupling, AN, yielding 2AN = 4.6 MHz (AN = 2.3 MHz); a value close to 2.6 MHz is reported in the literature for a wide class of systems containing Mn2+-coordinated nitrogen atoms (Un, 2013). It is worth noting that the 14N coupling constant found for transporter-bound Mn2+/AMPPNP and Mn2+/ADP complexes and for free Mn2+/ATP complex (Figure S4A; 2AN = 4.7 MHz) are equal within the resolution of the EDNMR spectra. In the case of the free Mn2+/ATP complex, we assign the 14N signal to the coordination of Mn2+ by the adenosine N-7 nitrogen of ATP. As far as the intensity is concerned, we observe no significant difference between the 14N single quantum lines in the ADP-bound and AMPPNP-bound forms for both transporters (Fig. 3A,B), whereas differences are observed for the double quantum lines in MsbA (Fig. 3C). Because both types of lines do not behave similarly, and taking into account the susceptibility of the intensities of the small double quantum peaks to the background correction, we preferred not to over interpret these intensity differences.
The intensities of the 14N single and double quantum lines in the spectra of the transporter-bound complex are significantly stronger than in the free Mn2+/ATP complex, suggesting that they may have contributions from proximal side chains. To differentiate nitrogen ligands originating from the ATP molecule versus those from the proteins, we carried out EDNMR measurements on samples prepared with 15N-enriched ATP (ATP(15N5)). The 14N–15N region of the EDNMR spectrum of free Mn2+/ATP(15N5), shown in Figure 4A, reveals a signal at the 15N Larmor frequency (14.0 MHz) assigned to weakly coupled, not-directly coordinated nitrogen atoms, and a doublet centered around 14.0 MHz with a hyperfine splitting of 4 MHz, assigned to a directly coordinated nitrogen. A weak signal at 6.4 MHz is assigned to K+ ions, present at higher concentration in the MsbA buffer compared to the BmrCD buffer most likely as a consequence of the different detergents. This signal can be clearly identified in the free Mn2+/ATP spectrum prepared in the MsbA buffer compared to the BmrCD buffer (Figure 4).
Figure 4. EDNMR of Mn2+/15N5-ATP identifies a BmrCD Nitrogen atom coordinated to Mn2+.

(A) MsbA+Mn2+/ATP(15N5) and (B) BmrCD + Mn2+/ATP(15N5) for samples frozen after 5 sec (red) and 1 hour (black) of incubation at 30°C. In all panels the spectrum of Mn2+/ATP(15N5) in absence of any protein is presented in (blue), prepared in the corresponding MsbA and BmrCD buffers. Spectra were normalized to the 55Mn signal at 94 MHz. See also Figure S3 and S4.
The spectrum of MsbA frozen after 5 sec incubation with Mn2+/ATP(15N5) shows distinct differences from that of the free Mn2+/ATP. The observed 15N signals indicate the presence of coordinated ATP. In contrast, a sample frozen after 1 h of incubation with Mn2+/ATP(15N5) shows enhanced 14N double quantum doublet, whereas the 15N signal has practically disappeared. The spectrum is very similar to that of the corresponding natural abundance ATP (see Figure S4B). Because after 1 h incubation all ATP molecules in the sample have been converted to ADP (see Figure 2), this spectrum represents the Mn2+/ADP-bound MsbA. The difference between the spectra of 5 sec and 1 h incubation times indicates that the binding modes of ADP and ATP to MsbA are different with ADP/Mn2+ coordinated to a nitrogen atom contributed by an MsbA residue.
We observed distinct differences in the time evolution of the EDNMR spectra of BmrCD incubated with Mn2+/ATP(15N5) (Figure 4B). The 14N signal after only 5 sec incubation (the shortest measurement time) is much larger than that observed for MsbA. Because the ATP hydrolysis rate is much slower for BmrCD we can exclude that the stronger 14N signal arises from a larger amount of ADP that is coordinated to the transporter. Therefore, this suggests a different binding mode of Mn2+/ATP to BmrCD, at least for one of the NBSs, where it has features similar to those of Mn2+/ADP, in terms of the coordinated transporter nitrogen atom. After 1 h of incubation, the 14N signals dominate as expected from almost complete turnover of ATP to ADP. We note that the signal present at 13.8 MHz, close to the 15N Larmor frequency (14.3 MHz) cannot be due to 15N because it appears also in the sample prepared with natural abundance ATP (see Fig. S3B). We assign it to the interaction with 35Cl-ions (Larmor frequency is 13.8 MHz) present in the buffer.
Analysis of the 31P region reveals a doublet with a splitting consistent with the one found in the 31P-ENDOR spectra. However, the fine structure, which allowed the distinction between the ATP-bound and ADP-bound states in 31P-ENDOR, is not observed in 31P-EDNMR. EDNMR shows less resolved spectral features due to the different selection rules determining the lineshapes of EDNMR and ENDOR spectra and additional broadening arising from the resolution being limited by the Mn2+ phase memory time (Schosseler et al., 1994). While there is no substantial difference in the EDNMR lineshape and only subtle differences in the 31P splitting (4.51 MHz to 4.87 MHz for MsbA and 4.58 MHz to 4.70 MHz for BmrCD) between the ATP and ADP states, a large difference in the 31P signal intensity is observed between the pre-hydrolysis and the post-hydrolysis states (Figure 3). This difference can be attributed to two concurrent phenomena: (i) The coordination of Mn2+ to an additional phosphorous in ATP (and in its analogues) with respect to ADP and (ii) the different dissociation constants for Mn2+/ATP and Mn2+/ADP, resulting in different populations of the complexed states. For example, for the dissociation constants of free Mn2+/ATP and Mn2+/ADP reported in the literature (Himes and Cohn, 1967) and assuming [Mn2+] = [ATP], [ADP] = 150 μM, 73% of the (Mn2+, ATP) species are expected to be in the bound state whereas only 44% of the (Mn2+, ADP) species are expected to be in the bound state. These values may further be different when Mn2+/ATP and Mn2+/ADP are bound to the transporters.
31P-EDNMR Detection of ATP Turnover
The observation that the pre-hydrolysis and the post-hydrolysis states in both transporters are characterized by a large difference in the 31P-EDNMR signal intensity (referred to as the ELDOR efficiency) prompted us to explore the possibility of following the kinetics of ATP turnover through the EDNMR signal.
It has already been shown that in the case of 14N and 2H the EDNMR signal intensity is proportional to the number of nuclei in the vicinity of Mn2+ (Un, 2013). To verify that this is also the case for 31P, we prepared a series of complexes of Mn2+ with different ATP/ADP molar mixtures and measured the 31P-EDNMR signal intensity as a function of the relative ATP concentration (Figure S5A). The results show that the intensity of the 31P-EDNMR signal has a linear correlation with the concentration of ATP. This could arise from the combination of a different number of coordinated phosphates and of different binding constants, as discussed earlier. Accordingly, in the context of ATP turnover experiments this finding allows the transformation of the 31P-EDNMR signal into relative concentrations of ATP- and ADP-bound states, thus enabling us to follow ATPase kinetics in a quantitative way.
For this purpose, both MsbA and BmrCD were incubated with Mn2+/ATP at 30°C at the same sub-stoichiometric amount for both transporters (see Method Details). The samples were mixed and frozen after a time t and EDNMR spectra were recorded. The results of the time course experiments are reported in Figure 5 and the corresponding stack plots of the EDNMR spectra are presented in Figure S5C, D. The spectra were recorded only in the 31P spectral region, as opposed to the full scale shown in Figure 2, under higher resolution conditions. We note that the shortest dead time that can be achieved under these conditions is about 5 sec. While the spectra still cannot resolve the ATP and ADP signals, they reveal for BmrCD a significant intensity at the 31P Larmor frequency, at the center of the doublet, corresponding to a remote weakly coupled 31P. Interestingly, this signal is practically time independent and is present neither in the MsbA nor in the free Mn2+/ATP spectra (not shown). Furthermore, the signal is missing in the high resolution spectra (not shown) for both transporters incubated with AMPPNP and is almost identical for the two transporters incubated with ADP, although being very weak compared to what obtained when incubating with ATP. As the resonance at the 31P Larmor frequency is significant only in the spectra of BmrCD it is likely associated with the degenerate nucleotide binding site, where the Mn2+ coordination sphere is different than that of the NBSs of MsbA and the consensus NBS of BmrCD. We suggest that in the degenerate NBS of BmrCD the γ-phosphate is not coordinated but is just physically close to Mn2+, such that there is a finite dipolar interaction with the Mn2+.
Figure 5. ATP turnover kinetics followed by 31P-EDNMR spectroscopy.

(A) MsbA + Mn2+/ATP, 30°C. (B) BmrCD + Mn2+/ATP, 30°C. The data are fit to a mono-exponential model (see text); fit curves (solid line), 95% confidence intervals (shaded area) and half-life (dashed line) are shown. Filled and empty symbols correspond to two different experiments to illustrate the reproducibility of the method. See also Figure S5.
The dependence of the 31P-EDNMR signal (ELDOR efficiency), S, on the reaction time could be modeled as an effective 1st order process according to:
| (1) |
where ST and SD are respectively the 31P-EDNMR signals of the systems in the pre-hydrolysis and post-hydrolysis states and k is the effective 1st order rate constant. The time course experiments reveal a considerably slower ATPase kinetics for BmrCD as compared to MsbA, with a half-life of (20.0±4.6) s for MsbA and of (46 ± 9.8) s for BmrCD; the rate constants k obtained were 0.035 ± 0.008 s−1 for MsbA and 0.015 ± 0.003 s−1 for BmrCD. This finding is in agreement with the proposed working hypothesis for the reaction mechanism of the two transporters, according to which sequence modification of a catalytic residue in the nucleotide binding domain of the BmrD monomer is expected to impair its ATPase activity relative to MsbA (Mishra et al., 2014). The samples of the two transporters have a slightly different fraction of glycerol (20% for MsbA and 22% for BmrCD, see Method Details). The difference is negligible and cannot account for the variation of the observed reaction rate between the two transporters.
We also measured the hydrolysis rate of MsbA at 37°C (Figure S5B). As expected, ATPase kinetics under these conditions was faster relative to the one measured at 30°C, yielding a rate constant of 0.068 ± 0.004 s−1, corresponding to a half-life of 10.2±0.6 s. Due to the lower stability of BmrCD, measurements at 37°C could not be carried out.
EDNMR of Vanadate Reveals Asymmetric Formation of HES in BmrCD
By performing ATP turnover in the presence of excess inorganic vanadate (Vi; see Method Details) the transporters are trapped and stabilized in the high-energy post-hydrolysis state (HES), also referred to as the transition state of ATP hydrolysis (Sharma and Davidson, 2000). To compare the Vi-trapped states of MsbA and BmrCD, we carried out W-band 31P-ENDOR measurements on the transporters incubated with Mn2+/ATP and vanadate as shown in Figure 6. Comparison with the spectra of the pre-hydrolysis and post-hydrolysis states (Figure 2) shows that for both transporters the spectrum of the HES state is equivalent to the post-hydrolysis state indicating that the phosphate coordination geometry of Mn2+ is similar to that of Mn2+/ADP. This is expected considering that ADP is the nucleotide trapped by Vi.
Figure 6. 31P-ENDOR for Mn2+/ATP turnover in the presence of excess vanadate show spectral characteristics of post-hydrolysis state.

Normalized 31P-ENDOR spectra of (A) MsbA, (B) BmrCD. The dashed identify the positions of the characteristic signals for Mn2+/ATP (See Fig. 2). See also Figure S7.
To detect the vanadate through the 51V nucleus (I = 7/2) in the proximity of the Mn2+, we carried out EDNMR measurements (Figure 7) on the HES state. The spectra of the two transporters show a 14N double quantum splitting of 2AN = 4.6 MHz (AN = 2.3 MHz), which is equivalent to the one found in both the pre-hydrolysis and post-hydrolysis states. This result, combined with the equivalence of the 31P spectra, further confirms a similar coordination geometry of Mn2+ in the HES and post-hydrolysis states.
Figure 7. EDMR in the presence of ATP and excess vanadate reveal asymmetric trapping of Vi in BmrCD NBSs.

W-band EDNMR spectra of (A), (C) MsbA-Mn2+/ADP-Vi [MsbA + Mn2+/ATP + Vi]. (B), (D) BmrCD-Mn2+/ADP-Vi [BmrCD + Mn2+/ATP + Vi]. Panels (A) and (B) show the full scans, panels (C) and (D) show details of the 14N double quantum region, the 51V/23Na single quantum region and of the 31P single quantum region. See also Figure S6.
Analysis of the 51V signal, situated around 37.5 MHz (the Larmor frequency of 51V is 37.8 MHz), shows a much stronger signal for MsbA than for BmrCD, which is consistent with the presence of two catalytically active NBSs in MsbA as compared to a single catalytic active NBS in BmrCD (Mishra et al., 2014). The 51V signal overlaps with the signal of 23Na nuclei, which has a nuclear Larmor frequency of 38.0 MHz, therefore this assignment was based on comparison with a spectrum recorded with vanadate but without protein and with protein but without vanadate (see Figures S6A, S6C and 6D). Weak contributions from natural abundance 13C (I = 1/2; Larmor frequency of 36.1 MHz) are also possible.
To rule out the possibility that the 51V signal arises from free Mn2+/ATP binding to vanadate, the EDNMR spectrum of a solution of Mn2+/ATP-Vi without transporter was measured (Figure S6). The spectrum shows a signal in the 51V/23Na region which, based on its intensity as compared to the spectrum of a solution of Mn+2/ATP without vanadate, can be assigned to interaction with 23Na. Thus, the strong 51V signal in the transporter samples confirms the binding of the Vi at the NBS.
Finally, we confirmed the inhibition of ATP turnover by Vi through time resolved 31P-EDNMR measurements to probe the ATPase activity of MsbA and BmrCD with Mn 2+/ATP at 30°C in the presence of excess vanadate (see Method Details). We found that for both transporters, ATP hydrolysis takes place very slowly (see Figure S7).
Discussion
The results presented here establish the use of W-band ENDOR and EDNMR to probe the catalytic cycles of ABC transporters upon replacement of the native, diamagnetic Mg2+ metal cofactor with the paramagnetic Mn2+. A unique structural perspective on the Mn2+ ATP/ADP binding site in MsbA and BmrCD was deduced from thorough analysis of the signal intensity and lineshape. Moreover, the high sensitivity of EDNMR and the linear relationship between its signal intensity and the number of Mn2+-coupled 31P nuclei allowed us to quantitatively follow the kinetics of ATP hydrolysis. 31P ENDOR analysis can distinguish the different types of coordinated 31P nuclei, namely the β- and γ- phosphates in Mn2+/ATP and the β phosphate for Mn2+/ADP. The 31P ENDOR lineshape was the same for both transporters and showed only subtle differences when compared to the free Mn2+/ATP (ADP). We took advantage of the high sensitivity of the ENDOR lineshape to the mode of phosphate binding to explore the effect of the addition of vanadate along with Mn2+/ATP. We found that for both transporters the spectrum was of the ADP type, namely the signal from the coordination to the γ phosphate was lost. Kinetic measurements in the presence of vanadate using EDNMR showed a substantial reduction in the rate of ATP hydrolysis.
The application of hyperfine spectroscopy led to novel mechanistic insights. EDNMR analysis of nitrogen ligation coupled with observation of 51V EDNMR revealed direct evidence of catalytic asymmetry in BmrCD. Unlike MsbA, one of the NBS sites in BmrCD is impaired by the substitution of the catalytic glutamate by an aspartate (Galián et al., 2011; Torres et al., 2009). Using DEER distance measurements of NBS conformational changes, Mishra et al. proposed that ATP hydrolysis is carried out by the intact NBS referred to as the consensus NBS (Mishra et al., 2014). In the context of their model, the finding that the intensity of the 51V EDNMR is about 50% in BmrCD relative to MsbA where both NBSs are intact suggest that only one of the NBSs of BmrCD is in the HES whereas both NBS of MsbA can be trapped simultaneously in the HES.
Insight into the state of the degenerate NBS of BmrCD was gleaned from analysis of the nitrogen ligation to the nucleotide moiety. 14N EDNMR signals of samples prepared with ATP (15N5) showed single and double-quantum 14N lines. These lines provide experimental evidence for the presence of a transporter nitrogen, directly coordinated to Mn2+ in the ADP bound state. The intensity of the 14N resonances at the early time point revealed mechanistic differences between MsbA and BmrCD. Unlike MsbA, a Mn2+/ATP is bound to BmrCD in a similar configuration to that of a Mn2+/ADP where a transporter nitrogen is coordinated to the Mn2+. We also detected a weakly coupled 31P nuclei in BmrCD, tentatively assigned to the γ -phosphate in the degenerate NBS, which is no longer coordinated to the Mn2+, consistent with the so called ADP-type binding. We propose that this coordination mode of an ATP is catalytically unproductive and may be the one responsible for impaired hydrolysis at the degenerate site of BmrCD.
Inspection of crystal structures of MalK in the HES (Lu et al., 2005) suggests the origin of the nitrogen ligand contributed by the transporter. These structures reveal that the side chain of the conserved glutamine in the Q-loop contributes an oxygen ligand to the bound Mg2+ when AMPPNP or ADP-Vi are bound while the nitrogen of the amide forms a hydrogen bond to the γ-phosphate or the bound vanadate. We propose that upon hydrolysis to ADP and the dissociation of the inorganic phosphate, the glutamine side chain switches orientation presenting the nitrogen as a ligand to the bound metal to compensate for the loss of the hydrogen bond to the γ-phosphate. In the context of the degenerate site, this change in orientation is observed already for the ATP bound state and may be coupled to the substitution of the catalytic glutamate with an aspartate. A detailed structure is needed to dissect the coordination in the Mg2+/bound conformation.
Conclusions
In this paper, we demonstrated that the application of ENDOR and EDNMR of Mn2+ to directly observe the coordination of the metal cofactor during ATP hydrolysis combined with systematic DEER analysis of conformational dynamics can address long standing mechanistic questions in the ABC transporter field. Framed in the context of previous studies, our findings in this paper support the notion that there are intrinsic catalytic differences between ABC transporters that are associated with the conformational steps in the transport cycle. Specifically, the data is consistent with the two-state model of NBD dimerization/dissociation of MsbA (Mishra et al., 2014; Ward et al., 2007; Zou et al., 2009) and provide strong support for the asymmetric hydrolysis by the ABC heterodimer BmrCD (Mishra et al., 2014). Future studies will explore ATP turnover in Pgp in order to test the proposed model of alternating ATP hydrolysis in an ABC transporter with intact consensus sequence motifs providing yet another example of mechanistic divergence in the exporter class (Verhalen et al., 2017). The spectroscopic approach introduced is not limited to ABC transporters and can be applied to a variety of systems exhibiting ATPase activities.
Contact for Reagent and Resource Sharing
Further information and requests for resources and reagents should be directed to and will be fulfilled by the Lead Contact, Hassane S. Mchaourab (hassane.mchaourab@vanderbilt.edu).
Experimental Model and Subject Details
The cysteine-less BmrCD in pET21b(+), cysteine-less MsbA in pET19b and their double mutants were expressed in Escherichia coli BL21/DE3 cells in minimal media supplemented with glycerol (0.5%), thiamin (2.5 μg/ml), ampicillin (100 μg/ml), MgSO4 (1 mM), and 50 × MEM amino acids (1 ml/l). BmrCD cultures were grown at 37 °C with shaking to an OD600 of 1.2, and the expression was induced by addition of 0.7 mM isopropyl β-D-1-thiogalactopyranoside (IPTG), followed by 5.5 hr growth at 25°C. MsbA cultures were grown at 37°C with shaking to an OD600 of 0.8–0.9, and the expression was induced by addition of 1 mM IPTG, followed by 5 hr growth at 30 °C.
Method Details
Purification and Labeling of BmrCD and MsbA
The cysteine-less BmrCD (BmrCD-WT*)(Mishra et al., 2014), cysteine-less MsbA (MsbA-WT*)(Dong et al., 2005; Smriti et al., 2009; Zou and McHaourab, 2009), hereafter referred to as BmrCD and MsbA, and their double cysteine mutants were purified by sequential nickel affinity and size-exclusion chromatography (SEC) as previously described. Double cysteine mutants of BmrCD and MsbA were incubated with a 20-fold excess of (1-Oxyl-2,2,5,5-tetramethylpyrroline-3-methyl) methanethiosulfonate (MTSSL, Enzo Life Sciences) for 4 h at 23 °C and placed on ice for ~12 h. The labeled proteins were then separated from free label by SEC on a Superdex 200 column equilibrated with respective SEC buffer. The protein concentrations were determined using an extinction coefficient of 68077 M−1 cm−1 for BmrCD and 46995 M−1 cm−1 for MsbA mutants. The composition of the buffers for MsbA and BmrCD was 50 mM HEPES, 50 mM NaCl, 0.05% α-DDM and 50 mM Tris·HCl, 150 mM NaCl, 0.05% β-DDM, 10% glycerol respectively. The MsbA and BmrCD samples used for DEER and ENDOR measurements included 30% glycerol, whereas MsbA trapped samples for EDNMR measurements had 20% glycerol and the BmrCD samples had 22 % glycerol.
Preparation of the Samples for Spectroscopic Characterization of the Pre-hydrolysis and Post-hydrolysis states
Pre-hydrolysis BmrCD and MsbA samples for ENDOR/EDNMR measurements were prepared by mixing BmrCD or MsbA with AMPPNP in the presence of MnCl2 with a final composition of 250μM protein, 150 μM AMPPNP and 150 μM MnCl2. BmrCD and MsbA samples were then incubated at 30 °C for 30 min and 37 °C for 20 min respectively. To prepare the post-hydrolysis state, AMPPNP was replaced with ATP and the reaction was stopped by flash freezing in a liquid nitrogen bath. HES and post-hydrolysis ADP samples of BmrCD and MsbA were prepared similar to pre-hydrolysis samples, but in the presence of 2 mM vanadate (Vi) and ADP respectively.
Spin-labeled HES samples (ADP-Vi [10 mM ATP]) and (ADP-Vi [0.15 mM ATP]) for DEER measurements were prepared by mixing BmrCD or MsbA with ATP, MgCl2 and Vi with a final composition of 150 μM protein, 10 mM ATP, 10 mM MgCl2, 5 mM Vi and 150 μM protein, 0.15 mM ATP, 0.25 mM MgCl2, 2 mM Vi respectively. BmrCD and MsbA samples were then incubated at 30 °C for 30 min and 37 °C for 20 min respectively. Samples for turnover DEER measurements were prepared by mixing BmrCD or MsbA with 250 μM MgCl2 and indicated concentrations of ATP for 1min. Post-hydrolysis and turnover reactions were stopped by flash freezing in a liquid nitrogen bath.
Preparation of the Samples for the Time Resolved Experiments
Samples (Mn2+/ATP or Mn2+/ADP-Vi) for the time resolved experiments were prepared by mixing solutions of MsbA or BmrCD with solutions of Mn2+/ATP or Mn2+/ATP+Vi in order to obtain a final sample composition of 200 μM protein and 150 μM Mn2+/ATP or 150 μM Mn2+/ATP, 2 mM Vi. The two solutions were mixed directly inside a 0.64 mm ID, 0.80 mm ID quartz capillary (Vitrocom, Inc.) glued to a plastic micropipette tip (Kaufmann et al., 2013). The reaction was stopped at the required time by flash freeze-quenching in a liquid nitrogen bath, and the sample capillary was kept in liquid nitrogen until the spectroscopic measurement. In order to prevent thawing of the sample while loading it into the spectrometer probehead, this operation was performed inside a liquid nitrogen bath and the cold probe was quickly transferred into the pre-cooled cryostat. Some measurements were carried out with 15N enriched ATP (Sigma).
Spectroscopic Measurements
DEER Spectroscopy
DEER spectroscopy was performed on an Elexsys E580 EPR spectrometer operating at Q-band frequency (33.9 GHz)(Jeschke, 2012) equipped with a 10W Amp-Q amplifier (Bruker) with the dead-time free four-pulse sequence at 83 K (Jeschke and Polyhach, 2007). The pulse lengths were 10 ns (π/2) and 20 ns (π) for the probe pulses and 40 ns for the pump pulse. The frequency separation was 63 MHz. Raw DEER decays were analyzed as described previously (Mishra et al., 2014).
ENDOR Spectroscopy
ENDOR measurements were performed on a home-built W-band (94.9 GHz) spectrometer (Goldfarb et al., 2008; Mentink-Vigier et al., 2013) at a temperature of 10 K; for all the experiments the magnetic field was set at the center of the |mS, mI> = |−1/2, −3/2> ➔ |+1/2, −3/2> line (second peak of the 55Mn (I = 5/2) hyperfine sextet) at 3.374 T (νL(1H) = 143.65 MHz). The standard Davies ENDOR sequence πmw – T – tRF – T – π/2mw – τ – πmw – τ – echo(Davies, 1974) was used, in which the echo intensity is monitored as a function of the RF (radio frequency). The RF was swept from 50.7 MHz to 66.7 MHz in steps of 50 kHz using random acquisition in order to reduce artifacts coming from sample heating or incomplete nuclear relaxation (Epel et al., 2003).
The microwave (mw) pulse lengths were set to π/2mw = 100 ns, πmw = 200 ns and the RF pulse length (tRF) was set to 50 μs. Even though this setting resulted in a slightly suboptimal inversion of the nuclear polarization, due to 5% duty cycle limitation for the RF amplifier it was the longest RF pulse that allowed avoiding increasing the shot repetition time beyond its optimal value of 1 msec. The T delay, added in order to prevent overlap between the ring-down phenomena following the pulses, was set to T = 1 μs; the delay for the Hahn echo generation sequence was set to τ = 1 μs. The pulse sequence was supplemented with echo train acquisition in order to increase the sensitivity (Mentink-Vigier et al., 2013).
The experiments were recorded as a series of time domain traces of the echo profile for each RF value; subsequent integration along the time dimension to yield the 1D spectra was performed keeping the same parameters for all the samples to allow for comparison of the lineshape.
EDNMR Spectroscopy
EDNMR experiments were performed at 10 K at the same magnetic field at which 31P-ENDOR experiments were carried out. The standard EDNMR sequence HTAmw,2 – T – π/2mw,1 – τ – πmw,1 – τ – echo (Schosseler et al., 1994) was used, in which the echo intensity generated at the microwave frequency ν1 = 94.9 GHz (central frequency of the resonant mode of the cavity) is monitored as the frequency ν2 of the high turning angle (HTA) pulse is varied. The delay T between the HTA pulse and the echo detection sequence was set to 2 μs, the detection microwave pulse lengths were set to π/2mw,1 = 100 ns, πmw,1 = 200 ns, the delay τ for the Hahn echo generation sequence was set to 1 μs, and the shot repetition time was set to 1 ms. The pulse sequence was supplemented with echo train acquisition in order to increase the sensitivity (Mentink-Vigier et al., 2013). Random acquisition with respect to the frequency of the HTA pulse was used.
Optimization of the power and length of the HTA pulse in terms of spectral resolution for the 31P resonances yielded a length of 50 μs and a MW irradiation amplitude of ω1/2π = 2.22 MHz at 94.9 GHz, corresponding to π = 75 ns for the mS = −1/2 ➔ +1/2 transition of Mn2+. For a resonator having a bandwidth of 93 MHz (at half maximum) centered around 94.9 GHz (QL = 1022), this corresponds to ω1/2π = 1.04 MHz at the center of the 31P region, which has a 58.2 MHz offset with respect to the resonator center. These same settings were also used for the full EDNMR scans. For EDNMR spectroscopy of the 14N/15N region a length of the HTA pulse of 100 μs and a MW irradiation amplitude of ω1/2π = 0.83 MHz at 94.9 GHz, corresponding to π = 200 ns for the mS = −1/2 ➔ +1/2 transition of Mn2+, were found to be the optimal parameters.
For 31P scans the frequency ν2 was swept from 94.9507 GHz to 94.9667 GHz, corresponding to a frequency offset with respect to ν1, Δν, of 50.7 MHz to 66.7 MHz, in 50 kHz steps; in order to enhance resolution the echoes were integrated using 1.12 μs gates centered at the maxima. For 14N/15N scans the frequency ν2 was swept from 94.90 GHz to 94.93 GHz, corresponding to a frequency offset with respect to ν1, Δν, of 0 MHz to 30 MHz, in 50 kHz steps; the required resolution was achieved integrating the echoes using 1.2 μs gates centered at the maxima. For full scans ν2 was swept from 94.9 GHz to 95.06 GHz, corresponding to Δν = 0 MHz to 160 MHz, in 100 kHz steps; in this case a compromise between resolution and SNR led to the choice of integrating the echoes using 0.64 μs gates centered at the maxima. As for 31P-ENDOR, the EDNMR experiments were recorded as a series of time domain traces of the echo profile for each frequency of the HTA pulse; subsequent integration along the time dimension to yield the 1D spectra was performed keeping the same parameters for all the samples. The details on the evaluation the ELDOR efficiency are reported in the Supporting Information.
In this work we used the EDNMR effect to follow the reaction kinetics. We note that a difference in the ENDOR effect was detected as well, and in principle it could have been also used to determine the rate of hydrolysis. The ENDOR effect has been used to derive information such as binding constants (Potapov and Goldfarb, 2006) and number of ligands (Raitsimring et al., 2006). However, such experiments are quite demanding technically and require very careful and reproducible adjustment of the experimental parameters, which in the case of Davies ENDOR involve the inversion efficiency of the RF pulse and of the first microwave π pulse. This makes the ENDOR effect in Davies ENDOR more prone to error compared to EDNMR, where one has to control only the HTA pulse. Moreover, as the sensitivity of the EDNMR experiment is higher, it is more efficient in terms of data accumulation time and SNR (signal-to-noise) considerations.
ATP turnover Assay
The specific ATPase activity of BmrCD and MsbA was determined as previously described (Mishra et al., 2014; Smriti et al., 2009) with the following modifications. Briefly, BmrCD (20 μg), and MsbA (1 μg) samples in detergent micelles were incubated with increasing concentrations of ATP in presence of 10 mM MnCl2 or MgCl2 at 30 °C for 30 min and at 37 °C for 20 min respectively. The reaction was stopped by adding 1 volume of 12% SDS and the color was developed using a 1:1 solution of ammonium molybdate (2% in 1M HCl) and ascorbic acid (12% in 1M HCl). The absorbance of samples was measured at a wavelength of 850 nm on a BioTek Synergy H4 microplate reader. The amount of phosphate released was determined by comparison to inorganic phosphate standards. Vmax and Km values for BmrCD-WT* and MsbA-WT* ATPase activity were derived from the average of three independent measurements using the Levenberg-Marquart nonlinear least squares fitting approach in Origin software (OriginLab, Inc). Parameters are reported with the associated standard error of the fit.
Supplementary Material
Highlights.
Detection of ATP hydrolysis by hyperfine selective EPR of Mn2+
Different coordination of ATP by MsbA and BmrCD
Detection of vanadate reveals asymmetric hydrolysis of ATP
Acknowledgments
We acknowledge Dr. Richard Stein for running DEER samples. The authors thank Drs. Richard Stein, Derek Claxton and Reza Dastvan for critical reading of the manuscript. This work was supported by grant U54-087519 (Membrane Protein Structural Dynamics Consortium) from the NIGMS, NIH to HSM and DG. The historic generosity of the Harold Perlman Family (D. G.). D. G. holds the Erich Klieger Professorial Chair in Chemical Physics.
Footnotes
Publisher's Disclaimer: This is a PDF file of an unedited manuscript that has been accepted for publication. As a service to our customers we are providing this early version of the manuscript. The manuscript will undergo copyediting, typesetting, and review of the resulting proof before it is published in its final citable form. Please note that during the production process errors may be discovered which could affect the content, and all legal disclaimers that apply to the journal pertain.
Author Contributions
A.C., S.M., A.L., H.M. and D.G: experimental design. S.M: expression, ATPase activity, purification and DEER spectroscopy experiments. A.C. and A.L: ENDOR and EDNMR spectroscopy experiments. A.C., S.M., A.L., H.M. and D.G: data analysis. H.M. and D.G. oversaw all aspects of the experiments and manuscript preparation. All authors participated in interpreting the data and writing the paper.
References
- Banerjee D, Paniagua JC, Mugnaini V, Veciana J, Feintuch A, Pons M, Goldfarb D. Correlation of the EPR properties of perchlorotriphenylmethyl radicals and their efficiency as DNP polarizers. Physical Chemistry Chemical Physics. 2011;13:18626–18637. doi: 10.1039/c1cp21970g. [DOI] [PubMed] [Google Scholar]
- Borbat PP, Surendhran K, Bortolus M, Zou P, Freed JH, McHaourab HS. Conformational motion of the ABC transporter MsbA induced by ATP hydrolysis. PLoS biology. 2007;5:e271. doi: 10.1371/journal.pbio.0050271. [DOI] [PMC free article] [PubMed] [Google Scholar]
- Bruch EM, Warner MT, Thomine S, Tabares LC, Un S. Pulse Electron Double Resonance Detected Multinuclear NMR Spectra of Distant and Low Sensitivity Nuclei and Its Application to the Structure of Mn(II) Centers in Organisms. The journal of physical chemistry B. 2015;119:13515–13523. doi: 10.1021/acs.jpcb.5b01624. [DOI] [PubMed] [Google Scholar]
- Cox N, Lubitz W, Savitsky A. W-band ELDOR-detected NMR (EDNMR) spectroscopy as a versatile technique for the characterisation of transition metal-ligand interactions. Molecular Physics. 2013;111:2788–2808. [Google Scholar]
- Cox N, Nalepa A, Pandelia ME, Lubitz W, Savitsky A. Pulse Double-Resonance EPR Techniques for the Study of Metallobiomolecules. Methods in enzymology. 2015;563:211–249. doi: 10.1016/bs.mie.2015.08.016. [DOI] [PubMed] [Google Scholar]
- Davies ER. NEW PULSE ENDOR TECHNIQUE. Physics Letters A A. 1974;47:1–2. [Google Scholar]
- Dong J, Yang G, McHaourab HS. Structural basis of energy transduction in the transport cycle of MsbA. Science. 2005;308:1023–1028. doi: 10.1126/science.1106592. [DOI] [PubMed] [Google Scholar]
- Epel B, Arieli D, Baute D, Goldfarb D. Improving W-band pulsed ENDOR sensitivity-random acquisition and pulsed special TRIPLE. Journal of magnetic resonance. 2003;164:78–83. doi: 10.1016/s1090-7807(03)00191-5. [DOI] [PubMed] [Google Scholar]
- Fittipaldi M, Garcia-Rubio I, Trandafir F, Gromov I, Schweiger A, Bouwen A, Van Doorslaer S. A multi-frequency pulse EPR and ENDOR approach to study strongly coupled nuclei in frozen solutions of high-spin ferric heme proteins. Journal of Physical Chemistry B. 2008;112:3859–3870. doi: 10.1021/jp709854x. [DOI] [PubMed] [Google Scholar]
- Florent M, Kaminker I, Nagarajan V, Goldfarb D. Determination of the N-14 quadrupole coupling constant of nitroxide spin probes by W-band ELDOR-detected NMR. Journal of magnetic resonance. 2011;210:192–199. doi: 10.1016/j.jmr.2011.03.005. [DOI] [PubMed] [Google Scholar]
- Galian C, Manon F, Dezi M, Torres C, Ebel C, Levy D, Jault JM. Optimized purification of a heterodimeric ABC transporter in a highly stable form amenable to 2-D crystallization. PLoS One. 2011;6:e19677. doi: 10.1371/journal.pone.0019677. [DOI] [PMC free article] [PubMed] [Google Scholar]
- Galián C, Manon F, Dezi M, Torres C, Ebel C, Levy D, Jault JM. Optimized purification of a heterodimeric ABC transporter in a highly stable form amenable to 2-D crystallization. PLoS One. 2011;6:e19677. doi: 10.1371/journal.pone.0019677. [DOI] [PMC free article] [PubMed] [Google Scholar]
- George AM, Jones PM. Perspectives on the structure-function of ABC transporters: the Switch and Constant Contact models. Progress in biophysics and molecular biology. 2012;109:95–107. doi: 10.1016/j.pbiomolbio.2012.06.003. [DOI] [PubMed] [Google Scholar]
- Goldfarb D, Lipkin Y, Potapov A, Gorodetsky Y, Epel B, Raitsimring AM, Radoul M, Kaminker I. HYSCORE and DEER with an upgraded 95 GHz pulse EPR spectrometer. Journal of magnetic resonance. 2008;194:8–15. doi: 10.1016/j.jmr.2008.05.019. [DOI] [PubMed] [Google Scholar]
- Higgins CF, Linton KJ. The ATP switch model for ABC transporters. Nat Struct Mol Biol. 2004;11:918–926. doi: 10.1038/nsmb836. [DOI] [PubMed] [Google Scholar]
- Himes RH, Cohn M. Formyltetrahydrofolate synthetase. Magnetic resonance studies of the reaction. The Journal of biological chemistry. 1967;242:3628–3635. [PubMed] [Google Scholar]
- Jeschke G. DEER distance measurements on proteins. Annu Rev Phys Chem. 2012;63:419–446. doi: 10.1146/annurev-physchem-032511-143716. [DOI] [PubMed] [Google Scholar]
- Jeschke G, Polyhach Y. Distance measurements on spin-labelled biomacromolecules by pulsed electron paramagnetic resonance. Physical chemistry chemical physics: PCCP. 2007;9:1895–1910. doi: 10.1039/b614920k. [DOI] [PubMed] [Google Scholar]
- Kaminker I, Goldberg H, Neumann R, Goldfarb D. High-Field Pulsed EPR Spectroscopy for the Speciation of the Reduced PV2Mo10O40 (6-) Polyoxometalate Catalyst Used in Electron-Transfer Oxidations. Chemistry-a European Journal. 2010;16:10014–10020. doi: 10.1002/chem.201000944. [DOI] [PubMed] [Google Scholar]
- Kaminker I, Sushenko A, Potapov A, Daube S, Akabayov B, Sagi I, Goldfarb D. Probing Conformational Variations at the ATPase Site of the RNA Helicase DbpA by High-Field Electron-Nuclear Double Resonance Spectroscopy. Journal of the American Chemical Society. 2011;133:15514–15523. doi: 10.1021/ja204291d. [DOI] [PubMed] [Google Scholar]
- Kaminker I, Wilson TD, Savelieff MG, Hovav Y, Zimmermann H, Lu Y, Goldfarb D. Correlating nuclear frequencies by two-dimensional ELDOR-detected NMR spectroscopy. Journal of magnetic resonance. 2014;240:77–89. doi: 10.1016/j.jmr.2013.12.016. [DOI] [PubMed] [Google Scholar]
- Kaufmann R, Yadid I, Goldfarb D. A novel microfluidic rapid freeze-quench device for trapping reactions intermediates for high field EPR analysis. Journal of magnetic resonance. 2013;230:220–226. doi: 10.1016/j.jmr.2013.01.016. [DOI] [PubMed] [Google Scholar]
- Klein EL, Raitsimring AM, Astashkin AV, Rajapakshe A, Johnson-Winters K, Arnold AR, Potapov A, Goldfarb D, Enemark JH. Identity of the Exchangeable Sulfur-Containing Ligand at the Mo(V) Center of R160Q Human Sulfite Oxidase. Inorganic Chemistry. 2012;51:1408–1418. doi: 10.1021/ic201643t. [DOI] [PMC free article] [PubMed] [Google Scholar]
- Kulik L, Epel B, Messinger J, Lubitz W. Pulse EPR, Mn-55-ENDOR and ELDOR-detected NMR of the S-2-state of the oxygen evolving complex in Photosystem II. Photosynthesis Research. 2005;84:347–353. doi: 10.1007/s11120-005-2438-7. [DOI] [PubMed] [Google Scholar]
- Locher KP. Mechanistic diversity in ATP-binding cassette (ABC) transporters. Nat Struct Mol Biol. 2016;23:487–493. doi: 10.1038/nsmb.3216. [DOI] [PubMed] [Google Scholar]
- Lu G, Westbrooks JM, Davidson AL, Chen J. ATP hydrolysis is required to reset the ATP-binding cassette dimer into the resting-state conformation. Proc Natl Acad Sci U S A. 2005;102:17969–17974. doi: 10.1073/pnas.0506039102. [DOI] [PMC free article] [PubMed] [Google Scholar]
- Mayer MP, Bukau B. Hsp70 chaperones: cellular functions and molecular mechanism. Cellular and molecular life sciences: CMLS. 2005;62:670–684. doi: 10.1007/s00018-004-4464-6. [DOI] [PMC free article] [PubMed] [Google Scholar]
- McHaourab HS, Steed PR, Kazmier K. Toward the fourth dimension of membrane protein structure: insight into dynamics from spin-labeling EPR spectroscopy. Structure. 2011;19:1549–1561. doi: 10.1016/j.str.2011.10.009. [DOI] [PMC free article] [PubMed] [Google Scholar]
- Mentink-Vigier F, Collauto A, Feintuch A, Kaminker I, Tarle V, Goldfarb D. Increasing sensitivity of pulse EPR experiments using echo train detection schemes. J Magn Reson. 2013;236:117–125. doi: 10.1016/j.jmr.2013.08.012. [DOI] [PubMed] [Google Scholar]
- Mino H, Ono T. Applications of pulsed ELDOR-detected NMR measurements to studies of photosystem II: Magnetic characterization of Y-D tyrosine radical and Mn2+ bound to the high-affinity site. Appl Magn Reson. 2003;23:571–583. [Google Scholar]
- Mishra S, Verhalen B, Stein RA, Wen PC, Tajkhorshid E, McHaourab HS. Conformational dynamics of the nucleotide binding domains and the power stroke of a heterodimeric ABC transporter. eLife. 2014;3:e02740. doi: 10.7554/eLife.02740. [DOI] [PMC free article] [PubMed] [Google Scholar]
- Nalepa A, Moebius K, Lubitz W, Savitsky A. High-field ELDOR-detected NMR study of a nitroxide radical in disordered solids: Towards characterization of heterogeneity of microenvironments in spin-labeled systems. Journal of magnetic resonance. 2014;242:203–213. doi: 10.1016/j.jmr.2014.02.026. [DOI] [PubMed] [Google Scholar]
- Oldham ML, Chen J. Snapshots of the maltose transporter during ATP hydrolysis. Proc Natl Acad Sci U S A. 2011;108:15152–15156. doi: 10.1073/pnas.1108858108. [DOI] [PMC free article] [PubMed] [Google Scholar]
- Potapov A, Goldfarb D. Quantitative characterization of the Mn2+ complexes of ADP and ATP gamma S by W-band ENDOR. Appl Magn Reson. 2006;30:461–472. [Google Scholar]
- Potapov A, Lancaster KM, Richards JH, Gray HB, Goldfarb D. Spin Delocalization Over Type Zero Copper. Inorganic Chemistry. 2012;51:4066–4075. doi: 10.1021/ic202336m. [DOI] [PMC free article] [PubMed] [Google Scholar]
- Prabu JR, Muller M, Thomae AW, Schussler S, Bonneau F, Becker PB, Conti E. Structure of the RNA Helicase MLE Reveals the Molecular Mechanisms for Uridine Specificity and RNA-ATP Coupling. Molecular cell. 2015;60:487–499. doi: 10.1016/j.molcel.2015.10.011. [DOI] [PubMed] [Google Scholar]
- Pyle AM. RNA helicases and remodeling proteins. Curr Opin Chem Biol. 2011;15:636–642. doi: 10.1016/j.cbpa.2011.07.019. [DOI] [PMC free article] [PubMed] [Google Scholar]
- Raitsimring AM, Astashkin AV, Baute D, Goldfarb D, Poluektov OG, Lowe MP, Zech SG, Caravan P. Determination of the hydration number of gadolinium(III) complexes by high-field pulsed 17O ENDOR spectroscopy. Chemphyschem: a European journal of chemical physics and physical chemistry. 2006;7:1590–1597. doi: 10.1002/cphc.200600138. [DOI] [PubMed] [Google Scholar]
- Rapatskiy L, Cox N, Savitsky A, Ames WM, Sander J, Nowaczyk MM, Roegner M, Boussac A, Neese F, Messinger J, et al. Detection of the Water-Binding Sites of the Oxygen-Evolving Complex of Photosystem II Using W-Band O-17 Electron-Electron Double Resonance-Detected NMR Spectroscopy. Journal of the American Chemical Society. 2012;134:16619–16634. doi: 10.1021/ja3053267. [DOI] [PubMed] [Google Scholar]
- Rees DC, Johnson E, Lewinson O. ABC transporters: the power to change. Nat Rev Mol Cell Biol. 2009;10:218–227. doi: 10.1038/nrm2646. [DOI] [PMC free article] [PubMed] [Google Scholar]
- Schosseler P, Wacker T, Schweiger A. PULSED ELDOR DETECTED NMR. Chemical Physics Letters. 1994;224:319–324. [Google Scholar]
- Sharma S, Davidson AL. Vanadate-induced trapping of nucleotides by purified maltose transport complex requires ATP hydrolysis. Journal of bacteriology. 2000;182:6570–6576. doi: 10.1128/jb.182.23.6570-6576.2000. [DOI] [PMC free article] [PubMed] [Google Scholar]
- Siarheyeva A, Liu R, Sharom FJ. Characterization of an asymmetric occluded state of P-glycoprotein with two bound nucleotides: implications for catalysis. The Journal of biological chemistry. 2010;285:7575–7586. doi: 10.1074/jbc.M109.047290. [DOI] [PMC free article] [PubMed] [Google Scholar]
- Smriti, Zou P, McHaourab HS. Mapping daunorubicin-binding Sites in the ATP-binding cassette transporter MsbA using site-specific quenching by spin labels. The Journal of biological chemistry. 2009;284:13904–13913. doi: 10.1074/jbc.M900837200. [DOI] [PMC free article] [PubMed] [Google Scholar]
- Tombline G, Senior AE. The occluded nucleotide conformation of p-glycoprotein. J Bioenerg Biomembr. 2005;37:497–500. doi: 10.1007/s10863-005-9498-4. [DOI] [PubMed] [Google Scholar]
- Torres C, Galián C, Freiberg C, Fantino JR, Jault JM. The YheI/YheH heterodimer from Bacillus subtilis is a multidrug ABC transporter. Biochimica et biophysica acta. 2009;1788:615–622. doi: 10.1016/j.bbamem.2008.12.012. [DOI] [PubMed] [Google Scholar]
- Un S. Structure and Nature of Manganese(II) Imidazole Complexes in Frozen Aqueous Solutions. Inorganic Chemistry. 2013;52:3803–3813. doi: 10.1021/ic302415s. [DOI] [PubMed] [Google Scholar]
- Un S, Bruch EM. How Bonding in Manganous Phosphates Affects their Mn(II)-P-31 Hyperfine Interactions. Inorganic Chemistry. 2015;54:10422–10428. doi: 10.1021/acs.inorgchem.5b01864. [DOI] [PubMed] [Google Scholar]
- Verhalen B, Dastvan R, Thangapandian S, Peskova Y, Koteiche HA, Nakamoto RK, Tajkhorshid E, McHaourab HS. Energy transduction and alternating access of the mammalian ABC transporter P-glycoprotein. Nature. 2017;543:738–741. doi: 10.1038/nature21414. [DOI] [PMC free article] [PubMed] [Google Scholar]
- Ward A, Reyes CL, Yu J, Roth CB, Chang G. Flexibility in the ABC transporter MsbA: Alternating access with a twist. Proc Natl Acad Sci U S A. 2007;104:19005–19010. doi: 10.1073/pnas.0709388104. [DOI] [PMC free article] [PubMed] [Google Scholar]
- Zou P, Bortolus M, Mchaourab HS. Conformational cycle of the ABC transporter MsbA in liposomes: detailed analysis using double electron-electron resonance spectroscopy. J Mol Biol. 2009;393:586–597. doi: 10.1016/j.jmb.2009.08.050. [DOI] [PMC free article] [PubMed] [Google Scholar]
- Zou P, McHaourab HS. Alternating access of the putative substrate-binding chamber in the ABC transporter MsbA. J Mol Biol. 2009;393:574–585. doi: 10.1016/j.jmb.2009.08.051. [DOI] [PMC free article] [PubMed] [Google Scholar]
Associated Data
This section collects any data citations, data availability statements, or supplementary materials included in this article.