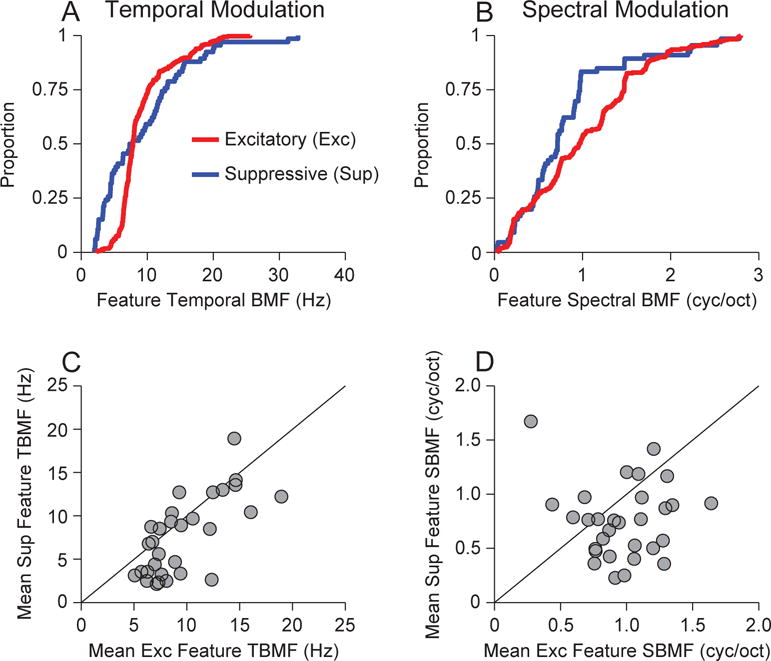
Figure 5.

Best modulation frequency for excitatory and suppressive features. (A) Population distribution of best temporal modulation frequencies (TMFs) over all features and neurons. (B) Population distribution of best spectral modulation frequencies (SMFs) over all features and neurons. (C) Mean of best TMFs for excitatory features and suppressive features. Each point represents one neuron, and the value is the mean across all best TMFs. (D) Mean of best SMFs for excitatory and suppressive features.
