Abstract
Precision medicine aims to predict a patient’s disease risk and best therapeutic options by using that individual’s genetic sequencing data. The Critical Assessment of Genome Interpretation (CAGI) is a community experiment consisting of genotype-phenotype prediction challenges; participants build models, undergo assessment, and share key findings. For CAGI 4, three challenges involved using exome sequencing data: bipolar disorder, Crohn’s disease, and warfarin dosing. Previous CAGI challenges included prior versions of the Crohn’s disease challenge. Here, we discuss the range of techniques used for phenotype prediction and discuss the methods used for assessing predictive models. Additionally, we outline some of the difficulties associated with making predictions and evaluating them. The lessons learned from the exome challenges can be applied to both research and clinical efforts to improve phenotype prediction from genotype. In addition, these challenges serve as a vehicle for sharing clinical and research exome data in a secure manner with scientists who have a broad range of expertise, contributing to a collaborative effort to advance our understanding of genotype-phenotype relationships.
Keywords: exomes, phenotype prediction, machine learning, Crohn’s disease, bipolar disorder, warfarin
Introduction
Precision medicine aims to use a patient’s genomic and clinical data to make predictions about medically relevant phenotypes such as disease risk or drug efficacy (Ashley, 2015; Ashley, et al., 2010).
The Critical Assessment of Genome Interpretation (CAGI) is a community experiment, which aims to advance methods for phenotype prediction from genotypes through a series of “challenges” with real data (CAGI, 2011). Exome sequencing data, which captures exons and nearby flanking regulatory regions, is already being used clinically to solve medical mysteries with well-defined symptoms (Brown and Meloche, 2016). However, in order to advance precision medicine, clinicians and scientists will need to be able to make inferences about disease risk or drug efficacy from genetic data. Interpretation of genetic data is one of the major difficulties in the implementation of precision medicine (Fernald, et al., 2011).
CAGI is an example of the Common Task Framework, a phrase coined by Mark Liberman to describe the approach of using shared training and testing datasets and evaluation metrics to advance machine learning (Committee on Applied and Theoretical Statistics; Board on Mathematical Sciences and Their Applications; Division on Engineering and Physical Sciences; National Academies of Sciences, 2016; Donoho, 2015). The Common Task Framework has been called the ‘secret sauce’ behind the recent successes in machine learning (Donoho, 2015). Starting with common task challenges in the 1980’s for machine translation, this approach has led to significant gains in speech recognition and dialog systems, protein structure prediction, biomedical natural language processing, autonomous vehicles, and collaborative filtering for consumer preferences (Bell and Koren, 2007; Morgan, et al., 2008; Moult, et al., 2014; Thrun, et al., 2006; Walker, et al., 2001). Through this same approach, CAGI aims to push forward the field of precision medicine.
At CAGI 4 held in 2016, three challenges involved making predictions using exome sequence data: a Crohn’s disease challenge, a bipolar disorder, and a warfarin dosing challenge. These challenges represent the spectrum of phenotypes seen in clinical practice. Bipolar disorder and Crohn’s disease are discrete phenotypes, with the former being a clinical diagnosis (based on meeting clinical criteria) and the latter a pathological diagnosis (based on biopsies). Therapeutic warfarin dose, on the other hand, is a continuous phenotype.
The Crohn’s disease challenge has been a part of previous CAGI iterations, while the warfarin dosing and bipolar disorder challenges debuted during CAGI 4. We will describe the nature of each challenge in greater detail. The number of groups participating in each challenge can be found in Table 1.
Table 1.
The number of predictors and predictions for each CAGI challenge.
| Challenge | Number of predictors |
Number of Predictions |
|---|---|---|
|
| ||
| Crohn’s Disease Exomes Challenge | CAGI 2 – 10 groups | CAGI 2 – 33 predictions |
| CAGI 3 – 14 groups | CAGI 3 – 58 (+3 late) predictions | |
| CAGI 4 – 14 groups | CAGI 4 – 46 predictions | |
|
| ||
| Bipolar Exomes Challenge | CAGI 4 – 9 groups | CAGI 4 – 29 predictions |
|
| ||
| Warfarin Exomes Challenge | CAGI 4 – 3 groups | CAGI 4– 9 predictions |
Crohn’s Disease Challenge
Crohn’s disease is a chronic inflammatory bowel disease marked by transmural inflammation of the gastrointestinal tract that can occur anywhere from the mouth to the rectum (Cho, 2008). Symptoms include pain and debilitating diarrhea, which can lead to malnutrition (Cho, 2008). Monozygotic twin studies have shown a concordance of 40–50%, and genomewide association studies have identified genetic risk loci (Cho, 2008; Halfvarson, et al., 2003). Age of onset is typically between 20–40 years old, but early age of onset, such as in early childhood is associated with more severe disease features (Uhlig, et al., 2014).
The 2011 (CAGI 2) dataset has 56 exomes (42 cases, 14 controls), all of German ancestry (Ellinghaus, et al., 2013). The 2013 (CAGI 3) dataset has 66 exomes (51 cases, 15 controls). Though these samples were also of German ancestry; cases were selected from pedigrees of German families with multiple occurrences of Crohn’s disease. As such, some of these cases were related. For the most part, the samples sequenced as controls were unrelated healthy individuals; the exceptions to this were the unaffected parents of three cases and the unaffected twin of one case. The most recent challenge, CAGI 4 in 2016, was to identify cases from controls in 111 unrelated German ancestry exomes (64 cases, 47 controls). For CAGI 4, submitting groups were allowed to use the data from the Crohn’s disease CAGI challenges of 2011 and 2013. In all iterations of the challenge, groups were asked to report a probability of Crohn’s disease (between 0 to 1) for each individual and a standard deviation representing their confidence in that prediction. For the most recent Crohn’s disease evaluation, teams were also asked to predict if age of onset was greater or less than age 10; an age cutoff selected by CAGI based on the literature (Uhlig, et al., 2014). Additional details of the CAGI 4 challenge can be found under Supplementary Exhibit 1.
Bipolar Disorder Challenge
Bipolar disorder is a mood disorder marked by elevated mood (mania or hypomania) and depressed mood that disrupts an individual’s ability to function (Craddock and Sklar, 2013). In the general population, the lifetime risk of bipolar disorder is 0.5–1% (Craddock and Jones, 1999). However, bipolar disorder has a high component of heritability, with studies demonstrating a 40–70% monozygotic twin concordance (Craddock and Jones, 1999). In this CAGI 4 challenge, 1000 exomes of unrelated bipolar disorder cases and age/ancestry-matched controls of Northern European ancestry were provided. 500 exomes were used as the training set and 500 exomes were for the prediction set (Monson, et al., 2017). Groups were asked to report a probability of bipolar disorder (between 0 to 1) for each individual and a standard deviation representing their confidence in that prediction. Additional information on the challenge can be found under Supplementary Exhibit 2.
Warfarin Dosing Challenge
Warfarin is an anticoagulant with over 30 million prescriptions written in 2011 (IMS, 2012). Warfarin remains a clinical staple despite the introduction of novel oral anticoagulants because of multiple factors – warfarin’s lower cost, longer half life, and clinical indications for which novel oral anticoagulants have not yet been approved (Bauer, 2011). However, warfarin is responsible for one third of hospitalizations due to adverse drug events because of its narrow therapeutic index and high inter-individual dose variability (Budnitz, et al., 2011). Both clinical and genetic factors affect the therapeutic dose of warfarin (Klein, et al., 2009). For this challenge, participants were provided with exomes of African Americans on tail ends of the warfarin dose distribution (≤ 35 mg or ≥ 49 mg) (Daneshjou, et al., 2014). Clinical covariates were provided for all exomes. The training set consisted of 50 exomes, and participants submitted dose predictions with standard deviations on 53 test set exomes. Additional details of the challenge can be found under Supplementary Exhibit 3.
Methods
Data Distribution
Data was distributed to the participants who consented to the CAGI data use agreement. Data providers worked with their home institution to ensure adherence with local privacy regulations and predicting groups agreed not to share the anonymized data. Data was provided as described above, with genetic variant data shared in the VCF file format.
Predicting Phenotypes
Predicting groups were required to return a simple text file with appropriate predicted values (such as disease status and confidence in prediction) for each sample. They were also provided with a validation script to check their output formatting. Submitting groups were asked to submit a methods description for each submission. The prediction results from selected groups that submitted predictions and methods descriptions were presented at the CAGI meeting. Additionally, the ground truth data and scoring scripts used to perform the evaluation were shared with participants.
Data Quality
For the Crohn’s disease and bipolar disorder exome challenges, biases in the data were assessed using principal component analysis and clustering after pruning for linkage disequilibrium using plink (Purcell, et al., 2007).
For the warfarin challenge, data had previously undergone QC using ancestry informative markers to confirm self-reported ancestry and identity by State (IBS) analysis in order to ensure that samples were not related, as previously described (Daneshjou, et al., 2014).
Assessing Discrete Phenotypes (Crohn’s Disease and Bipolar Disorder)
A simple accuracy of prediction per sample score, such as derivable from setting a threshold for prediction (such as 0.5), although tantalizing in its simplicity neither supports the goals of CAGI nor is it representative of a likely clinically relevant scenario for prediction. Because the genetic datasets from CAGI are drawn from case-control studies, as well as pedigree studies in families with a strong burden of disease, it does not represent a random sampling of the population. Requiring a fixed threshold for evaluation and reporting a basic accuracy score of prediction in such a dataset would obscure interpretation. Also, using this as a figure of merit for ranking encourages participants to optimize their system predictions for the anticipated case/control distribution instead of focusing on features that selectively prioritize and rank disease likelihood in the absence of that calibration. The use of Receiver Operator Characteristics (ROC) curves for genomic test evaluation has been previously investigated by Wray et, al (Wray, et al., 2010).
The ROC offers many advantages for evaluating a test, and is often used to characterize clinical tests. The shape of a ROC curve can help differentiate between highly sensitive tests, which could rule in a possible diagnosis, and highly specific tests that could rule out a diagnosis. The prediction of Crohn’s disease status from sequencing data might be used in either of those situations depending on clinical presentation, risk factors, or stage of patient evaluation. Additionally, ROC curves allow easy selection of a classification threshold (based on selecting a position on the curve). Based on the selected threshold, a positive or negative likelihood ratio can be derived and applied in standard evidence based techniques of patient diagnosis, which rely on a Bayesian framework that takes into account the pre-test probabilities and the characteristics of a given test depending on the threshold chosen for prediction (Fagan, 1975).
Additionally, we evaluated the robustness of the prediction accuracy when making predictions on different subsamples of exomes and assessed the confidence intervals reported by the participants.
To capture confidence intervals on the predictions, multiple samples with replacement were drawn. Each prediction was then modified by adding a random amount drawn from a normal distribution with a mean of zero and a standard deviation equivalent to the standard deviation reported for the original prediction. If no confidence interval was reported for the original prediction, the standard deviation was taken to be zero. If a prediction for a particular exome was missing, the prediction score for that sample was set to the mean reported prediction value in that submission. In order to compare submissions by a single figure of merit, the average area under the ROC curves from the bootstrap sampling was used, accompanied by the bootstrapped confidence interval around that area under the curve, to estimate the robustness of differences between prediction performances. The evaluation scripts were provided to all participants.
A cross-validated logistic regression based meta-classifier using lasso regularization was also trained on the submissions as features for CAGI 4 Crohn’s disease and CAGI 4 bipolar disorder. This step allowed us to assess whether combining the features selected across the different groups would improve prediction over a single method. The meta-classifier could perform better than any single method if the different methods use significantly different predictive features.
Assessing Continuous Phenotypes (Therapeutic Warfarin Dose)
For the warfarin exomes challenge, several metrics of assessment were used. Each participant provided a predicted therapeutc dose of warfarin for each individual as well as a standard deviation for that prediction.
To look at the amount of variation in dose explained by the predicted doses, we used linear regression with the linear model function (lm) in the R statistical package (v 2.15.3). We evaluated each method using the R2 and the sum of squared errors. Additionally, we compared each prediction against one of the best performing warfarin predictive algorithms, the International Warfarin Pharmacogenetic Consortium (IWPC) algorithm (Klein, et al., 2009).
To assess, on average, how many participant-provided standard deviations the predicted dose was from the actual dose, we used a mean of the absolute value of the z-score for each prediction, as seen in equation 1. Here, dose_actual is the known therapeutic dose of warfarin for each individual i, while dose_predicted is the therapeutic dose predicted by that group for that individual. SD_predicted is the standard deviation for each individual’s predicted dose, as provided by the participant’s prediction method. The number of individuals is n.
| Equation 1 |
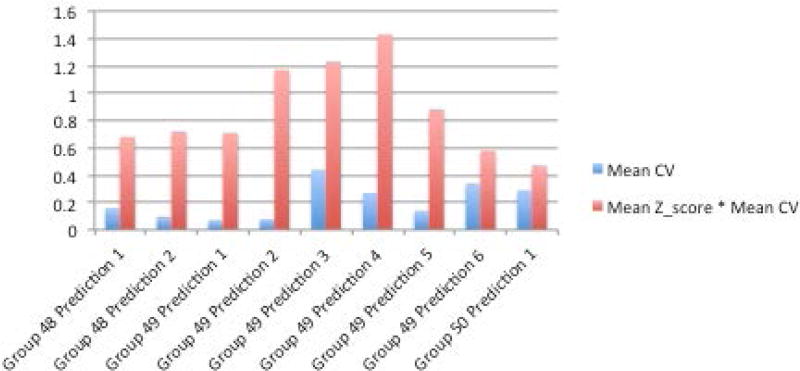
To assess the range of the each prediction’s standard deviation compared to the predicted dose, we calculated the mean of the coefficient of variation, which was the mean of the standard deviation for each prediction divided by the predicted dose, as seen in equation 2.
| Equation 2 |
We also evaluated the mean absolute value of the z-score multiplied by the mean coefficient of variation for each method. This value allowed us to assess the mean z-scores with a penalization for mean z-scores whose values were closer to 0 because of larger standard deviations.
Additionally, we calculated rho and p-values using the spearman rank correlation between 1) each group’s predicted warfarin doses and the actual therapeutic doses across individuals and 2) each group’s predicted warfarin doses and the IWPC predicted doses across individuals. These calculations were made with the spearmanr command from the stat package in scipy (python v 2.7.5).
Results
With each year, CAGI has expanded the number of challenges and participants. Table 1 displays the number of participants and predictions for each CAGI challenge.
Crohn’s Disease Exomes Challenge (CAGI 2–4)
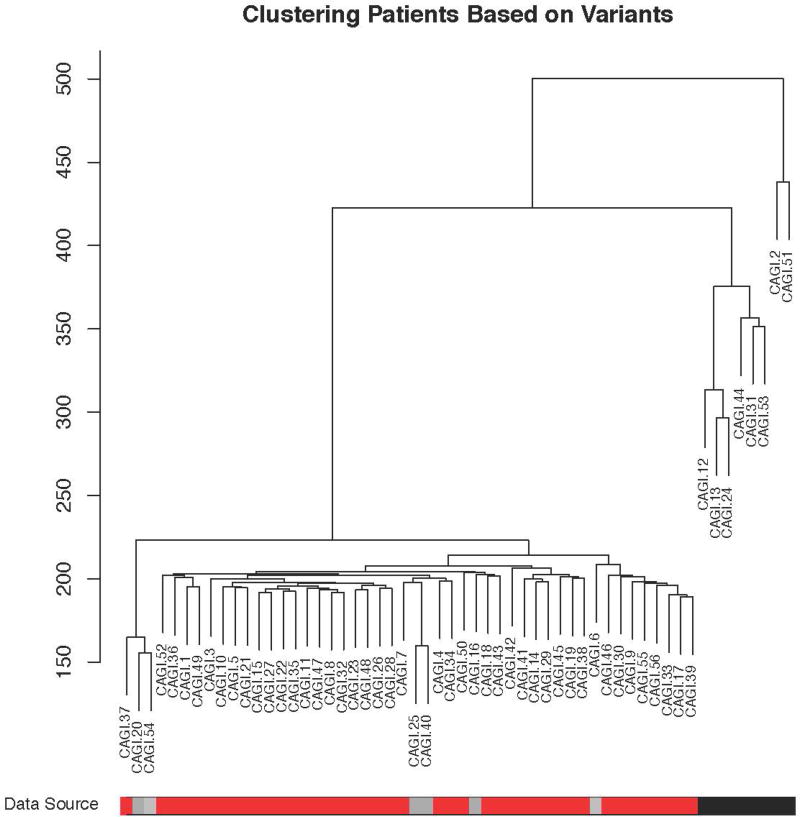
For the 2011 Crohn’s disease (CAGI 2) challenge, during the assessment phase, a substantial batch effect was discovered in the data as a side effect of sample preparation and sequencing (Figure 1). Overall, the control samples that clustered separately due to this batch effect had overall fewer variants reported that did not match the reference genome. The participants were not aware of this batch effect; their methods were not designed to exploit it. However, this raises the possibility that techniques that used a very large list of genes were more likely to correctly identify case samples as coming from individuals with Crohn’s disease. Indeed, many different methods did better than random based on AUC, with a maximum AUC of 0.94, and in general approaches that favored a large list of potentially Crohn’s disease related genes and gave more weight to rarer variants did the best. A full description of all methods used by the participants can be found in the supplement under Exhibit 1:CAGI 2. Supplemental File 1 shows comparative results of the CAGI 2 Crohn’s disease challenge predictive methods. It is certainly biologically plausible that increased burden of variation in a large number of Crohn’s disease related genes leads to increased likelihood of disease; however, it is also possible that there was systematic over reporting of variation as a batch effect. Therefore, it was important to re-evaluate with more data.
Figure 1.
Clustering of patients from the CAGI 2 Crohn’s Disease Challenge. The black and gray bars at the bottom represent the controls; the red represents the cases. Many of the controls cluster together, likely due to batch effects. For instance, the controls represented in black were sequenced separately from the gray controls and the cases.
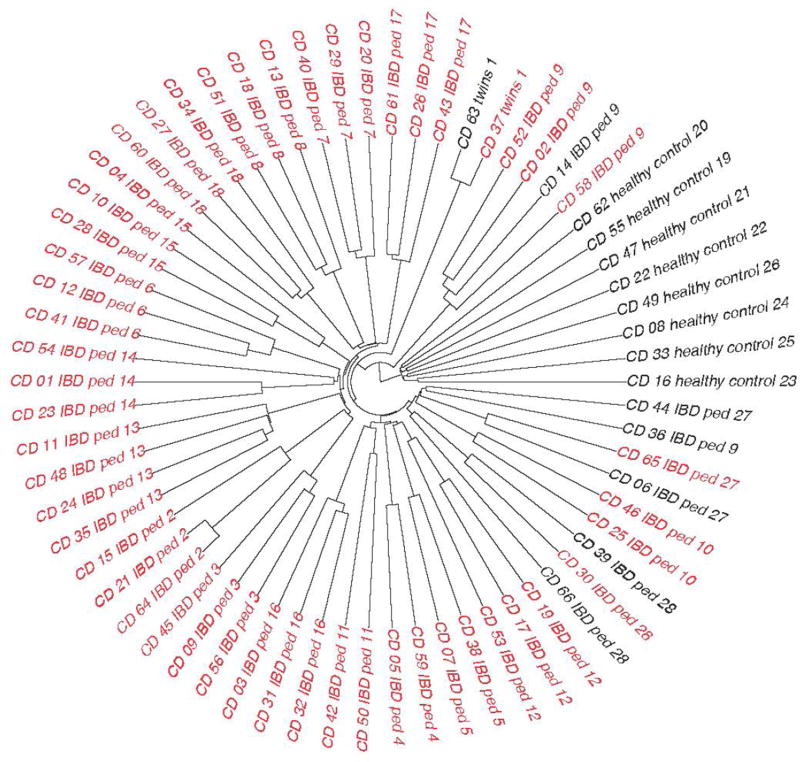
In the 2013 CAGI 3, a much greater effort was made to carefully collect and prepare samples in a completely consistent way. In this case, case samples were collected from German families with a particularly high burden of Crohn’s disease (two or more effected family members), including a pair of twins discordant for disease, and another pair of twins concordant with disease. Additional healthy controls were drawn from the unaffected German general population. During the 2013 CAGI 3, there was once again a substantial difference in clustering between cases and controls, but in this dataset there was substantially more homogeneity in the cases. Individuals from different case families clustered much more closely with other high Crohn’s burden family individuals (Figure 2). This prompted two possible hypotheses. The first is that there might be a hidden founder effect and that these families with a high burden of disease may all actually be closely related. The second is that reduced heterogeneity and perhaps increased ancestor consanguinity may contribute to increased risk of Crohn’s disease in these families with a high burden. Either one alone or a mixture of both possibilities is biologically plausible. In this instantiation of CAGI, groups that simply did some version of partitioning the test datasets based on hierarchical clustering did quite well, and the top performing methods had an AUC of 0.87. Once again, all of these methods were implemented without awareness of the bias in the data. A full description of all methods used by the participants can be found in the supplement under Exhibit 1:CAGI 3. Supplemental File 2 shows comparative results of the CAGI 3 Crohn’s disease challenge.
Figure 2.
Clustering of samples for CAGI 3 Crohn’s Disease challenge. Black represents controls, while red represents cases. This dataset included healthy family members of cases as well as random controls. Samples with a “ped” designation in the sample name came from a pedigree; samples that share the same “ped” number came from the same pedigree.
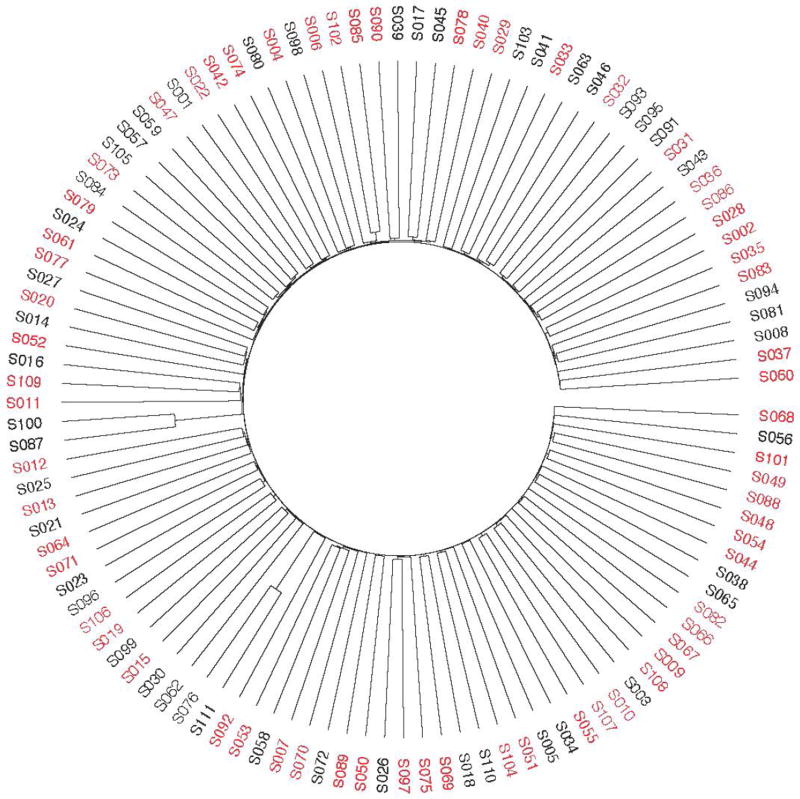
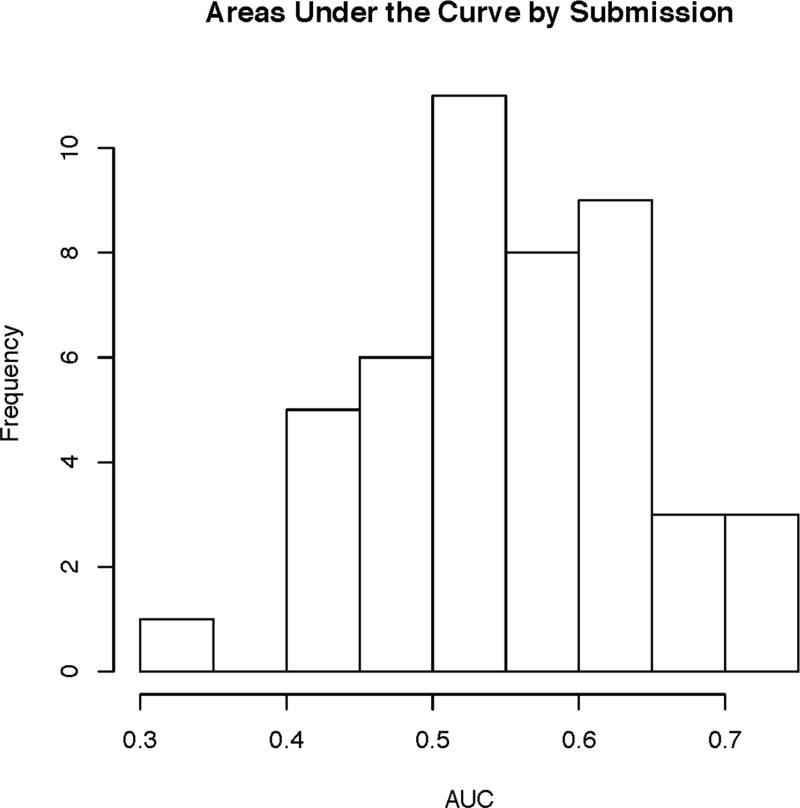
In CAGI 4, the 111 exomes were derived from a mix of 64 Crohn’s disease patients, with a skew toward early onset of disease, and 47 healthy controls, all taken from individuals of German descent. With this data, the simple separation of cases and controls based on genetic variants was not present (Figure 3), suggesting the problems with batch effects and sampling bias were no longer present; the only noticeable structure indicated the possibility of a few related samples, as seen in the PCA and IBD plots shown in Supplementary Figure S1 and Supplementary Figure S2. Correspondingly, the peak performance dropped from previous CAGI iterations down to an AUC of 0.72. However, given the elimination of biases in the data, this incarnation of the Crohn’s disease challenge is likely the best reflection of how the prediction methods perform. A meta-classifier created by the assessment team using all submitted methods for this challenge, as shown in Supplementary Figure S3, had an AUC of 0.78, a small improvement over the top method. The distribution of AUCs across methods is shown in Figure 4. A full description of all methods used by the participants can be found in the supplement Exhibit 1:CAGI 4. Supplemental File 3 shows comparative results of the CAGI 4 Crohn’s disease challenge.
Figure 3.
Clustering of samples for CAGI 4 Crohn’s Disease challenge. Black represents controls, and red represents cases.
Figure 4.
CAGI 4 Crohn’s disease challenge distribution of AUCs across all methods.
The top approach in CAGI 4 used a compiled list of genes and genomic regions associated with Crohn’s disease from prior studies, used imputation to evaluate risk contribution from known regions associated with Crohn’s disease but not covered by exome sequencing, and used the Welcome Trust Case Control Consortium (WTCCC) Crohn’s disease genotyping array data to train a disease classifier to score relative risk for each sample.
Across participants, numerous methods were used for selecting the covariates, highlighting the many different approaches to building a Crohn’s disease classifier. Similar to the top approach, many groups used variants previously found to be associated in genome-wide association studies; the NHGRI catalog was a popular choice to identify these associated variants (Welter, et al., 2014). Other approaches relied on gene lists of associated and “predicted” Crohn’s disease genes to select variants of interest. To create the “predicted” list of Crohn’s disease genes, groups used a variety of methods. Examples include using (1) existing tools such as Phenolyzer, which associates disease terms with genes based on prior research, expands the gene list by using gene-gene relationships, and then creates a ranked list of candidate genes and (2) creating gene lists based on GO pathways enriched with Crohn disease associated variants (3) using natural language processing to identify genes of interest from Pubmed abstracts (Ashburner, et al., 2000; Yang, et al., 2015). From a gene level, different groups would then devise different strategies to select variants of interest. For some approaches, population level frequency data was used to help distinguish variants more likely to be pathogenic. Other methods relied on pathogenicity prediction tools such as SNAP, PON-P2, SNPs&GO, and Variant Effect Predictor to inform variant selection and weighting (Bromberg and Rost, 2007; Calabrese, et al., 2009; McLaren, et al., 2010; Niroula, et al., 2015).
A range of machine learning approaches were used to actually build the classifiers-naïve Bayes, logistic regression, neural nets, and random forests. Additionally, some groups improved on prior iterations by creating meta-classifiers based on combinations of prior methods.
Bipolar Disorder Exomes Challenge (CAGI 4)
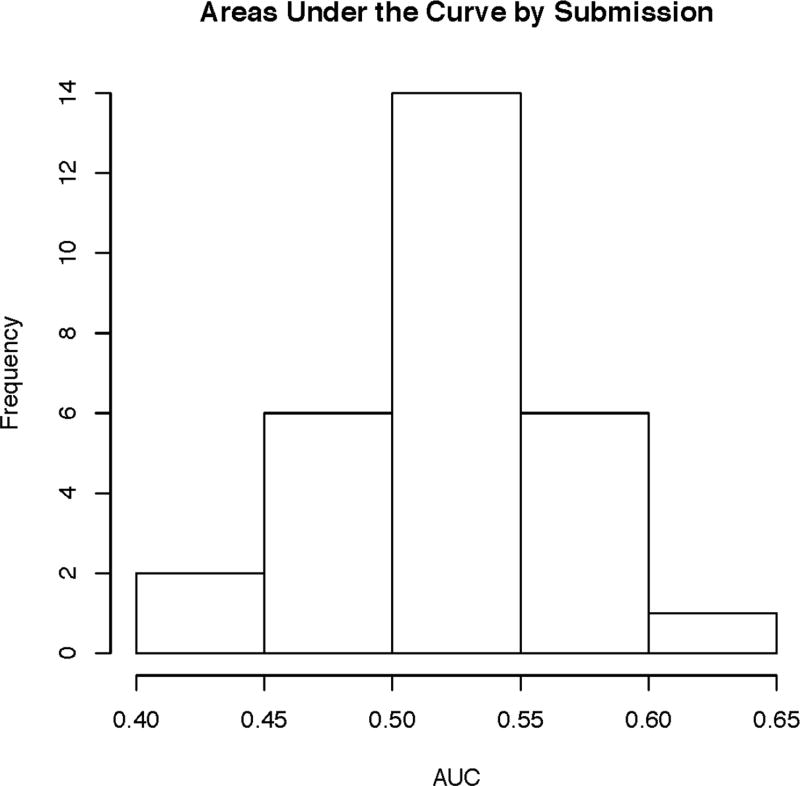
As noted, a substantial difference between the Crohn’s disease phenotypic prediction challenge and the bipolar disorder challenge, was that a substantial amount of training data was provided for the bipolar disorder challenge, with 500 of the 1000 exomes randomly selected and provided as training data for the challenge. These samples were unrelated, and analysis steps assessing the relationships between samples can be found in Supplementary Figures S4, S5, and S6. The top performing group had a method with an AUC of 0.64. The distribution of AUCs across methods is shown in Figure 5. Although many groups used approaches similar to those used for the Crohn’s disease challenge, the top performing group (which did not apply this method to Crohn’s disease data), treated the genotype data as linear features and trained a neural network with 3 hidden layers, with the middle layers looking at local features in the linear space of the ordered SNPs of the VCF file, tuning for performance using cross validation on the test data. Importantly, this approach used essentially no prior knowledge of genetics or the results of prior studies on disease-gene relationships. Supplemental File 4 shows comparative results of the CAGI 4 bipolar disorder challenge. Overall descriptions of prediction methods are available under Exhibit 2: CAGI 4. A meta-classifier created by the assessment team using all submitted methods for this challenge, as shown in Supplementary Figure S7, had an AUC of 0.64, which was not significantly different from the top method.
Figure 5.
CAGI 4 bipolar disorder challenge distribution of AUCs across all methods.
Warfarin Exomes Challenge (CAGI 4)
With the warfarin exomes challenge, similar to the Crohn’s disease challenge, many groups used a priori data to create a list of covariates used. This included known pharmacokinetic and pharmacodynamic warfarin genes, genes mentioned in the literature, and also using tools to find functional neighbors of the known gene set.
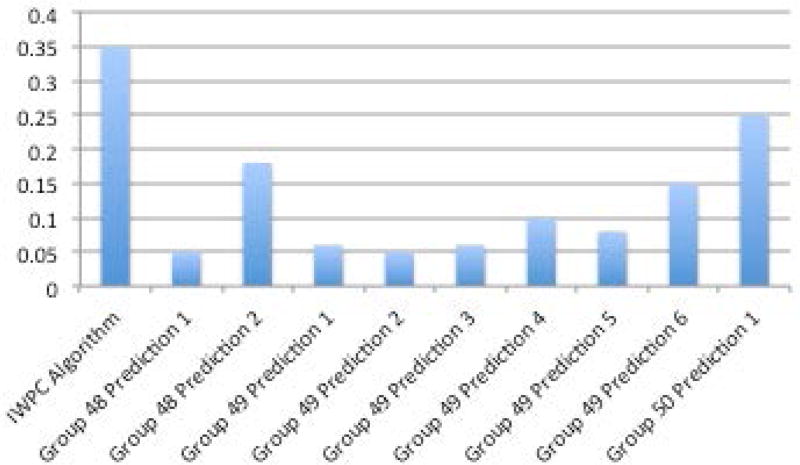
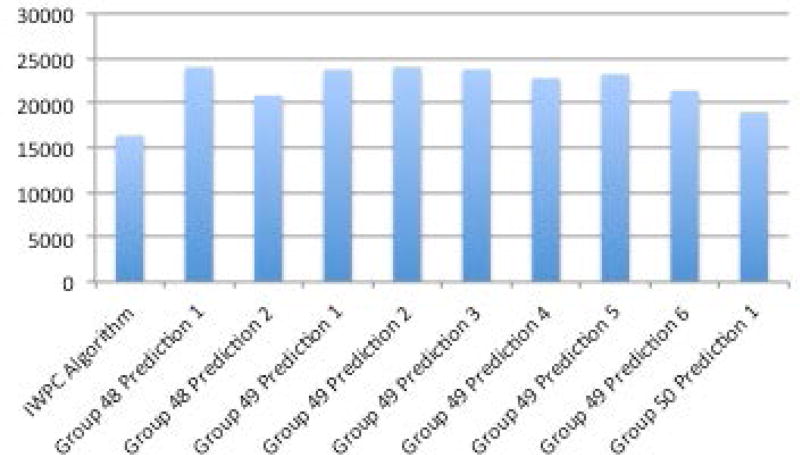
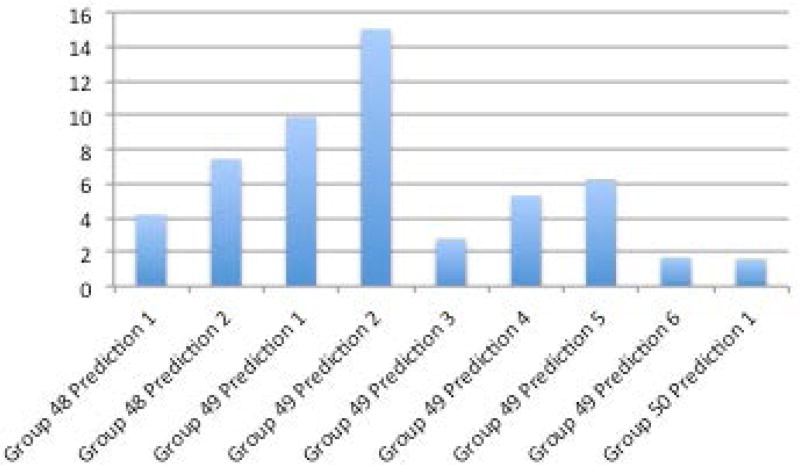
One prediction method (Group 50, Prediction 1) was ahead of the others when looking across multiple performance metrics described in the methods section - R2, mean absolute value of z score, and mean absolute value of z score multiplied by the coefficient of variation (Figures 6A–D, Supplementary Table S1). The R2 of the top prediction method was 0.25, compared to 0.35 for the IWPC prediction method, one of the best performing predictive algorithms. A visualization of the predictions compared to the actual dose can be seen in Supplementary Figures S8 and S9. Details of all methods can be found under Supplementary Exhibit 3:CAGI 4.
Figure 6A–D.
A. R2 between methods and actual dose. B. Sum of squared errors C. Mean z-scores between predicted doses with standard deviations and actual doses. D. Mean coefficient of variation (CV) and mean CV multiplied by mean z-score.
The methods submitted for this challenge had several similar features. Every method submitted took advantage of the fact that the range of doses were published in the paper from which the data came. Thus, these methods either fit rankings to the dose range or set doses above or below the known range to the lower or upper limits. Additionally, most methods used prior information from the literature to help set the initial clinical and genetic covariates to consider in their models.
Discussion
The CAGI exome challenges revealed lessons specific to each particular challenge as well as generalizable principles for future genotype-phenotype prediction challenges.
Crohn’s Disease
Overall, there were substantial challenges with bias and population stratification in the datasets that make evaluation and comparison of techniques for identifying Crohn’s Disease status from exome data difficult. In the latest crop of prediction systems, it may be that techniques such as using imputation to infer variants in regions not covered by the exome sequencing and large external microarray SNP chip datasets are key factors in superior performance. The top AUC varied across the three evaluations, demonstrating the substantial differences in the data sets. Groups who created meta-classifiers based on combining previous methods from previous CAGI challenges demonstrated the value of applying the Common Task Framework to genetic problems – through iteratively improving their methods based on prior learning. Importantly, across the three CAGI evaluations, the average system performance performed better than random, including in the most recent, CAGI 4, implying that there is some level of useful information in predicting likelihood of Crohn’s disease from exome data in the population, something previously not demonstrated.
Bipolar Disorder
Surprisingly, the group that created the best performing prediction in the Bipolar disorder challenge acknowledged having little background in biomedicine or genetics. This group approached the problem as purely a data classification challenge. On the one hand this may be hailed another example of the unreasonable effectiveness of data and the success of machine learning over human expertise; the quotation “Every time I fire a linguist, the performance of our speech recognition system goes up,” has been attributed to Fred Jelinek in the 1980’s, and something similar may be afoot in genomics, promising an exciting future as datasets expand and machine learning techniques improve. However, one of the major challenges is that prediction accuracy with case-control data does not really reflect most applications we can envision for a phenotypic prediction system. Moreover, while not detected by any of our quality control methods, it is still possible that the top performing method picked up on hidden population stratification/biases in the data. Although we were unable to find evidence of this, a sophisticated machine learning system may be identifying features which partition the cases and controls but which are not related to biological drivers of disease risk. Unfortunately, the tools to dissect the deep neural net architecture in the context of genomic features are currently too primitive to help us deepen our biological understanding using these results. There has been recent work into advanced techniques to understand the decisions made by previous black box systems in areas like image processing and natural language processing; however, similar tools for understanding genomic prediction systems are less developed (Ribeiro, et al., August 2016).
Warfarin
Predicting warfarin dose using clinical information and genetics is a difficult problem; one of the best performing algorithms (IWPC) has an R2 of 0.35 on this data set. Existing algorithms have poorer performance on diverse populations since most algorithms are trained on European descent populations (Klein et al. 2009; Daneshjou et al. 2014). For this challenge, the winning method had an R2 of 0.25.
The warfarin exomes challenge had several limitations. The sample size was limited, with only 50 samples for training and 53 for testing. This data was generated at a time when exome sequencing was more expensive; falling costs may allow an expansion of available exome data. Additionally, all groups used the known dose range of the cohort when assigning their predicted doses. Because of the use of this known range, some of these methods may be tailored particularly to this challenge and not be generalizable to the wider population.
Overall lessons from CAGI exomes challenge
An advantage of the common task structure is the ability to iterate quickly and learn from the setbacks of the groups analyzing the data. The exome challenges allowed us to glean several important lessons that will inform future iterations of CAGI.
The importance of population stratification, batch effects, and hidden biases became evident early on with CAGI 2 Crohn’s disease challenge (Figure 1). In that particular instance, either population stratification or batch effects created a discernable difference between cases and controls that was unlikely related to actual disease status. Based on that finding in CAGI 2, every subsequent CAGI challenge included a pre-analysis of the whole exome data trying to identify if there were samples that clustered together inappropriately based on case-control status. Population stratification has long been an issue in genetic studies. The most obvious issue arises when cases and controls come from distinctly different ancestral populations – such as comparing Northern European cases against Chinese controls. However, less obvious stratification can also be an issue – such as differences in admixture/population substructure or cryptic relatedness (Price, et al., 2010). Batch effects can occur at many different steps in the pipeline, for example if samples from the cases and controls have differences in sample preparation, DNA quality, sequencing coverage, or genotype calling. Any of the above can result in prediction methods that perform well due to systemic biases between cases and controls rather than true features that define case-control status.
How these challenge datasets emulate the real world was another important consideration and was a topic of discussion among the CAGI 4 community. A majority of the challenges used samples of Northern European ancestry –only the warfarin dose prediction challenge used samples of African ancestry. In order for the methods to be generalizable to real world populations, representation of human diversity is necessary, particularly since disease risk and pharmacogenetic variants can be population-specific (Rosenberg, et al., 2010). Moreover, the CAGI exome datasets all came from research studies, which are often designed to maximize the possibility of picking up a significant signal. One way to achieve this is through selecting for extreme phenotypes – a strategy employed by both the Crohn’s disease exome dataset (which selected a subset of cases who had early-onset Crohn’s disease) and the warfarin prediction exome dataset (selected from individuals requiring “low” and “high” doses to achieve the therapeutic index) (Manolio, et al., 2009). However, while this strategy works well for increasing signal strength in research, using such data for building a classifier may lead to a biased predictor that has difficulty differentiating between the more subtle variations seen in the real world. Having larger datasets and using data generated for clinical use may help remedy some of these issues in the future.
And finally, one of the most promising lessons from CAGI was on the effectiveness of data. As mentioned before, for complex tasks, the common task framework has provided a way to have many people work on a problem and iterate quickly. After a challenge has ended, sharing the evaluation scripts and the challenge answers allows participants to analyze when their prediction methods succeed or fail in order to improve further. Additionally, large datasets, even if imperfect, have also been shown to be a critical part of developing algorithms to tackle a complicated task (Pereira, et al., 2009). Critical to accumulating large enough datasets is data sharing, and the open data movement aims to encourage increased biomedical data sharing (McNutt, 2016). However one of the difficulties with genetic data that includes protected health information is sharing data in a secure manner. CAGI, which includes data encryption and verifies the groups participating can provide a platform to facilitate sharing such data. As a result of the data accumulated thus far, CAGI has demonstrated how data can, in certain cases, surmount prior biological knowledge. For CAGI 4, the Bipolar Disease challenge was the best example; individuals with no biological background, but a strong background in data science had the best performance. In particular, this should inspire a more multi-disciplinary approach to genotype-phenotype prediction and a greater effort to engage those whose backgrounds are more data-driven rather than biologically-driven.
Overall, the CAGI exome challenges provided an opportunity to begin building the classifiers required to implement precision medicine. While there is still a long road ahead for genotype-phenotype prediction, the accumulation of larger datasets and the participation of more groups with every subsequent CAGI holds promise for continued improvement.
Supplementary Material
Acknowledgments
The CAGI experiment coordination is supported by NIH U41 HG007446 and the CAGI conference by NIH R13 HG006650.
YB and YW were supported by the NIH U01 GM115486; YB was also supported by U24 MH068457 and the Informatics Research Starter grant from the PhRMA foundation
MHW was supported by National Science Foundation of China [81473035, 31401124] to MHW?
R.U is partially supported by grant 772/13 from the Israeli Science Foundation
Footnotes
Conflicts of interest:
R.M. has participated in Illumina sponsored meetings over the past four years and received travel reimbursement and an honorarium for presenting at these events. Illumina had no role in decisions relating to the study/work to be published, data collection and analysis of data and the decision to publish.
R.M. has participated in Pacific Biosciences sponsored meetings over the past three years and received travel reimbursement for presenting at these events.
R.M. is a founder and shared holder of Orion Genomics, which focuses on plant genomics and cancer genetics.
R.M. is a SAB member for RainDance Technologies, Inc.
References
- Ashburner M, Ball CA, Blake JA, Botstein D, Butler H, Cherry JM, Davis AP, Dolinski K, Dwight SS, Eppig JT, Harris MA, Hill DP, Issel-Tarver L, Kasarskis A, Lewis S, Matese JC, Richardson JE, Ringwald M, Rubin GM, Sherlock G. Gene ontology: tool for the unification of biology. The Gene Ontology Consortium. Nat Genet. 2000;25(1):25–9. doi: 10.1038/75556. [DOI] [PMC free article] [PubMed] [Google Scholar]
- Ashley EA. The precision medicine initiative: a new national effort. JAMA. 2015;313(21):2119–20. doi: 10.1001/jama.2015.3595. [DOI] [PubMed] [Google Scholar]
- Ashley EA, Butte AJ, Wheeler MT, Chen R, Klein TE, Dewey FE, Dudley JT, Ormond KE, Pavlovic A, Morgan AA, Pushkarev D, Neff NF, Hudgins L, Gong L, Hodges LM, Berlin DS, Thorn CF, Sangkuhl K, Hebert JM, Woon M, Sagreiya H, Whaley R, Knowles JW, Chou MF, Thakuria JV, Rosenbaum AM, Zaranek AW, Church GM, Greely HT, Quake SR, Altman RB. Clinical assessment incorporating a personal genome. Lancet. 2010;375(9725):1525–35. doi: 10.1016/S0140-6736(10)60452-7. [DOI] [PMC free article] [PubMed] [Google Scholar]
- Bauer KA. Recent progress in anticoagulant therapy: oral direct inhibitors of thrombin and factor Xa. J Thromb Haemost. 2011;9(Suppl 1):12–9. doi: 10.1111/j.1538-7836.2011.04321.x. [DOI] [PubMed] [Google Scholar]
- Bell RM, Koren Y. Lessons from the Netflix prize challenge. SIGKDD Explor. Newsl. 2007;9(2):75–79. [Google Scholar]
- Bromberg Y, Rost B. SNAP: predict effect of non-synonymous polymorphisms on function. Nucleic Acids Res. 2007;35(11):3823–35. doi: 10.1093/nar/gkm238. [DOI] [PMC free article] [PubMed] [Google Scholar]
- Brown TL, Meloche TM. Exome sequencing a review of new strategies for rare genomic disease research. Genomics. 2016 doi: 10.1016/j.ygeno.2016.06.003. [DOI] [PubMed] [Google Scholar]
- Budnitz DS, Lovegrove MC, Shehab N, Richards CL. Emergency hospitalizations for adverse drug events in older Americans. N Engl J Med. 2011;365(21):2002–12. doi: 10.1056/NEJMsa1103053. [DOI] [PubMed] [Google Scholar]
- CAGI. Critical Assessment of Genome Interpretation. 2011 https://genomeinterpretation.org/
- Calabrese R, Capriotti E, Fariselli P, Martelli PL, Casadio R. Functional annotations improve the predictive score of human disease-related mutations in proteins. Hum Mutat. 2009;30(8):1237–44. doi: 10.1002/humu.21047. [DOI] [PubMed] [Google Scholar]
- Cho JH. The genetics and immunopathogenesis of inflammatory bowel disease. Nat Rev Immunol. 2008;8(6):458–66. doi: 10.1038/nri2340. [DOI] [PubMed] [Google Scholar]
- Committee on Applied and Theoretical Statistics; Board on Mathematical Sciences and Their Applications; Division on Engineering and Physical Sciences; National Academies of Sciences E, and Medicine. Statistical Challenges in Assessing and Fostering the Reproducibility of Scientific Results: Summary of a Workshop. Washington DC: National Academies Press; 2016. [PubMed] [Google Scholar]
- Craddock N, Jones I. Genetics of bipolar disorder. J Med Genet. 1999;36(8):585–94. doi: 10.1136/jmg.36.8.585. [DOI] [PMC free article] [PubMed] [Google Scholar]
- Craddock N, Sklar P. Genetics of bipolar disorder. Lancet. 2013;381(9878):1654–62. doi: 10.1016/S0140-6736(13)60855-7. [DOI] [PubMed] [Google Scholar]
- Daneshjou R, Gamazon ER, Burkley B, Cavallari LH, Johnson JA, Klein TE, Limdi N, Hillenmeyer S, Percha B, Karczewski KJ, Langaee T, Patel SR, Bustamante CD, Altman RB, Perera MA. Genetic variant in folate homeostasis is associated with lower warfarin dose in African Americans. Blood. 2014;124(14):2298–305. doi: 10.1182/blood-2014-04-568436. [DOI] [PMC free article] [PubMed] [Google Scholar]
- Donoho D. 50 years of data science. MIT; 2015. http://courses.csail.mit.edu/18.337/2015/docs/50YearsDataScience.pdf: [Google Scholar]
- Ellinghaus D, Zhang H, Zeissig S, Lipinski S, Till A, Jiang T, Stade B, Bromberg Y, Ellinghaus E, Keller A, Rivas MA, Skieceviciene J, Doncheva NT, Liu X, Liu Q, Jiang F, Forster M, Mayr G, Albrecht M, Hasler R, Boehm BO, Goodall J, Berzuini CR, Lee J, Andersen V, Vogel U, Kupcinskas L, Kayser M, Krawczak M, Nikolaus S, Weersma RK, Ponsioen CY, Sans M, Wijmenga C, Strachan DP, McArdle WL, Vermeire S, Rutgeerts P, Sanderson JD, Mathew CG, Vatn MH, Wang J, Nothen MM, Duerr RH, Buning C, Brand S, Glas J, Winkelmann J, Illig T, Latiano A, Annese V, Halfvarson J, D’Amato M, Daly MJ, Nothnagel M, Karlsen TH, Subramani S, Rosenstiel P, Schreiber S, Parkes M, Franke A. Association between variants of PRDM1 and NDP52 and Crohn’s disease, based on exome sequencing and functional studies. Gastroenterology. 2013;145(2):339–47. doi: 10.1053/j.gastro.2013.04.040. [DOI] [PMC free article] [PubMed] [Google Scholar]
- Fagan TJ. Letter: Nomogram for Bayes theorem. N Engl J Med. 1975;293(5):257. doi: 10.1056/NEJM197507312930513. [DOI] [PubMed] [Google Scholar]
- Fernald GH, Capriotti E, Daneshjou R, Karczewski KJ, Altman RB. Bioinformatics challenges for personalized medicine. Bioinformatics. 2011;27(13):1741–8. doi: 10.1093/bioinformatics/btr295. [DOI] [PMC free article] [PubMed] [Google Scholar]
- Halfvarson J, Bodin L, Tysk C, Lindberg E, Jarnerot G. Inflammatory bowel disease in a Swedish twin cohort: a long-term follow-up of concordance and clinical characteristics. Gastroenterology. 2003;124(7):1767–73. doi: 10.1016/s0016-5085(03)00385-8. [DOI] [PubMed] [Google Scholar]
- IMS. The Use of Medicines in the United States: Review of 2011. IMS Institute for Healthcare Informatics; 2012. http://www.theimsinstitute.org. [Google Scholar]
- Klein TE, Altman RB, Eriksson N, Gage BF, Kimmel SE, Lee MT, Limdi NA, Page D, Roden DM, Wagner MJ, Caldwell MD, Johnson JA. Estimation of the warfarin dose with clinical and pharmacogenetic data. N Engl J Med. 2009;360(8):753–64. doi: 10.1056/NEJMoa0809329. [DOI] [PMC free article] [PubMed] [Google Scholar]
- Manolio TA, Collins FS, Cox NJ, Goldstein DB, Hindorff LA, Hunter DJ, McCarthy MI, Ramos EM, Cardon LR, Chakravarti A, Cho JH, Guttmacher AE, Kong A, Kruglyak L, Mardis E, Rotimi CN, Slatkin M, Valle D, Whittemore AS, Boehnke M, Clark AG, Eichler EE, Gibson G, Haines JL, Mackay TF, McCarroll SA, Visscher PM. Finding the missing heritability of complex diseases. Nature. 2009;461(7265):747–53. doi: 10.1038/nature08494. [DOI] [PMC free article] [PubMed] [Google Scholar]
- McLaren W, Pritchard B, Rios D, Chen Y, Flicek P, Cunningham F. Deriving the consequences of genomic variants with the Ensembl API and SNP Effect Predictor. Bioinformatics. 2010;26(16):2069–70. doi: 10.1093/bioinformatics/btq330. [DOI] [PMC free article] [PubMed] [Google Scholar]
- McNutt M. #IAmAResearchParasite. Science. 2016;351(6277):1005–1005. doi: 10.1126/science.aaf4701. [DOI] [PubMed] [Google Scholar]
- Monson ET, Pirooznia M, Parla J, Kramer M, Goes FS, Gaine ME, Gaynor SC, de Klerk K, Jancic D, Karchin R, McCombie WR, Zandi PP, Potash JB, Willour VL. Assessment of Whole-Exome Sequence Data in Attempted Suicide within a Bipolar Disorder Cohort. Mol Neuropsychiatry. 2017;3:1–11. doi: 10.1159/000454773. [DOI] [PMC free article] [PubMed] [Google Scholar]
- Morgan AA, Lu Z, Wang X, Cohen AM, Fluck J, Ruch P, Divoli A, Fundel K, Leaman R, Hakenberg J, Sun C, Liu HH, Torres R, Krauthammer M, Lau WW, Liu H, Hsu CN, Schuemie M, Cohen KB, Hirschman L. Overview of BioCreative II gene normalization. Genome Biol. 2008;9(Suppl 2):S3. doi: 10.1186/gb-2008-9-s2-s3. [DOI] [PMC free article] [PubMed] [Google Scholar]
- Moult J, Fidelis K, Kryshtafovych A, Schwede T, Tramontano A. Critical assessment of methods of protein structure prediction (CASP)--round x. Proteins. 2014;82(Suppl 2):1–6. doi: 10.1002/prot.24452. [DOI] [PMC free article] [PubMed] [Google Scholar]
- Niroula A, Urolagin S, Vihinen M. PON-P2: prediction method for fast and reliable identification of harmful variants. PLoS One. 2015;10(2):e0117380. doi: 10.1371/journal.pone.0117380. [DOI] [PMC free article] [PubMed] [Google Scholar]
- Pereira F, Norvig P, Halevy A. The Unreasonable Effectiveness of Data. IEEE Intelligent Systems. 2009;24:8. [Google Scholar]
- Price AL, Zaitlen NA, Reich D, Patterson N. New approaches to population stratification in genome-wide association studies. Nat Rev Genet. 2010;11(7):459–63. doi: 10.1038/nrg2813. [DOI] [PMC free article] [PubMed] [Google Scholar]
- Purcell S, Neale B, Todd-Brown K, Thomas L, Ferreira MA, Bender D, Maller J, Sklar P, de Bakker PI, Daly MJ, Sham PC. PLINK: a tool set for whole-genome association and population-based linkage analyses. Am J Hum Genet. 2007;81(3):559–75. doi: 10.1086/519795. [DOI] [PMC free article] [PubMed] [Google Scholar]
- Ribeiro MT, Singh S, Guestrin C. “Why should I trust you?” Explaining the Predictions of Any Classifier. arxiv. 2016 Aug; 1602.04938. [Google Scholar]
- Rosenberg NA, Huang L, Jewett EM, Szpiech ZA, Jankovic I, Boehnke M. Genome-wide association studies in diverse populations. Nat Rev Genet. 2010;11(5):356–66. doi: 10.1038/nrg2760. [DOI] [PMC free article] [PubMed] [Google Scholar]
- Thrun S, Montemerlo M, Dahlkamp H, Stavens D, Aron A, Diebel J, Fong P, Gale J, Halpenny M, Hoffmann G, Lau K, Oakley C, Palatucci M, Pratt V, Stang P, Strohband S, Dupont C, Jendrossek L-E, Koelen C, Markey C, Rummel C, van Niekerk J, Jensen E, Alessandrini P, Bradski G, Davies B, Ettinger S, Kaehler A, Nefian A, Mahoney P. Stanley: The robot that won the DARPA Grand Challenge. Journal of Field Robotics. 2006;23(9):661–692. [Google Scholar]
- Uhlig HH, Schwerd T, Koletzko S, Shah N, Kammermeier J, Elkadri A, Ouahed J, Wilson DC, Travis SP, Turner D, Klein C, Snapper SB, Muise AM Group CiIS, Neopics. The diagnostic approach to monogenic very early onset inflammatory bowel disease. Gastroenterology. 2014;147(5):990–1007. doi: 10.1053/j.gastro.2014.07.023. e3. [DOI] [PMC free article] [PubMed] [Google Scholar]
- Walker MA, Passonneau R, Boland JE. Proceedings of the 39th Annual Meeting on Association for Computational Linguistics. Toulouse, France: Association for Computational Linguistics; 2001. Quantitative and qualitative evaluation of Darpa Communicator spoken dialogue systems; pp. 515–522. [Google Scholar]
- Welter D, MacArthur J, Morales J, Burdett T, Hall P, Junkins H, Klemm A, Flicek P, Manolio T, Hindorff L, Parkinson H. The NHGRI GWAS Catalog, a curated resource of SNP-trait associations. Nucleic Acids Res. 2014;42(Database issue):D1001–6. doi: 10.1093/nar/gkt1229. [DOI] [PMC free article] [PubMed] [Google Scholar]
- Wray NR, Yang J, Goddard ME, Visscher PM. The genetic interpretation of area under the ROC curve in genomic profiling. PLoS Genet. 2010;6(2):e1000864. doi: 10.1371/journal.pgen.1000864. [DOI] [PMC free article] [PubMed] [Google Scholar]
- Yang H, Robinson PN, Wang K. Phenolyzer: phenotype-based prioritization of candidate genes for human diseases. Nat Methods. 2015;12(9):841–3. doi: 10.1038/nmeth.3484. [DOI] [PMC free article] [PubMed] [Google Scholar]
Associated Data
This section collects any data citations, data availability statements, or supplementary materials included in this article.


