

Abstract
Background
Although, especially in the United States, there has been a recent surge of legalized cannabis for either recreational or medicinal purposes, surprisingly little is known about clinical dose-response relationships, pharmaco- and toxicodynamic effects of cannabinoids such as Δ9-tetrahydrocannabinol (THC). Even less is known about other active cannabinoids.
Methods
To address this knowledge gap, an online extraction, high-performance liquid chromatography coupled to tandem mass spectrometry (LC-MS/MS) method for simultaneous quantification of 11 cannabinoids and metabolites including THC, 11-hydroxy-Δ9-tetrahydrocannabinol (11OH-THC), 11-nor-Δ9-tetrahydrocannabinol-9-carboxylic acid (THC-COOH), 11-nor-Δ9-tetrahydrocannabinol-9-carboxylic acid glucuronide (THC-C-gluc), cannabinol (CBN), cannabidiol (CBD), cannabigerol (CBG), cannabidivarin (CBDV), Δ9-tetrahydrocannabivarin (THCV), and 11-nor-9-carboxy-Δ9-tetrahydrocannabivarin (THCV-COOH) was developed and validated in human urine and plasma.
Results
In contrast to atmospheric pressure chemical ionization (APCI), electrospray ionization (ESI) was associated with extensive ion suppression in plasma and urine samples. Thus, the APCI assay was validated showing a lower limit of quantification (LLOQ) ranging from 0.39 to 3.91 ng/mL depending on study compound and matrix. The upper limit of quantitation (ULOQ) was 400 ng/mL except for THC-C-gluc with a ULOQ of 2000 ng/mL. The linearity was r> 0.99 for all analyzed calibration curves. Acceptance criteria for intra- and inter-batch accuracy (85%-115%) and imprecision (<15%) were met for all compounds. In plasma, the only exceptions were THCV (75.3%-121.2% inter-batch accuracy) and CBDV (inter-batch imprecision, 15.7%-17.2%). In urine, THCV did not meet predefined acceptance criteria for intra-batch accuracy.
Conclusions
This assay allows not only for monitoring THC and its major metabolites, but also of major cannabinoids that are of interest for marijuana research and clinical practice.
Keywords: cannabinoids, automated, online extraction, plasma, urine, LC-MS/MS
INTRODUCTION
Cannabis is by far the most widely cultivated, distributed, and abused drug [1]. About 147 million people, 2.5% of the world population, consume Cannabis annually compared with 0.2% consuming cocaine and 0.2% consuming opiates [1]. The major psychoactive constituent in Cannabis is Δ9-tetrahydrocannabinol (THC). Compounds that are structurally similar to THC are referred to as cannabinoids. In addition, a number of recently identified compounds that differ structurally from cannabinoids but share many of their pharmacological properties are also called cannabinoids [1]. Cannabinoids are biologically active compounds that exhibit drug-like effects throughout the body, especially in the central nervous system (CNS) and immune system [2]. As of January 2017, 28 U.S. states have passed laws that allow use of marijuana for medical purposes, with 8 states also allowing recreational use [3]. Nevertheless, the use of marijuana is associated with health risks [4–8]. Human clinical trials have mostly focused on the effects of medical marijuana mediated by THC without significant benefit. It has been shown that certain cannabinoids may modulate the effects of other cannabinoids (e.g., CBD modulates THC’s effects) and that some cannabinoids may inherently be more harmful than others [9, 10].
To date, most studies assessing the positive and negative effects of Cannabis use have been carried out either in a controlled research environment or epidemiological studies in an environment in which marijuana use was restricted and illegal [4]. Most of these studies also failed to convincingly establish cause–effect relationships [4–8, 11]. Hence, substantial scientific and public uncertainty exists regarding the behavioral and physical effects of marijuana use, especially with a wide range of routes and modes of administration including, but not limited to, smoking, vaporization, and edibles. Moreover, some of these commercially available forms of marijuana may have substantially higher contents of THC than has previously been studied [12]. Furthermore, other cannabinoids are present in these formulations, depending on the marijuana strain, cultivation conditions, plant maturity, and processing procedures [13]. Individuals also use enriched preparations such as oils, concentrates for vaporizers or “dabs” [14].
Chemically, cannabinoids were defined as a group of C21 terpenophenolic compounds uniquely produced by Cannabis [15]. Later, the development of synthetic cannabinoids (e.g., HU-210) has changed this definition, as has the discovery of endogenous cannabinoids (e.g., anandamide), defined as “endocannabinoids” by Fontana et al. [16]. Thus, the term “phytocannabinoids” was created to designate the compounds produced by Cannabis. To this date, there are over 600 known plant constituents in Cannabis including 104 cannabinoids and 200 terpenes [17]. The phytocannabinoids are separated into subclasses including, but not limited to, tetrahydrocannabinols (e.g., THC), cannabinols (e.g., CBN), cannabidiols (e.g., CBD), cannabigerols (e.g., CBG), cannabivarins (e.g., THCV), cannabichromenes (e.g., CBC), and other miscellaneous types. Following THC, CBD is the second most abundant cannabinoid in marijuana and the most abundant in hemp plants [14]. Recent investigations have shown that other less investigated cannabinoids such as CBD, CBC, CBN, and THCV may have therapeutic benefits in the treatment of various conditions, including chronic pain, anxiety, posttraumatic stress disorder (PTSD), rheumatoid arthritis, schizophrenia, diabetes, cardiovascular disease, nausea, cancer, and other conditions [18–26]. Currently, most bioanalytical assays that measure cannabinoids are limited to THC and its metabolites [27–35], with only a few including other cannabinoids [36].
However, with the recent wave of marijuana legalization and the use of other cannabinoids such as CBD in preclinical, clinical, and observational trials, sensitive and specific analytical assays are needed to establish dose–effect relationships of THC and other cannabinoids.
To address this gap, we have established and validated a cannabinoid LC-MS/MS assay with online trapping. This assay quantifies eleven cannabinoids and their metabolites for which appropriate reference materials are currently commercially available (THC, 11OH-THC, THC-COOH, THC-C-gluc, CBD, CBN, CBG, CBC, CBDV, THCV, and THCV-COOH) in human urine and plasma. This automated, specific, and fast assay with high sensitivity involves a simple one-step sample preparation procedure and is currently used for pharmacokinetic monitoring of several ongoing clinical and observational studies.
MATERIALS AND METHODS
Chemicals
The analytes and internal standards were purchased from the following sources: Δ9-tetrahydrocannabinol (THC), 11-hydroxy-Δ9-tetrahydrocannabinol (11OH-THC), 11-nor-Δ9-tetrahydrocannabinol-9-carboxylic acid glucuronide (THC-C-gluc), cannabinol (CBN), and cannabidivarin (CBDV) were purchased from Cerilliant (Corporation, Round Rock, TX). Cannabidiol (CBD), cannabichromene (CBC), cannabigerol (CBG), and Δ9-tetrahydrocannabivarin (THCV) were purchased from Cayman Chemicals (Ann Arbor, MI). 11-nor-Δ9-tetrahydrocannabinol-9-carboxylic acid (THC-COOH) and 11-nor-9-carboxy-Δ9-tetrahydrocannabivarin (THCV-COOH) were purchased from Elsohly Laboratories (Oxford, MS). The deuterated internal standard compounds Δ9-tetrahydrocannabinol-d3 (THC-d3), 11-hydroxy-Δ9-tetrahydrocannabinol-d3 (11OH-THC-d3), cannabinol-d3 (CBN-d3), and cannabidiol-d3 (CBD-d3) were purchased from Cerilliant. The deuterated internal standard 11-nor-Δ9-tetrahydrocannabinol-9-carboxylic acid-d6 (THC-COOH-d6) was purchased from Elsohly Laboratories.
The chemicals and solvents used for this study including methanol, isopropanol, acetonitrile, water, formic acid (all LC/MS grade), and zinc sulfate (ZnSO4) were purchased from Fisher Scientific (Waltham, MA).
Working range
The calibrator and quality control (QC) sample preparation was identical for both urine and plasma. Calibration curves were prepared by spiking 20 μL of 10× stock solution containing all analytes into 180 μL of blank matrix and resulting in final concentrations of 0.39, 0.78, 1.56, 3.13, 6.25, 12.5, 25, 50, 100, 200, and 400 ng/mL for all analytes except for THC-C-gluc, which was five-fold higher concentrated to cover its higher urine concentration range. Since this assay measures 11 analytes with different working ranges, it was necessary to analyze a rather large set of QCs including 1, 2, 4, 8, 16, 128, and 320 ng/mL (as aforementioned, THC-C-gluc concentrations were five-fold higher).
Sample extraction
The sample extraction procedure was identical for both matrices. Ten μL of 20-fold aliquots of 200 μL of the calibrator, quality control, or blank sample (urine or plasma) were transferred into a 1.5-mL low-binding polypropylene vial (Sarstedt, Nümbrecht, Germany). Eight hundred μL of 0.2 mol/L ZnSO4 30% water/70% methanol (v/v) containing the internal standards (5 ng/mL) were added. Samples were vortexed for 10 minutes and then centrifuged (at 27,500·g, 4 °C, 10 minutes, Sorvall Legend 23R or Thermo Scientific MR 23i). The supernatant was transferred into an HPLC autosampler vial.
LC-MS/MS
High-performance liquid chromatography (HPLC) was performed using an Agilent 1200 series LC system equipped with two binary pumps, a thermostatted column compartment (Agilent Technologies, Palo Alto, CA), a Leap HTC PAL autosampler (Leap Technologies, Raleigh, NC), and a Valco 6-port switching valve (VICI Valco Instruments, Houston, TX). The configuration of the switching valve is shown in Figure S1 in the Supplemental Digital Contents. Two hundred fifty μL of the samples were injected onto a 4.6 · 12.5 mm online extraction column (Zorbax XDB C8, Agilent Technologies) with a particle size of 5 μm. Samples were loaded and washed with a mobile phase of 45% methanol supplemented with 0.1% formic acid and 55% with 0.1% formic acid in water. The flow was increased from 0.5 to 1.5 mL/minute within 1 minute. The extraction column was kept at room temperature. After 1 minute, the switching valve was activated and the analytes were eluted in the back-flush mode from the extraction column onto a 4.6 · 50 mm Poroshell Eclipse C18, 2.7 μm analytical column (Agilent Technologies). The analytical column was kept at 60 °C. The organic solvent (mobile phase B) consisted of 20% isopropanol, 20% methanol, and 60% acetonitrile and the aqueous solvent (mobile phase A) consisted of water supplemented with 0.1% formic acid. The analytical gradient started with a flow rate of 0.75 mL/minute and 60% of solvent B for the first minute. Within the following 3 minutes, the flow rate and the organic solvent content were increased to 1 mL/minute and 95% solvent B, respectively. From 4 to 6 minutes, the solvent B was increased to 100%. At minutes 6.2, the system returned to starting conditions for 1.8 minutes to equilibrate before the following injection. The HPLC system was interfaced with an ABSciex API5000 tandem mass spectrometer (Sciex, Concord, Ontario, Canada) via a turbo V ion source operated in the positive atmospheric pressure chemical ionization (APCI) mode. The nebulizer current was set to 5 μA; the source gases 1 and 2 were set to 40 (arbitrary units); the source temperature was set to 450 °C; the entrance potential and the collision cell exit potential were set to 10 and 11 V, respectively. A complete list of multiple reaction monitoring (MRM) transitions and parameters used in this study is shown in Table S1 in the Supplemental Digital Contents; the MRM transitions used for the quantitation and the corresponding deuterated internal standards are listed in Table S2 in the Supplemental Digital Contents.
Validation strategy
The assay was developed and validated in human urine and plasma. The recoveries and matrix effects (ion suppression/ ion enhancement) were determined as described by Matuszewski et al. [12]. In addition, matrix effects were also studied by post-column infusion experiments as described by Mueller et al. [37]. Recovery and matrix effect testing were based on blank plasma and urine samples collected from six different individuals. For the specificity and selectivity of the assay, we showed that there was no endogenous signal interference within the extracted blank sample of each individual lot used (blank signal needed to be <20% of the LLOQ).
The determination of the lower limit of quantification (LLOQ) and range of reliable response was performed by analysis of six sets (n = 6) of calibration curves. The requirement for the LLOQ was a minimum mean accuracy between 80% and 120%, and the relative standard deviation (RSD%) had to be ≤20%. The correlation coefficient (r) was required to be >0.99, and at least two-thirds of the back-calculated concentrations had to be within 85%–115% of the nominal concentration (80%-120% for the lowest calibrator). Intra-batch accuracy, inter-batch accuracy, intra-batch imprecision, and inter-batch imprecision were determined based on the analysis of QC samples over three days. Each day, a set of six QCs was analyzed per QC level (n = 6). For this, two calibration curves were generated: one was analyzed at the beginning and one at the end of the analytical batch. The results were acceptable if the RSD% was ≤15% and accuracy was within 85%-115% of the expected concentration. The determination of dilution integrity was based on samples enriched above the upper limit of quantification (ULOQ), which had been diluted, and results had to be within 85%-115% of the nominal concentration. Carry-over was excluded by analysis of blank buffer samples following the highest calibrator and QC samples. Signals had to be ≤20% of the LLOQ.
Stock solution stability was assessed by analysis of a buffer stock solution at 200 ng/mL that was stored at −20 °C for the duration of one week or one month. Autosampler stability was assessed by analyzing sets of extracted QC samples after 24 and 48 hours of storage in the autosampler at +4 °C. These QCs were analyzed together with freshly prepared calibrator samples. Freeze–thaw cycle stability was assessed by exposing sets of QCs to 1, 2, and 3 freeze–thaw cycles (−80 °C) followed by analysis using freshly prepared calibration curves. Short-term stability was assessed by storing QC samples at room temperature (benchtop) and 4 °C (refrigerator) for 2 hours, 4 hours, 1 day, and 1 week prior to analysis. Sample stability was also tested by storing QC samples at −20 and −80 °C for the duration of 1 week, 1 month and 4 months prior to analysis. Stability was assumed if the concentrations of the stored test samples were within 85%-115% of the reference concentrations.
Proof of concept in samples from clinical and observational marijuana studies
The assay was used to analyze plasma and urine samples that were collected as part of various clinical and observational trials investigating the effects of medical marijuana in the context of various conditions such as inflammatory bowel disease, Parkinson’s disease, pediatric epilepsy, pediatric patients with brain tumors, and changes in sleep patterns. All human plasma and urine samples were collected as part of Colorado Department of Public Health and Environment (CDPHE) funded medical marijuana grants (a complete list of studies is available in [38]). All studies were reviewed and approved by the Colorado Multiple Institutional Review Board (COMIRB, Aurora, CO). Informed written assent/consent, as appropriate, was obtained from all study participants.
RESULTS
Assay development
Initially, chromatographic conditions were optimized, including the testing of various HPLC columns, mobile phases, and gradients. The best separation of isobaric cannabinoids or cannabinoid metabolites that fragmented in-source (e.g., CBD, THC, CBC, and THC-C-gluc) was achieved with the assay described in the Methods section. Representative extracted ion-chromatograms for the 11 cannabinoids are shown in Figure 1.
Figure 1.
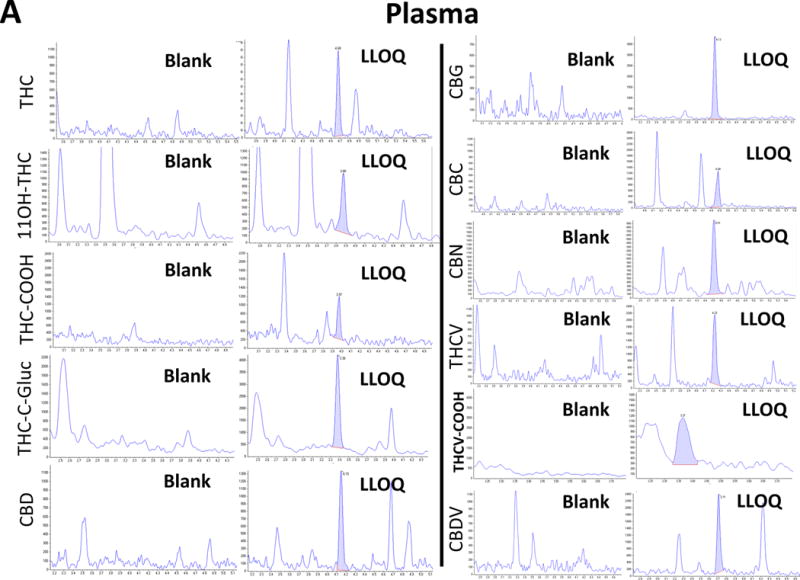
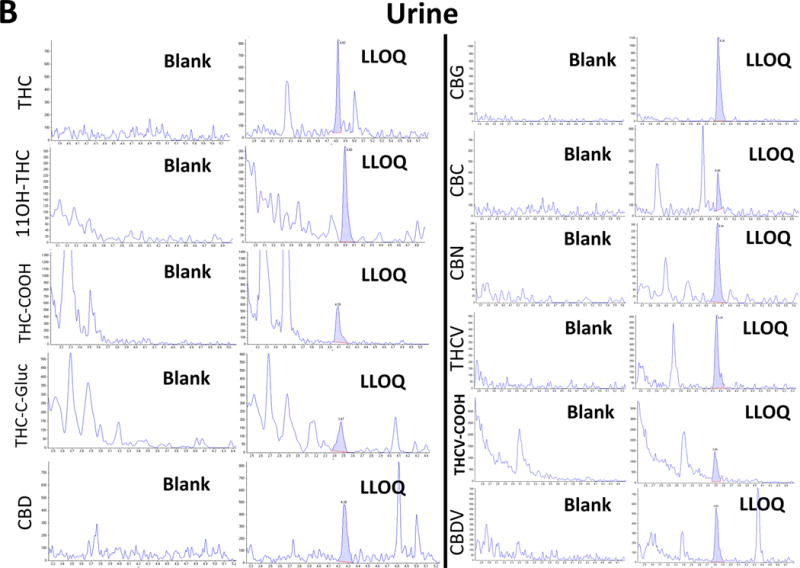
Representative ion-chromatograms of (A) plasma and (B) a urine blank sample and the corresponding calibrator samples spiked with the cannabinoids at the LLOQ.
In all ion chromatograms, the x-axis labels show the time in minutes and the y-axis labels the MS/MS detector response in counts per second.
During assay development, carry-over was an issue at first. Thus, extraction column breakthrough experiments were performed. For this, the organic solvent concentration used for the sample load onto the extraction column was systematically increased until a peak broadening or disappearance (breakthrough) was observed. This was the case at organic solvent concentrations of more than 55% during sample loading (please see Figure S2 in the Supplemental Digital Contents, top row, right ion chromatogram). THC-C-gluc was among the most polar compounds included in this assay, and the disappearance of THC-C-gluc was observed using 70% organic solvent during sample loading. (For details, please see Figure S2 in the Supplemental Digital Contents) On the other hand, enhanced carry-over was observed when organic solvent concentrations were lower than 30% during sample loading (see Figure S2, bottom, left ion chromatogram). Thus, the optimal mobile phase composition during sample loading was determined to be 45% organic and 55% of aqueous solvent.
To detect ionization efficiency changes attributable to co-eluting matrix substances, we tested urine and plasma collected from six different individuals similar to that described by Mueller et al. [37] in both ESI and APCI modes. After protein precipitation, samples were enriched and back-flushed onto the analytical column as described above. We infused cannabinoids (10 mg/L dissolved in methanol) post-column via a T-piece at 1 mL/hour using a syringe pump (Harvard Apparatus, Holliston, MA). The extent of ion suppression was established by monitoring the intensity of the ion currents in MRM mode at the retention times of analytes and IS. Figure S3A shows a representative ion chromatogram of a plasma extract injected in ESI mode and APCI mode. Substantial ion suppression in the region of the eluting cannabinoids was observed in ESI mode, while there was no significant ion suppression observed in any of the analyzed plasma extracts in APCI mode. Ion suppression in ESI mode in extracted urine samples was less pronounced, but still noticeably present (see Figure S3B). Post-column infusion revealed a more stable signal in APCI mode for extracted urine samples as well. To detect if the ion suppression was caused by phosphatidylcholine (PC) species, plasma samples were extracted using the standard extraction protocol and analyzed using the same chromatographic conditions described in the Methods section. The mass spectrometer settings for the detection of PCs described by Little et al. [39] were applied. Figure S3C shows that the elution times of PC species were aligned with time periods of high ion suppression.
Validation results
The responses at the retention times of the 11 cannabinoids in the ion chromatograms of extracted blank human EDTA plasma and urine sample matrix (n = 6) were less than 20% of the detector response of that of the lowest calibrators or its internal standards. Thus, the assay was considered specific for the quantification of 11 cannabinoids in human urine and EDTA plasma. Matrix effect was evaluated by analysis of extracted blank plasma samples and extracted blank urine samples from six individuals during constant infusion of the 11 compounds. In APCI mode, no significant matrix effects were observed (Figure S3). The matrix effect was evaluated by comparing blank extracted matrix samples that had been enriched after extraction with enriched buffer samples as described by Matuszewski et al. [12]. This evaluation was performed at three different concentrations within the working range of the assay. The matrix effect (as described above) was calculated as follows: %-Matrix Effect = (Areabuffer / Areaenriched matrix · 100) − 100.
The mean absolute matrix effects in plasma were determined to be 7.9%, −17.0%, −12.6%, −6.3%, −14.1%, −3.6%, −6.0%, −14.2%, −1.7%, −14.9%, and −2.9% and the mean matrix effects in urine were 2.4%, −4.6%, −2.6%, −4.2%, −3.3%, −4.3%, −4.5%, −3.4%, 0.2%, 4.3%, and 11.7% for 11OH-THC, CBN, CBG, THC, THCV, THC-COOH, THCV-COOH, CBD, CBC, CBDV, and for THC-C-gluc, respectively.
Table 1 shows representative ion chromatograms of blanks and samples at the LLOQ for the cannabinoids based on the acceptance criteria as set forth by the FDA guidance for bioanalytical method development [40]. Determination of the intra- and inter-batch accuracies and imprecisions was performed on three validation days for each matrix. On each validation day, two calibration curves of enriched matrix were analyzed with each analytical batch and the correlation coefficient was larger than r = 0.99 for all analytes during all days. Consistently, the accuracy of at least two-thirds of calibration samples (=66.7%) was between 85% and 115% from nominal (except for the calibrators at the LLOQ, which had to be within 80%-120%). The calibration samples at the LLOQ always showed a signal-to-noise ratio of more than 5:1, no significant interference was present in blank samples and no significant carryover (less than 1%) was observed. Tables 2A and 2B summarize the key assay performance parameters determined during the validation based on QC samples (n = 6 per level per batch) for plasma and urine. At least two-thirds of the QC samples in an analytical batch had to be within ±15% of the nominal concentration and the imprecision had to be less than 15%. Table 2 shows that these criteria were met for all compounds in both matrices except the cannabivarins THCV and CBDV in plasma and THCV in urine, which would require broader acceptance criteria of ±25%. Dilution integrity was evaluated by enrichment of samples with concentrations five-fold higher than the ULOQ. These samples were diluted 1/5, 1/10, and 1/20 using blank matrix to fit within the working range of the assay. The accuracies of the diluted samples were within 85%-115% for all compounds except for the cannabivarins (THCV, THCV-COOH, CBDV, and THC-C-gluc) in plasma. The mean accuracies for the cannabinoids in diluted plasma were 113.5%, 113.3%, 110.8%, 111.5%, 122.3%, 109.1%, 120.2%, 112.2%, 104.1%, 123.8%, and 117.5% for 11OH-THC, CBN, CBG, THC, THCV, THC-COOH, THCV-COOH, CBD, CBC, CBDV and for THC-C-gluc, respectively. For urine, dilution integrity testing failed for most compounds. The back-calculated accuracies in urine were mostly low with 60%-80% for all analytes, except for the cannabivarins THCV-COOH and CBDV, which passed the acceptance criteria of ±15% of the nominal value.
Table 1.
Lower and upper limits of quantitation (LLOQ and ULOQ) and extraction recovery. For the LLOQ, the accuracy had to be within 80–120% with less than 20% imprecision and the signal had to be at least five-fold higher than that of a blank sample. Recovery was determined in samples collected from 6 different individuals at 3 different levels for each analyte. Mean recoveries ± standard deviation (SD) are shown.
| Plasma | Urine | |||||||
|---|---|---|---|---|---|---|---|---|
|
| ||||||||
| LLOQ | ULOQ | % Recovery | LLOQ | ULOQ | % Recovery | |||
| ng/mL | ng/mL | mean | SD | ng/mL | ng/mL | mean | SD | |
| 11OH-THC | 1.56 | 400 | 103 | 3.6 | 1.56 | 400 | 97 | 5.1 |
| CBN | 1.56 | 400 | 73 | 3.4 | 1.56 | 400 | 96 | 4.4 |
| CBG | 0.78 | 400 | 86 | 1.4 | 0.78 | 400 | 96 | 1.8 |
| THC | 0.39 | 400 | 74 | 1.1 | 0.78 | 400 | 95 | 3.6 |
| THCV | 0.78 | 400 | 93 | 3.3 | 0.78 | 400 | 98 | 4.7 |
| THC-COOH | 0.39 | 400 | 73 | 3.1 | 1.56 | 400 | 100 | 2.1 |
| THCV-COOH | 0.78 | 400 | 88 | 3.4 | 3.13 | 400 | 101 | 4.5 |
| CBD | 0.39 | 400 | 87 | 3.6 | 0.78 | 400 | 98 | 4.7 |
| CBC | 0.78 | 400 | 60 | 1.3 | 0.78 | 400 | 94 | 3.0 |
| CBDV | 0.78 | 400 | 98 | 2.4 | 0.78 | 400 | 99 | 3.3 |
| THC-C-gluc | 3.91 | 2000 | 71 | 6.0 | 3.91 | 2000 | 99 | 3.2 |
Table 2.
The key assay performance parameters in plasma and urine. Accuracy and imprecision (%CV) were determined over 3 days with 6 sets of QC samples analyzed on each consecutive day. Data listed were based on the QCs within the working range of the assay.
| A: Key assay performance parameters in plasma | ||||
|---|---|---|---|---|
|
| ||||
| Mean intra-batch | Mean inter-batch | |||
| % Accuracy | %Imprecision | % Accuracy | % Imprecision | |
| 11OH-THC | 93.0 – 103.2 | 1.5 – 7.3 | 95.7 – 102.8 | 2.2 – 5.7 |
| CBN | 96.4 – 105.8 | 1.4 – 5.5 | 98.5 – 103.8 | 2.4 – 5.5 |
| CBG | 93.8 – 104.2 | 1.0 – 4.7 | 95.5 – 102.0 | 2.5 – 3.4 |
| THC | 89.5 – 112.6 | 0.5 – 7.5 | 94.9 – 106.6 | 3.8 – 7.5 |
| THCV | 75.3 – 121.2 | 1.6 – 6.5 | 96.0 – 103.0 | 15.7 – 17.2 |
| THC-COOH | 94.3 – 114.3 | 1.9 – 7.6 | 97.4 – 108.6 | 3.0 – 6.4 |
| THCV-COOH | 86.3 – 103.9 | 2.2 – 8.3 | 92.6 – 101.6 | 3.7 – 7.5 |
| CBD | 93.9 – 104.6 | 1.0 – 6.8 | 97.3 – 102.9 | 2.7 – 5.7 |
| CBC | 88.4 – 114.0 | 1.6 – 5.0 | 90.2 – 97.5 | 3.1 – 6.6 |
| CBDV | 78.1 – 109.9 | 2.1 – 6.7 | 95.2 – 99.8 | 11.3 – 14.4 |
| THC-C-gluc | 89.2 – 110.3 | 0.8 – 8.8 | 92.3 – 102.5 | 5.6 – 7.3 |
| B: Key assay performance parameters in urine | ||||
|---|---|---|---|---|
|
| ||||
| Mean intra-batch | Mean inter-batch | |||
| %Accuracy | %Imprecision | %Accuracy | %Imprecision | |
| 11OH-THC | 93.7 – 105.1 | 1.8 – 13.7 | 96.8 – 100.2 | 4.9 – 9.9 |
| CBN | 88.6 – 105.0 | 3.3 -12.0 | 92.9 – 100.4 | 5.8 – 11.7 |
| CBG | 91.7 – 107.3 | 2.3 – 8.2 | 96.7 – 103 | 3.6 – 7.3 |
| THC | 91.9 – 101.8 | 0.9 – 9.2 | 94.7 – 100.5 | 2.3 – 8.1 |
| THCV | 84.9 – 100.0 | 2.6 – 8.1 | 88.3 – 93.7 | 4.9 – 7.5 |
| THC-COOH | 90.9 – 102.9 | 2.4 – 8.5 | 94.2 – 100.9 | 4.3 – 7.4 |
| THCV-COOH | 85.3 – 100.6 | 2.3 – 15.2 | 92.1 – 97.8 | 7.9 – 10.5 |
| CBD | 92.3 – 100.8 | 1.8 – 8.3 | 94.4 – 99.3 | 2.2 – 6.4 |
| CBC | 88.3 – 101.7 | 1.6 – 10.3 | 92.6 – 100.6 | 4.4 – 10.8 |
| CBDV | 85.3 – 98.0 | 2.6 – 9.6 | 85.8 – 93.8 | 4.5 – 9.0 |
| THC-C-gluc | 82.6 – 104.0 | 2.8 – 14.1 | 88.6 – 100.8 | 5.4 – 9.6 |
There was no impact on the stability of cannabinoids observed in either plasma or urine when samples were exposed to up to three freeze–thaw cycles (please see Table S3 in the Supplemental Digital Contents). Furthermore, extracted plasma and urine samples were stable in the autosampler at +4 °C for up to 48 hours. Cannabinoids in plasma and urine were stable at ambient temperature (benchtop) for up to 24 hours except for CBC, which was only stable for up to 4 hours. All cannabinoids were stable for at least one week at +4 °C, −20 °C, and −80 °C (Table S4 in the Supplemental Digital Contents). Most cannabinoids did not pass the acceptance criteria when extracted after storage for extended periods at −20 °C and −80 °C (please see Table S5 in the Supplemental Digital Contents).
Proof of concept in samples from clinical and observational marijuana studies
A total of 352 plasma samples and 93 urine samples were analyzed using the present assay in the time between March 2016 and January 2017 in support of medical marijuana studies (see Table 3). One hundred and twenty-five plasma and 12 urine samples were negative/free of all cannabinoids. Highest concentrations of any cannabinoid detected in both plasma and urine were for 11-Nor-Δ9-THC-9-carboxylic acid glucuronide (THC-C-gluc) with maximum concentrations of 1485 and 7431 ng/mL for plasma and urine, respectively. Most of the clinical studies were observational clinical trials during which study participants consumed cannabis at home, and samples were collected later at the study sites. Thus, cannabinoid metabolites such as 11OH-THC, THC-COOH, THC-C-gluc, and THCV-COOH were more frequently detected and at higher concentrations than their corresponding cannabinoid precursors (Table 3). Representative ion chromatograms of plasma samples with high cannabinoid concentrations (A and C) compared to negative samples (B and D) are shown in Figure S4 in the Supplemental Digital Contents.
Table 3.
Summary of CDPHE [38] study sample results.
| Compound | THC | 11OH-THC | THC-COOH | THC-C-gluc | ||||
|---|---|---|---|---|---|---|---|---|
|
| ||||||||
| Matrix | Plasma | Urine | Plasma | Urine | Plasma | Urine | Plasma | Urine |
| No. of negative | 256 | 92 | 254 | 89 | 146 | 32 | 160 | 12 |
| No. of positive | 96 | 1 | 98 | 4 | 206 | 61 | 192 | 81 |
| Max. concentration [ng/mL] | 57.8 | 0.8 | 300.2 | 132.8 | 391.5 | 309.8 | 1495.1 | 7431.0 |
| Compound | CBD | CBN | CBC | CBG | ||||
|---|---|---|---|---|---|---|---|---|
|
| ||||||||
| Matrix | Plasma | Urine | Plasma | Urine | Plasma | Urine | Plasma | Urine |
| No. of negative | 198 | 88 | 351 | 93 | 292 | 92 | 345 | 92 |
| No. of positive | 154 | 5 | 1 | 0 | 60 | 1 | 7 | 1 |
| Max. concentration [ng/mL] | 344.1 | 3.3 | 2.1 | 0.0 | 18.3 | 1.2 | 1.2 | 1.0 |
| Compound | THCV | THCV-COOH | CBDV | |||||
|---|---|---|---|---|---|---|---|---|
|
| ||||||||
| Matrix | Plasma | Urine | Plasma | Urine | Plasma | Urine | ||
| No. of negative | 347 | 93 | 308 | 66 | 351 | 91 | ||
| No. of positive | 5 | 0 | 44 | 27 | 1 | 2 | ||
| Max. concentration [ng/mL] | 1.6 | 0.0 | 17.8 | 81.3 | 2.0 | 2.4 | ||
CBD was detected in a total of 154 of 352 plasma samples with concentrations as high as 344 ng/mL. The highest THC concentration detected in plasma was 256 ng/mL. In comparison to plasma, only a small number of urine samples contained CBD and/or THC. As expected [36], THC metabolites were highly abundant in the urine samples. While reference materials for the major THC metabolites are commercially available and these could be identified in urine, this was not the case for CBD metabolites. Representative ion chromatograms of urine samples after consumption of THC and CBD are shown in Figure S5 in the Supplemental Digital Contents. In these urine samples, the ion transition m/z = 318.4 → 196.3, which was monitored for THC-COOH and THC-C-gluc, also showed several signals eluting in the range between 2.2 and 3.2 minutes. Considering that CBD also elutes approximately 0.5 minutes earlier than THC with the same ion transition as THC (m/z = 315.2 → 193.1), it can be speculated that these are the signals of CBD-COOH and CBD-glucuronide(s).
Other cannabinoids such as CBC, CBN, CBG, and cannabivarins were only sporadically detectable, mainly in plasma samples with high THC levels, indicating that marijuana had been consumed shortly before the study visit. Except for CBC, these cannabinoids were detected in a small number of samples: CBN in 0.3% of the tested plasma samples, CBG in 2.0%, THCV in 1.4%, and CBDV in 0.3%. However, CBC was detected in 60 plasma samples (17.0% of all samples tested). Forty-three of these samples also contained CBD in combination with CBC and were mostly from patients who had consumed CBD oils.
DISCUSSION
The current standard approach to objectively confirm marijuana use, urine toxicology testing, is usually limited to THC and metabolites, and it does not necessarily reflect systemic exposure. Standard toxicology testing is more qualitative than quantitative, normalization to compensate for different concentrations of urine samples remains a problem, and standard urine toxicology testing does usually not detect exposure to other cannabinoids such as CBD. However, these other cannabinoids are increasingly of clinical importance. In comparison to THC, CBD has several opposing effects on human brain and behavior and modulates THC’s effects [7, 41, 42]. THC and CBD are just two of 100+ cannabinoids that may mitigate or exacerbate the therapeutic and harmful effects of marijuana [17], and it is reasonable to expect that cannabinoid profiles in plasma will be of value for the clinical effect/risk assessment of individual patients rather than simply confirming the absence or presence of THC.
In this context, we successfully developed and validated an assay platform that enables monitoring the levels of all major cannabinoids and their metabolites for which, as of today, reference materials are commercially available in human plasma and urine. As described above, we observed extensive ion suppression in plasma samples when ESI was used. Moreover, the chromatographic regions, in which ion suppression was most abundant, were associated with regions in which phosphatidylcholine species eluted. Since a complete chromatographic separation of all 11 cannabinoids from these co-eluting PC species was not possible without an excessively long gradient, APCI mode was chosen for this assay. The use of APCI substantially reduced ion suppression and allowed for an LC-MS/MS run time of 8 minutes. After the optimization of sample loading conditions, no carryover was detected for most study compounds, except for the most lipophilic compounds THC and CBC, for which it was less than 1%.
The LLOQs for most cannabinoids in both matrices were below 1 ng/mL. These limits could only be reached by using an online extraction procedure. Published assays with sub ng/mL LLOQs usually use offline solid phase extraction procedures followed by evaporation and reconstitution of analytes prior to LC-MS analysis [28, 35, 43–46] or organic extraction followed by evaporation [47]. These procedures are laborious, and evaporation-reconstitution steps are potentially problematic especially for lipophilic cannabinoids due to instability, binding to vessel walls, and poor recovery during reconstitution. Our assay is simple and sensitive enough since peak concentrations of THC after smoking were observed to be 250 ng/mL in plasma [9, 48–50], and 4-hour values were in the range of approximately 2 ng/mL [9, 48, 50].
Dilution integrity testing showed that samples with high cannabinoid concentrations (above the ULOQ) could be diluted in plasma to result in concentrations that are within the working range of the assay. For urine, however, dilution of samples above the ULOQ resulted in back-calculated accuracies that were mostly low and ranged between 60%-80%. This could be explained by the very lipophilic nature of cannabinoids. Enrichment of urine samples at very high cannabinoid concentrations can cause precipitation or binding to the container wall. This could differ among different lots of urine depending on the urine salt concentration and composition that is highly variable. Thus, urine values above the ULOQ can only be semi-quantitatively estimated.
Although the cannabivarins (THCV, CBDV, and THCV-COOH) are structurally closely related to the corresponding cannabinoids (THC, CBD, and THC-COOH), it seemed that the chemical properties differed vastly in contrast to the other cannabinoids included in this assay. As a result, THCV and CBDV were the only compounds that failed the pre-defined acceptance criteria during assay validation, and broader acceptance criteria may be required.
Cannabinoids were stable at the conditions tested for up to three freeze–thaw cycles, 48 hours in the autosampler at +4 °C and for up to one week at +4 °C, −20 °C, and −80 °C in plasma and urine. Urine samples were generally stable when stored for up to four months under these conditions with the exceptions of CBG and CBC, which showed a decline of 16%-20% after four months of storage. Plasma samples that were stored at −20 °C and −80 °C for one and four months did not pass the acceptance criteria. While storage at −80 °C for the first month shows a decline of approximately 20% for most cannabinoids (THC, 11OH-THC, THC-COOH, THCV-COOH, CBC, CBG, and CBD), there was only a slight further decline approximately of an additional 5%-12% observed for the following period of three months. There are discrepancies among the long-term stability results reported by different laboratories depending on the coagulant used and artificially enriched samples versus in vitro stability in study samples [35, 50]. Our results are in alignment with results published by Grauwiler et al. [35], who also prepared the samples (urine and plasma) by enrichment with cannabinoid stock solutions. The instability during long-term storage, which has not been shown for accelerated short-term stability experiments, could not be explained by enzymatic processes, but rather by binding to container surfaces or irreversible binding to plasma components or proteins resulting in a decreased recovery. Also, QC samples used for stability assessment in this study were enriched with cannabinoids dissolved in methanol. These samples contain methanol from the working solutions after enrichment, which could impact long-term stability results.
Scheidweiler et al. [50] used heparin plasma from study subjects after cannabis administration and showed stability for up to six months. The difference to the present study, which used spiked blank EDTA plasma, is that the clinical samples did not contain organic solvent as used for the cannabinoid enrichment of blank samples. Based on this comparison, it can be speculated that organic solvents may have negatively impacted our long-term stability studies. However, relying on patient samples after cannabis consumption would not have been feasible here as there is no cannabis plant that contains all cannabinoids included in the present assay at sufficient concentrations for stability assessment.
CONCLUSION
In summary, our analysis of 352 plasma and 93 urine samples collected during clinical and observational studies provided first proof of concept of the present validated, high-throughput, sensitive, and specific LC-MS/MS assay for the quantification of 11 cannabinoids, suggesting that this assay may be useful for clinical monitoring and cannabis research studies.
Supplementary Material
Figure S1. Connections of the switching valve are shown. Left side: during sample load, the injector is connected to the online extraction column. With this setting, the sample is loaded onto the extraction column and cannabinoids are concentrated on the top of the extraction column, while salts and impurities are washed into the waste. After 1 minute, the cannabinoids are back-flushed onto the analytical column (right side of the diagram) and the gradient separating the analytes is run. After 6.2 minutes once the cannabinoids are eluted from the analytical column and are detected by the mass spectrometer, the switching valve is switched back to the loading setting (left side of the diagram) and the columns are re-equilibrated before the next injection.
Figure S2. Extraction column “break-through” and “carry-over” experiments. From left to right, the organic solvent concentration during the sample load was increased from 30% to 50% and up to 70% organic solvent (methanol/ 0.1% formic acid). The top three ion chromatograms show the transition m/z = 345 → 299 for THC-COOH and THC-C-gluc. The arrow in the third ion chromatogram of the top row shows the disappearance of THC-C-gluc indicating elution from the extraction column (“break-through”) during sample load and clean up at 70% organic solvent. The mid row shows the MS/MS signals of CBD as well as of the most lipophilic compounds THC and CBC after injection of the highest plasma calibrator. The bottom row of ion chromatograms shows the carry-over samples following the highest calibrators for the same compounds under the different loading conditions. In all ion chromatograms, the x-axis labels show the time in minutes and the y-axis labels the MS/MS detector response (intensity) in counts per second.
Figure S3. Ion suppression in plasma (A), urine (B), and their temporal relationship with phosphatidylcholine (PC) signals (C). For (A, B): The ion suppression effects of extracted biological matrix after extraction tested in electrospray ionization (ESI) and in atmospheric pressure chemical ionization mode (APCI) via continuous post-column infusion of cannabinoids (similar to Mueller et al. [37]). (C) Plasma samples as used in (A) were tested for PC species using ESI and the mass spectrometry settings for the detection of PC similar to those described by Little et al. [39]. In all ion chromatograms, the x-axis labels show the time in minutes and the y-axis labels the MS/MS detector response (intensity) in counts per second.
Figure S4. Representative extracted ion chromatograms of a (A) plasma sample with high cannabinoid concentrations and (B) plasma sample with no cannabinoids detected; (A) and (B) are both from the same study entitled “Colorado Cannabis Cohort: Efficacy, Safety, and Usage Patterns of Medical Marijuana for Sleep”; (C) plasma sample with high cannabivarin concentrations and (B) plasma sample with no cannabivarins detected; (C) and (D) are both from the same study entitled “Use of Medicinal Cannabinoids as Adjunctive Treatment for Medically Refractory Epilepsy.” (For details, see https://www.colorado.gov/pacific/cdphe/approved-medical-marijuana-research-grants). In all ion chromatograms, the x-axis labels show the time in minutes and the y-axis labels the MS/MS detector response (intensity) in counts per second.
Figure S5. Representative ion chromatograms of urine samples from CDPHE study participants. The extracted ion chromatograms of the ion transition m/z= 318.4 → 196.3 are shown. This transition detects THC-COOH and THC-gluc (due to in-source fragmentation). Urine A shows a typical extracted ion chromatogram after consumption of high-THC cannabis. Urine B shows a typical extracted ion chromatogram of urine after consumption of CBD oil. Since CBD has the same molecular weight as THC and CBD and THC metabolism are similar, it seems reasonable to expect that the signals in the region between 2.2 and 3.2 minutes represent CBD metabolites. In all ion chromatograms, the x-axis labels show the time in minutes and the y-axis labels the MS/MS detector response (intensity) in counts per second.
Acknowledgments
This study was partially supported by the National Institutes of Health grants 4K24DA032555-04 and 5R01DA035804-03 as well as the Colorado Department of Public Health and Environment.
Funding
This study was supported by the National Institutes of Health grants 4K24DA032555-04 and 5R01DA035804-03 as well as the Colorado Department of Public Health and Environment.
Abbreviations
- APCI
atmospheric pressure chemical ionization
- CBD
cannabidiol
- CBDV
cannabidivarin
- CBG
cannabigerol
- CBN
cannabinol
- CDPHE
Colorado Department of Public Health and Environment
- CNS
central nervous system
- ESI
electrospray ionization
- HPLC
high performance liquid chromatography
- LLOQ
lower limit of quantitation
- MS
mass spectrometry
- MS/MS
tandem mass spectrometry
- MRM
multiple reaction monitoring
- PTSD
posttraumatic stress disorder
- QC
quality control
- THC
Δ9-tetrahydrocannabinol
- 11OH-THC
11-hydroxy-Δ9-tetrahydrocannabinol
- THC-COOH
11-nor-Δ9-tetrahydrocannabinol-9-carboxylic acid
- THC-C-gluc
11-nor-Δ9-tetrahydrocannabinol-9-carboxylic acid glucuronide
- THCV
Δ9-tetrahydrocannabivarin
- THCV-COOH
11-nor-9-carboxy-Δ9-tetrahydrocannabivarin
- ULOQ
upper limit of quantitation
References
- 1.WHO Management of Substance Abuse, World Health Organization. 2014 Available at: http://wwwwhoint/substance_abuse/facts/cannabis/en/ Accessed October 10, 2016.
- 2.Parmar JR, Forrest BD, Freeman RA. Medical marijuana patient counseling points for health care professionals based on trends in the medical uses, efficacy, and adverse effects of cannabis-based pharmaceutical drugs. Res Social Adm Pharm. 2016;12:638–654. doi: 10.1016/j.sapharm.2015.09.002. [DOI] [PubMed] [Google Scholar]
- 3.Fasinu PS, Phillips S, ElSohly MA, et al. Current status and prospects for Cannabidiol preparations as new therapeutic agents. Pharmacotherapy. 2016;36:781–796. doi: 10.1002/phar.1780. [DOI] [PubMed] [Google Scholar]
- 4.Hopfer C. Implications of marijuana legalization for adolescent substance use. Subst Abus. 2014;35:331–335. doi: 10.1080/08897077.2014.943386. [DOI] [PMC free article] [PubMed] [Google Scholar]
- 5.Goldman D. America’s cannabis experiment. JAMA Psychiatry. 2015;72:969–970. doi: 10.1001/jamapsychiatry.2015.1332. [DOI] [PubMed] [Google Scholar]
- 6.Cressey D. The cannabis experiment. Nature. 2015;524:280–283. doi: 10.1038/524280a. [DOI] [PubMed] [Google Scholar]
- 7.Curran HV, Freeman TP, Mokrysz C, et al. Keep off the grass? Cannabis, cognition and addiction. Nat Rev Neurosci. 2016;17:293–306. doi: 10.1038/nrn.2016.28. [DOI] [PubMed] [Google Scholar]
- 8.Volkow ND, Baler RD, Compton WM, et al. Adverse health effects of marijuana use. N Engl J Med. 2014;370:2219–2227. doi: 10.1056/NEJMra1402309. [DOI] [PMC free article] [PubMed] [Google Scholar]
- 9.Huestis MA. Human cannabinoid pharmacokinetics. Chem Biodivers. 2007;4:1770–1804. doi: 10.1002/cbdv.200790152. [DOI] [PMC free article] [PubMed] [Google Scholar]
- 10.McPartland JM, Duncan M, Di Marzo V, et al. Are cannabidiol and Delta(9)-tetrahydrocannabivarin negative modulators of the endocannabinoid system? A systematic review. Br J Pharmacol. 2015;172:737–753. doi: 10.1111/bph.12944. [DOI] [PMC free article] [PubMed] [Google Scholar]
- 11.Gordon AJ, Conley JW, Gordon JM. Medical consequences of marijuana use: a review of current literature. Curr Psychiatry Rep. 2013;15:419. doi: 10.1007/s11920-013-0419-7. [DOI] [PubMed] [Google Scholar]
- 12.Matuszewski BK, Constanzer ML, Chavez-Eng CM. Strategies for the assessment of matrix effect in quantitative bioanalytical methods based on HPLC-MS/MS. Anal Chem. 2003;75:3019–3030. doi: 10.1021/ac020361s. [DOI] [PubMed] [Google Scholar]
- 13.Mehmedic Z, Chandra S, Slade D, et al. Potency trends of Delta9-THC and other cannabinoids in confiscated cannabis preparations from 1993 to 2008. J Forensic Sci. 2010;55:1209–1217. doi: 10.1111/j.1556-4029.2010.01441.x. [DOI] [PubMed] [Google Scholar]
- 14.Russo EB. Taming THC: potential cannabis synergy and phytocannabinoid-terpenoid entourage effects. Br J Pharmacol. 2011;163:1344–1364. doi: 10.1111/j.1476-5381.2011.01238.x. [DOI] [PMC free article] [PubMed] [Google Scholar]
- 15.Mechoulam R, Gaoni Y. Recent advances in the chemistry of hashish. Fortschr Chem Org Naturst. 1967;25:175–213. doi: 10.1007/978-3-7091-8164-5_6. [DOI] [PubMed] [Google Scholar]
- 16.Fontana A, Di Marzo V, Cadas H, et al. Analysis of anandamide, an endogenous cannabinoid substance, and of other natural N-acylethanolamines. Prostaglandins Leukot Essent Fatty Acids. 1995;53:301–308. doi: 10.1016/0952-3278(95)90130-2. [DOI] [PubMed] [Google Scholar]
- 17.Reuter SE, Martin JH. Pharmacokinetics of cannabis in cancer cachexia-anorexia syndrome. Clin Pharmacokinet. 2016;55:807–812. doi: 10.1007/s40262-015-0363-2. [DOI] [PubMed] [Google Scholar]
- 18.Booker L, Naidu PS, Razdan RK, et al. Evaluation of prevalent phytocannabinoids in the acetic acid model of visceral nociception. Drug Alcohol Depend. 2009;105:42–47. doi: 10.1016/j.drugalcdep.2009.06.009. [DOI] [PMC free article] [PubMed] [Google Scholar]
- 19.Davis MP. Cannabinoids for symptom management and cancer therapy: the evidence. J Natl Compr Canc Netw. 2016;14:915–922. doi: 10.6004/jnccn.2016.0094. [DOI] [PubMed] [Google Scholar]
- 20.Rajesh M, Mukhopadhyay P, Batkai S, et al. Cannabidiol attenuates cardiac dysfunction, oxidative stress, fibrosis, and inflammatory and cell death signaling pathways in diabetic cardiomyopathy. J Am Coll Cardiol. 2010;56:2115–2125. doi: 10.1016/j.jacc.2010.07.033. [DOI] [PMC free article] [PubMed] [Google Scholar]
- 21.Haj CG, Sumariwalla PF, Hanus L, et al. HU-444, a novel, potent anti-inflammatory, nonpsychotropic cannabinoid. J Pharmacol Exp Ther. 2015;355:66–75. doi: 10.1124/jpet.115.226100. [DOI] [PMC free article] [PubMed] [Google Scholar]
- 22.El-Alfy AT, Ivey K, Robinson K, et al. Antidepressant-like effect of delta9-tetrahydrocannabinol and other cannabinoids isolated from Cannabis sativa L. Pharmacol Biochem Behav. 2010;95:434–442. doi: 10.1016/j.pbb.2010.03.004. [DOI] [PMC free article] [PubMed] [Google Scholar]
- 23.Ligresti A, Moriello AS, Starowicz K, et al. Antitumor activity of plant cannabinoids with emphasis on the effect of cannabidiol on human breast carcinoma. J Pharmacol Exp Ther. 2006;318:1375–1387. doi: 10.1124/jpet.106.105247. [DOI] [PubMed] [Google Scholar]
- 24.Mizrachi Zer-Aviv T, Segev A, Akirav I. Cannabinoids and post-traumatic stress disorder: clinical and preclinical evidence for treatment and prevention. Behav Pharmacol. 2016;27:561–569. doi: 10.1097/FBP.0000000000000253. [DOI] [PubMed] [Google Scholar]
- 25.Manseau MW, Goff DC. Cannabinoids and schizophrenia: risks and therapeutic potential. Neurotherapeutics. 2015;12:816–824. doi: 10.1007/s13311-015-0382-6. [DOI] [PMC free article] [PubMed] [Google Scholar]
- 26.Jadoon KA, Ratcliffe SH, Barrett DA, et al. Efficacy and safety of cannabidiol and tetrahydrocannabivarin on glycemic and lipid parameters in patients with type 2 diabetes: a randomized, double-blind, placebo-controlled, parallel group pilot study. Diabetes Care. 2016;39:1777–1786. doi: 10.2337/dc16-0650. [DOI] [PubMed] [Google Scholar]
- 27.Schwope DM, Scheidweiler KB, Huestis MA. Direct quantification of cannabinoids and cannabinoid glucuronides in whole blood by liquid chromatography-tandem mass spectrometry. Anal Bioanal Chem. 2011;401:1273–1283. doi: 10.1007/s00216-011-5197-7. [DOI] [PMC free article] [PubMed] [Google Scholar]
- 28.Aizpurua-Olaizola O, Zarandona I, Ortiz L, et al. Etxebarria N and Usobiaga A Simultaneous quantification of major cannabinoids and metabolites in human urine and plasma by HPLC-MS/MS and enzyme-alkaline hydrolysis. Drug Test Anal 2017. 2017;9:626–633. doi: 10.1002/dta.1998. [DOI] [PubMed] [Google Scholar]
- 29.Scheidweiler KB, Newmeyer MN, Barnes AJ, et al. Quantification of cannabinoids and their free and glucuronide metabolites in whole blood by disposable pipette extraction and liquid chromatography-tandem mass spectrometry. J Chromatogr A. 2016;1453:34–42. doi: 10.1016/j.chroma.2016.05.024. [DOI] [PMC free article] [PubMed] [Google Scholar]
- 30.Desrosiers NA, Scheidweiler KB, Huestis MA. Quantification of six cannabinoids and metabolites in oral fluid by liquid chromatography-tandem mass spectrometry. Drug Test Anal. 2015;7:684–694. doi: 10.1002/dta.1753. [DOI] [PubMed] [Google Scholar]
- 31.Montesano C, Sergi M, Odoardi S, et al. A mu-SPE procedure for the determination of cannabinoids and their metabolites in urine by LC-MS/MS. J Pharm Biomed Anal. 2014;91:169–175. doi: 10.1016/j.jpba.2013.12.035. [DOI] [PubMed] [Google Scholar]
- 32.Sergi M, Montesano C, Odoardi S, et al. Micro extraction by packed sorbent coupled to liquid chromatography tandem mass spectrometry for the rapid and sensitive determination of cannabinoids in oral fluids. J Chromatogr A. 2013;1301:139–146. doi: 10.1016/j.chroma.2013.05.072. [DOI] [PubMed] [Google Scholar]
- 33.Milman G, Schwope DM, Gorelick DA, et al. Cannabinoids and metabolites in expectorated oral fluid following controlled smoked cannabis. Clin Chim Acta. 2012;413:765–770. doi: 10.1016/j.cca.2012.01.011. [DOI] [PMC free article] [PubMed] [Google Scholar]
- 34.Milman G, Barnes AJ, Lowe RH, et al. Simultaneous quantification of cannabinoids and metabolites in oral fluid by two-dimensional gas chromatography mass spectrometry. J Chromatogr A. 2010;1217:1513–1521. doi: 10.1016/j.chroma.2009.12.053. [DOI] [PMC free article] [PubMed] [Google Scholar]
- 35.Grauwiler SB, Scholer A, Drewe J. Development of a LC/MS/MS method for the analysis of cannabinoids in human EDTA-plasma and urine after small doses of Cannabis sativa extracts. J Chromatogr B Analyt Technol Biomed Life Sci. 2007;850:515–522. doi: 10.1016/j.jchromb.2006.12.045. [DOI] [PubMed] [Google Scholar]
- 36.Andersson M, Scheidweiler KB, Sempio C, et al. Simultaneous quantification of 11 cannabinoids and metabolites in human urine by liquid chromatography tandem mass spectrometry using WAX-S tips. Anal Bioanal Chem. 2016;408:6461–6471. doi: 10.1007/s00216-016-9765-8. [DOI] [PMC free article] [PubMed] [Google Scholar]
- 37.Mueller C, Schaefer P, Stortzel M, et al. Ion suppression effects in liquid chromatography-electrospray-ionisation transport-region collision induced dissociation mass spectrometry with different serum extraction methods for systematic toxicological analysis with mass spectra libraries. J Chromatogr B Analyt Technol Biomed Life Sci. 2002;773:47–52. doi: 10.1016/s1570-0232(02)00142-3. [DOI] [PubMed] [Google Scholar]
- 38.CDPHE. Approved medical marijuana research grants [web site] 2015 Available at: https://www.colorado.gov/pacific/cdphe/approved-medical-marijuana-research-grants Accessed February 18, 2017.
- 39.Little JL, Wempe MF, Buchanan CM. Liquid chromatography-mass spectrometry/mass spectrometry method development for drug metabolism studies: Examining lipid matrix ionization effects in plasma. J Chromatogr B Analyt Technol Biomed Life Sci. 2006;833:219–230. doi: 10.1016/j.jchromb.2006.02.011. [DOI] [PubMed] [Google Scholar]
- 40.CDER United States Department of Health and Human Services, Food and Drug Administration, and CfDEaR and (CVM) CfVM Guidance for the Industry. Bioanalytical Method Validation. FDA. 2001 Available at: http://www.fda.gov/cder/guidance. Accessed February 18, 2017.
- 41.Morgan CJ, Schafer G, Freeman TP, et al. Impact of cannabidiol on the acute memory and psychotomimetic effects of smoked cannabis: naturalistic study: naturalistic study [corrected] Br J Psychiatry. 2010;197:285–290. doi: 10.1192/bjp.bp.110.077503. [DOI] [PubMed] [Google Scholar]
- 42.Englund A, Morrison PD, Nottage J, et al. Cannabidiol inhibits THC-elicited paranoid symptoms and hippocampal-dependent memory impairment. J Psychopharmacol. 2013;27:19–27. doi: 10.1177/0269881112460109. [DOI] [PubMed] [Google Scholar]
- 43.Sanchez-Gonzalez J, Salgueiro-Fernandez R, Cabarcos P, et al. Cannabinoids assessment in plasma and urine by high performance liquid chromatography-tandem mass spectrometry after molecularly imprinted polymer microsolid-phase extraction. Anal Bioanal Chem. 2017;409:1207–1220. doi: 10.1007/s00216-016-0046-3. [DOI] [PubMed] [Google Scholar]
- 44.Ferreiros N, Labocha S, Walter C, et al. Simultaneous and sensitive LC-MS/MS determination of tetrahydrocannabinol and metabolites in human plasma. Anal Bioanal Chem. 2013;405:1399–1406. doi: 10.1007/s00216-012-6501-x. [DOI] [PubMed] [Google Scholar]
- 45.Mercolini L, Musenga A, Comin I, et al. Determination of plasma and urine levels of Delta9-tetrahydrocannabinol and its main metabolite by liquid chromatography after solid-phase extraction. J Pharm Biomed Anal. 2008;47:156–163. doi: 10.1016/j.jpba.2007.12.023. [DOI] [PubMed] [Google Scholar]
- 46.Maralikova B, Weinmann W. Simultaneous determination of Delta9-tetrahydrocannabinol, 11-hydroxy-Delta9-tetrahydrocannabinol and 11-nor-9-carboxy-Delta9-tetrahydrocannabinol in human plasma by high-performance liquid chromatography/tandem mass spectrometry. J Mass Spectrom. 2004;39:526–531. doi: 10.1002/jms.616. [DOI] [PubMed] [Google Scholar]
- 47.Dubois N, Paccou AP, De Backer BG, et al. Validation of the quantitative determination of tetrahydrocannabinol and its two major metabolites in plasma by ultra-high-performance liquid chromatography-tandem mass spectrometry according to the total error approach. J Anal Toxicol. 2012;36:25–29. doi: 10.1093/jat/bkr009. [DOI] [PubMed] [Google Scholar]
- 48.Karschner EL, Darwin WD, Goodwin RS, et al. Plasma cannabinoid pharmacokinetics following controlled oral delta9-tetrahydrocannabinol and oromucosal cannabis extract administration. Clin Chem. 2011;57:66–75. doi: 10.1373/clinchem.2010.152439. [DOI] [PMC free article] [PubMed] [Google Scholar]
- 49.Scheidweiler KB, Andersson M, Swortwood MJ, et al. Long-term stability of cannabinoids in oral fluid after controlled cannabis administration. Drug Test Anal. 2016 doi: 10.1002/dta.2056. [DOI] [PMC free article] [PubMed] [Google Scholar]
- 50.Scheidweiler KB, Schwope DM, Karschner EL, et al. In vitro stability of free and glucuronidated cannabinoids in blood and plasma following controlled smoked cannabis. Clin Chem. 2013;59:1108–1117. doi: 10.1373/clinchem.2012.201467. [DOI] [PMC free article] [PubMed] [Google Scholar]
Associated Data
This section collects any data citations, data availability statements, or supplementary materials included in this article.
Supplementary Materials
Figure S1. Connections of the switching valve are shown. Left side: during sample load, the injector is connected to the online extraction column. With this setting, the sample is loaded onto the extraction column and cannabinoids are concentrated on the top of the extraction column, while salts and impurities are washed into the waste. After 1 minute, the cannabinoids are back-flushed onto the analytical column (right side of the diagram) and the gradient separating the analytes is run. After 6.2 minutes once the cannabinoids are eluted from the analytical column and are detected by the mass spectrometer, the switching valve is switched back to the loading setting (left side of the diagram) and the columns are re-equilibrated before the next injection.
Figure S2. Extraction column “break-through” and “carry-over” experiments. From left to right, the organic solvent concentration during the sample load was increased from 30% to 50% and up to 70% organic solvent (methanol/ 0.1% formic acid). The top three ion chromatograms show the transition m/z = 345 → 299 for THC-COOH and THC-C-gluc. The arrow in the third ion chromatogram of the top row shows the disappearance of THC-C-gluc indicating elution from the extraction column (“break-through”) during sample load and clean up at 70% organic solvent. The mid row shows the MS/MS signals of CBD as well as of the most lipophilic compounds THC and CBC after injection of the highest plasma calibrator. The bottom row of ion chromatograms shows the carry-over samples following the highest calibrators for the same compounds under the different loading conditions. In all ion chromatograms, the x-axis labels show the time in minutes and the y-axis labels the MS/MS detector response (intensity) in counts per second.
Figure S3. Ion suppression in plasma (A), urine (B), and their temporal relationship with phosphatidylcholine (PC) signals (C). For (A, B): The ion suppression effects of extracted biological matrix after extraction tested in electrospray ionization (ESI) and in atmospheric pressure chemical ionization mode (APCI) via continuous post-column infusion of cannabinoids (similar to Mueller et al. [37]). (C) Plasma samples as used in (A) were tested for PC species using ESI and the mass spectrometry settings for the detection of PC similar to those described by Little et al. [39]. In all ion chromatograms, the x-axis labels show the time in minutes and the y-axis labels the MS/MS detector response (intensity) in counts per second.
Figure S4. Representative extracted ion chromatograms of a (A) plasma sample with high cannabinoid concentrations and (B) plasma sample with no cannabinoids detected; (A) and (B) are both from the same study entitled “Colorado Cannabis Cohort: Efficacy, Safety, and Usage Patterns of Medical Marijuana for Sleep”; (C) plasma sample with high cannabivarin concentrations and (B) plasma sample with no cannabivarins detected; (C) and (D) are both from the same study entitled “Use of Medicinal Cannabinoids as Adjunctive Treatment for Medically Refractory Epilepsy.” (For details, see https://www.colorado.gov/pacific/cdphe/approved-medical-marijuana-research-grants). In all ion chromatograms, the x-axis labels show the time in minutes and the y-axis labels the MS/MS detector response (intensity) in counts per second.
Figure S5. Representative ion chromatograms of urine samples from CDPHE study participants. The extracted ion chromatograms of the ion transition m/z= 318.4 → 196.3 are shown. This transition detects THC-COOH and THC-gluc (due to in-source fragmentation). Urine A shows a typical extracted ion chromatogram after consumption of high-THC cannabis. Urine B shows a typical extracted ion chromatogram of urine after consumption of CBD oil. Since CBD has the same molecular weight as THC and CBD and THC metabolism are similar, it seems reasonable to expect that the signals in the region between 2.2 and 3.2 minutes represent CBD metabolites. In all ion chromatograms, the x-axis labels show the time in minutes and the y-axis labels the MS/MS detector response (intensity) in counts per second.