Abstract
The biopesticide used most effectively to control mosquito and blackfly vectors of human diseases worldwide is Bacillus thuringiensis subsp. israelensis. The high efficacy of this bacterium is due to synergistic interactions among four protein entomotoxins assembled individually into a single parasporal body (PB) during sporulation. Cyt1Aa, the primary synergist, is the most abundant toxin, comprising approximately 55% of the PB’s mass. The other proteins are Cry11Aa at ~35%, and Cry4Aa and Cry4Ba, which together account for the remaining ~10%. The molecular genetic basis for the comparatively large amount of Cyt1Aa synthesized is unknown. Here, in addition to the known strong BtI (σE) and BtII (σK) promoters, we demonstrate a third promoter (BtIII) that has high identity to the σE promoter of Bacillus subtilis, contributes to the large amount of Cyt1Aa synthesized. We also show that a cyt1Aa-BtIII construct was not functional in a σE-deficient strain of B. subtilis. Comparison of transcription levels and protein profiles for recombinant strains containing different combinations of BtI, BtII and BtIII, or each promoter alone, showed that BtIII is active throughout sporulation. We further demonstrate that a stable stem-loop in the 3’-untranslated region (3’-UTR, predicted ΔG = −27.6) contributes to the high level of Cyt1Aa synthesized.
Keywords: Bacillus thuringiensis subsp. israelensis, promoters, transcriptional terminator, 5’-UTR, 3’-UTR, cyt1Aa
Graphical Abstract
1. Introduction
The bacterium Bacillus thuringiensis subsp. israelensis produces a parasporal body (PB) highly toxic to larvae of nematocerous dipterans (Goldberg and Margalit, 1977; Schnepf et al., 1998). Its lethality to mosquitoes, blackflies and midges is due to synergistic interactions among four major PB proteins, three Cry toxins (Cry11Aa, Cry4Aa, Cry4Ba) and the lipophilic Cyt1Aa cytolytic toxin, the primary synergist (Wu and Chang, 1985; Ibarra and Federici, 1986; Crickmore et al., 1995). Cyt1Aa constitutes ~55% of the PB, whereas Cry11Aa accounts for ~35%, and Cry4Aa and Cry4Ba together account for the remaining ~10% (Federici et al., 1990; Wu and Federici, 1993; Dervyn et al., 1995; Diaz-Mendoza et al., 2012).
The molecular genetic basis for the comparatively large quantity of Cyt1Aa in the PB is unknown. Previous studies have identified several factors that influence Cyt1Aa synthesis, including the level of cyt1Aa expression, transcript stability, and co-synthesis of a 20-kDa helper protein, often referred to as a “chaperone-like” protein that prevents cytolysis of the host bacterial cell during Cyt1Aa synthesis (Adams et al., 1989; Wu and Federici, 1993; Baum and Malvar, 1995). Most studies of endotoxin synthesis in B. thuringiensis have focused on cry genes, for which transcription is typically controlled by two strong sporulation-dependent promoters (BtI and BtII) activated by σ factors that share high homology with, respectively, the σE and σK of Bacillus subtilis (Wong et al., 1983; Brown and Whiteley, 1988; 1990; Adams et al., 1991; Brown, 1993; Helmann and Moran, Jr., 2002). With respect to mRNA stability, a sequence referred to as STAB-SD was identified in the 5'-UTR of cry3A that enhances Cry3A synthesis (Agaisse and Lerelcus, 1996; Park et al., 1998). In addition, 3'-UTRs of most cry genes contain inverted repeats that form secondary structures (Agaisse and Lereclus, 1995) that stabilize corresponding mRNAs while also functioning as transcription terminators (Wong and Chang, 1986; Park et al., 2000). Trans factors that act during or after translation include the 20-kDa and 29-kDa helper proteins encoded by, respectively, the cry11Aa and cry2Aa operons. The 20-kDa protein enhances Cyt1Aa and Cry11Aa synthesis (McLean and Whiteley, 1987; Adams et al., 1989; Visick and Whiteley, 1991; Wu and Federici, 1993), whereas the 29-kDa protein apparently serves as a scaffold for Cry2Aa crystallization (Crickmore and Ellar, 1992; Ge et al., 1998). Finally, as yields of different Cry proteins synthesized with the same expression system vary markedly, biochemical characteristics of the protein itself, such as its primary structure and sensitivity to proteolytic degradation, affect yield and thus the amount of crystal toxins obtained per cell (Delécluse et al., 1993; Agaisse and Lereclus, 1995; Baum and Malvar, 1995; Park et al., 1999).
The accumulation of high levels of Cyt1Aa suggests that it may be less susceptible than Cry proteins to proteolysis. Moreover, it is also likely that cis and trans elements facilitate stability of its transcript and nascent protein. The BtI and BtII promoters and 20-kDa protein are, however, insufficient to explain the differentially large amount of Cyt1Aa relative to Cry4Aa, Cry4Ba and Cry11Aa in B. thuringiensis subsp. israelensis because these proteins are all encoded by genes regulated by these two promoter types, and synthesized in the presence of the 20-kDa protein (Yoshisue et al., 1993a; 1993b; Devyn et al., 1995; Wu and Federici, 1995; Poncet et al., 1997; Yoshisue et al., 1997). To determine whether other cis-acting elements affect Cyt1Aa synthesis and crystallization and might be genetically manipulated to lower this protein’s yield to improve PB toxicity, we constructed several recombinant cyt1Aa clones containing different combinations of its 5-UTRs and 3’-UTR sequences. In the present study we (i) identified a third functional σE promoter (BtIII), (ii) analyzed the effects of BtI, BtII, BtIII, and combinations of these, and (iii) evaluated the effect of the strong 3'-UTR stem loop on net synthesis of Cyt1Aa. Our data demonstrate specific genetic modifications of cyt1Aa can be used to control the amount of Cyt1Aa synthesized and size of the crystal it forms.
2. Materials and Methods
2.1. Bacterial strains and culture media
The DH5α strain of Escherichia coli (Bethesda Research Laboratories, Grand Island, NY) was used for cloning and amplifying plasmid DNA. The strains of B. thuringiensis and B. subtilis used in this study were obtained from the Bacillus Genetic Stock Center (Ohio State University, Columbus, OH). The acrystalliferous 4Q7 strain of B. thuringiensis subsp. israelensis was used for producing Cyt1Aa. Plasmid DNAs extracted from the crystalliferous 4Q5 strain of B. thuringiensis subsp. israelensis and the HD-73 strain of B. thuringiensis subsp. kurstaki were used, respectively, as templates to obtain cyt1Aa and the 20-kDa protein genes, and cry1Ac promoters. B. subtilis strains included σE (IS60; leuB8 spoIIG41 tal-1), σK (IS38; spoIIIC94 trpC2), and σF (IS86; sigF1 trpC2) mutants. The B. subtilis σG mutant strain (spoIIIGΔ1 trpC2) was a gift from Dr. Peter Setlow (Department of Molecular, Microbial, and Structural Biology, University of Connecticut Health Center, Farmington, CT). All strains were maintained on nutrient agar (Becton Dickinson, Sparks, MD) throughout the study. LB medium (Becton Dickinson, Sparks, MD) was used for growing E. coli and extracting plasmid DNA. For transformation of B. thuringiensis and B. subtilis, brain heart infusion medium (BHI; Becton Dickinson, Sparks, MD) was used to recover cells. The nutrient broth/glucose (NBG) medium (Park et al., 1999) was used for Cyt1Aa synthesis in B. thuringiensis. Erythromycin (25 μg/ml) and ampicillin (100 μg/ml) were used for selection when required.
2.2. PCR and plasmid construction
PCR primers used in this study are shown in Table 1, and PCR was performed using Vent (exo−) DNA polymerase (New England Biolabs, Beverly, MA). The thermal program was one cycle at 94 C for 5 min, followed by 30 cycles at 94 C for 1 min, 55 C for 1 min, 72 C for 3 min, and a final extension step at 72 C for 7 min. Amplicons were phosphorylated with T4 polynucleotide kinase (Biolabs) to facilitate ligation. The cyt1Aa gene, the cry1Ac promoters and the 20-kDa protein gene were amplified using plasmid DNAs of, respectively, the HD-73 and 4Q5 strains. Two separate amplicons were generated. One was the cry1Ac promoter region, amplified with primers 5'-CRY1Ac-P-F and 3'-CRY1Ac-P-R, which contains a SalI site at the 5’ end (143 bp). The other was the 20-kDa protein gene open reading frame (ORF) and its downstream transcription termination sequences that contain a PstI site at the 3’ end (1,247 bp), amplified with primers 5'-20kDa-F and 3'-20kDa-R. Both were inserted simultaneously into pUC19 (New England Biolabs, Beverly, MA). The fragment containing the cry1Ac promoter driving expression of 20-kDa protein gene (Pcry1Ac-20kda) was digested with SalI and PstI, and cloned into the same sites in pHT3101 (Lereclus et al., 1989).
Table 1.
Primers used for amplifying genes in this study.a
| Primer | Sequence (5’ to 3’) |
|---|---|
| CRY1Ac-P-F | acgcgtcgacGTTAACACCCTGGGTCAAAAATTGATA |
| CRY1Ac-P-R | ATCTCTTTTATTAAGATACCAATT |
| 20 kDa-F | ATTGGAGGATAATTGATGACAGAA |
| 20 kDa-R | aactgcagTTTAGGTCTTTAAAAATTAGAACCAA |
| CYT1-1-F | gctctagaTTTTCGATTTCAAATTTTCCAAACT |
| CYT1-2-F | gctctagaAGGAGGTATATTCAAGTATACA |
| CYT1-3-F | gctctagaCTATCAATTTAATTTATTATGTTAC |
| DBBT3 | ggctctagaTTTGATTAATAATTGCAAGTTTAAAATCAT |
| DBBT3M | ggctctagaTTTGATAAGCTTTTGCAAGTTTAAAATCATAATTTAATGTTGAAAGGCCACTA |
| DBBT3TB | ggctctagaTTTGATTAATAATTGCAAGTTTAAAATTTTAATTTAATGTTGAAAGGCCACTA |
| CYT1-4-F | gctctagaGAAAGGCCACTATTCTAATTAACTT |
| CYT1-R | acgcgtcgacTCGAAAAATGTGGATGTGTGAAGAACA |
| CYT1-sigE-F | ggcgagctcTTTTCGATTTCAAATTTTCCAAACT |
| CYT1-sigE-R | gctctagaTGTATACTTGAATATACCTCC |
| CYT1-sigK-F | ggcgagctcAGGAGGTATATTCAAGTATACA |
| CYT1-sigK-R | gctctagaGTAACATAATAAATTAAATTGATAG |
| Cyt-nostem-R | acgcgtcgacTTAGAGGGTTCCATTAATAGCGCTAGT |
| Cyt-11Astem-R | gctctagaTTAGAGGGTTCCATTAATAGCGCTAGT |
| 11Astem-F | gctctagaAAGTCATGTTAGCACAAGAGGAGTGA |
| 11Astem-R | acgcgtcgacCATATGTTTTAAACAATTATTAGAA |
The restriction endonuclease sites were underlined: SalI for CRY1Ac-P-F, PstI for 20 kDa-R, XbaI for all CYT1-F, CYT1-sigE-R, CYT1-sigK-R, Cyt-11Astem-R, and 11Astem-F, SalI for CYT1-R, Cyt1-nostem-R, and 11Atem-R, SacI for CYT1-sigE-F and CYT1-sigK-F, and ClaI for SL-1 and SL-2.
To obtain the cyt1Aa gene containing different combinations of its BtI, BtII and BtIII promoters, four forward primers were used with the same reverse primer (CYT1-R). The four cyt1Aa amplicons, each containing a different length of the upstream promoter region [1,408 bp (primer CYT1-1-F), 1,144 bp (primer CYT1-2-F), 1,013 bp (primer CYT1-3-F) and 941 bp (primer CYT1-4-F)] were digested with XbaI and SalI and introduced into the same sites in pHT3101 containing Pcry1Ac-20kda. The resulting plasmids containing these constructs were named, respectively, pSF123 (9,556 bp), pSF23 (9,292 bp), pSF3 (9,161 bp), and pSF (9,089 bp), harboring, respectively, BtI, BtII and BtIII, BtII and BtIII, BtIII, and no promoters (Fig. 1 and 2). Plasmids with only BtI (pSF1, 9375 bp) or BtII promoter (pSF2, 9240 bp) or BtI+II (pSF12, 9509 bp) were constructed using the following two steps: (i) three separate fragments containing the BtI (286 bp), or BtII (151 bp), or BtI+II (420 bp) promoter region were amplified by PCR with CYT1-sigE-F and CYT1-sigE-R, or CYT1-sigK-F and CYT1-sigK-R, or CYT1-sigE-F and CYT1-sigK-R, respectively, and (ii) these 3 amplicons were digested with SacI and XbaI and cloned separately into the same sites in pSF which included the cyt1Aa ORF without the promoter region, and Pcry1Ac-20kda (Figs. 1 and 2).
Fig. 1.
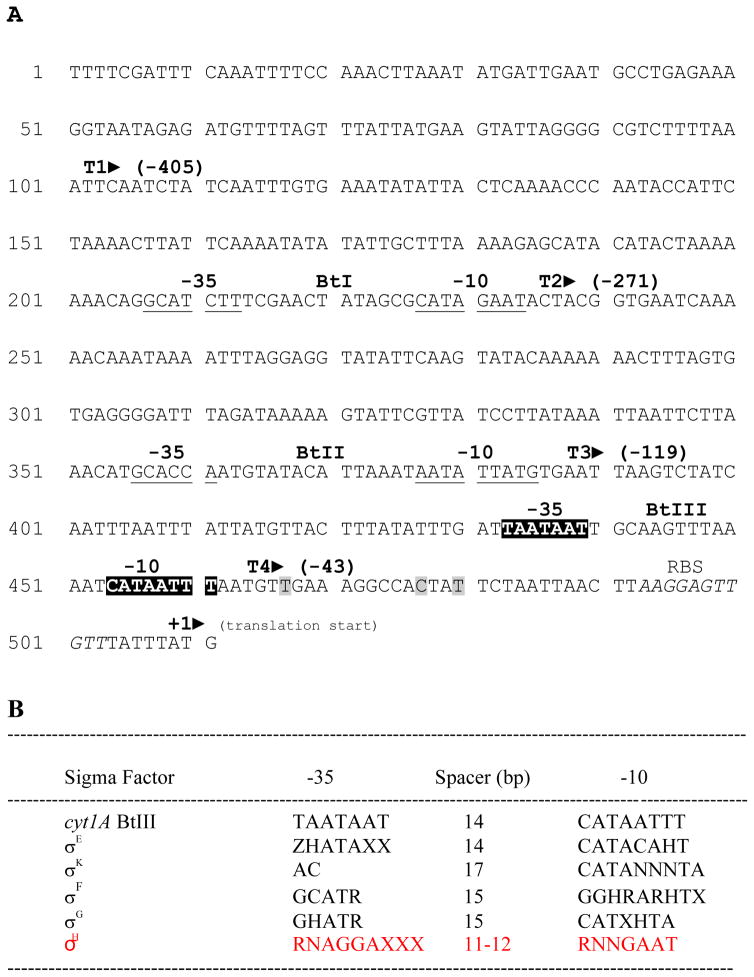
Functional cis elements in the 5’-untranslated region (5’-UTR) of cyt1Aa. A. Nucleotide sequence of the 5'-UTR of the cyt1Aa gene. The six known transcript start sites (T1, T2, T3, T4, T5, T6) identified in this and previous work are shown, as are the -35 and -10 sequences of BtI and BtII promoters (underlined), and the BtIII promoter (black background) identified in this study. The ribosome binding site (RBS, italicized) and Cyt1Aa translation initiation codon (=1, ATG) are also shown. B. Comparison of the cyt1Aa BtIII promoter region with that of the σE, σK, σF and σG regions of B. subtilis. H, A or C; N, A, G, C or T; R, A or G; X, A or T; Z, T or G.
Fig. 2.
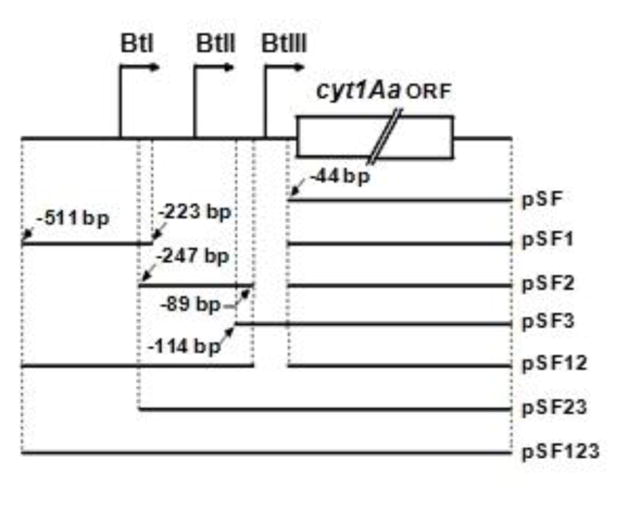
Schematic illustration of the seven cyt1A promoter constructs used to synthesize Cyt1Aa. The 5’ starting and 3’ ending points from the translational start site of the fragments used for each construct are indicated. The location of each cyt1A promoter (BtI, BtII and BtIII) is identified with an arrow.
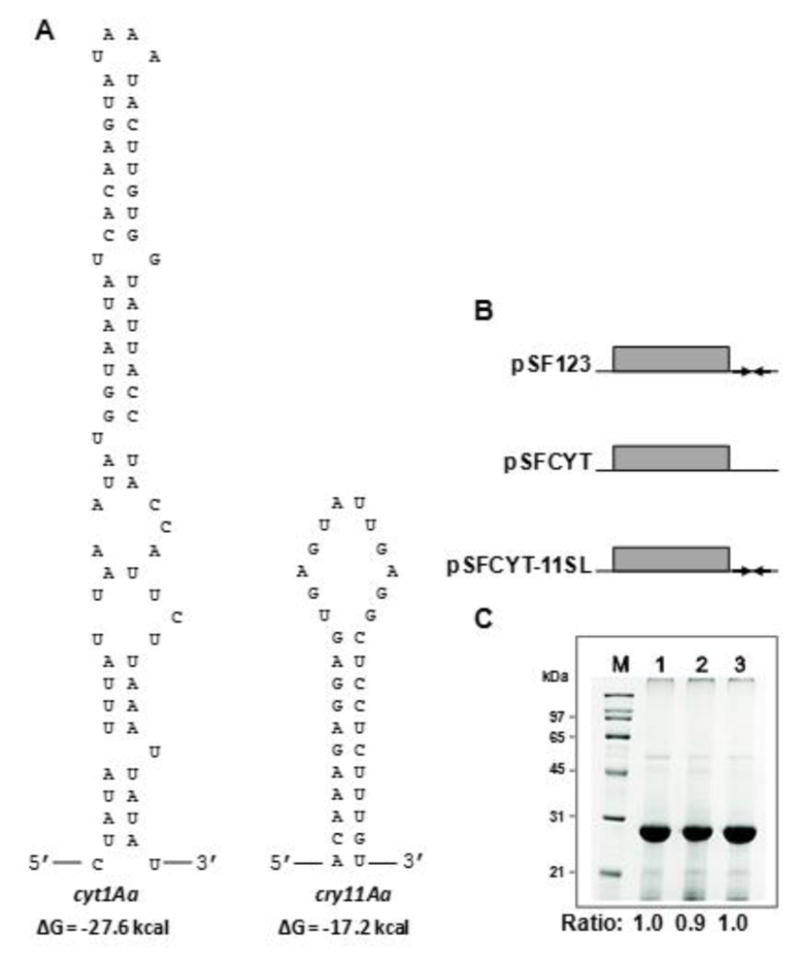
In addition, constructs were made to determine the effects of either the absence of the cyt1Aa 3’-UTR stem loop or the presence of the weaker cry11Aa 3’-UTR stem loop (see Fig. 8) on Cyt1Aa synthesis. The plasmid without the cyt1Aa stem-loop (pSFCYT, 9,406 bp) was constructed by the following two steps: (i) a cyt1Aa fragment without its own stem-loop structure was amplified with CYT1-1-F and Cyt-nostem-R primers, and (ii) the amplicon was digested with XbaI and SalI and ligated to the same sites in pHT3101, which contained the Pcry1Ac-20kda. The plasmid containing the cyt1Aa ORF with the cry11Aa stem loop at the 3’ end (pSFCYT-11SL, 9,606 bp) was obtained as follows: (i) a fragment containing a cry11Aa stem-loop structure (200 bp) was amplified with 11Astem-F and 11Astem-R using pWF53 (Wu and Federici, 1995) as the template, (ii) the amplicon was digested with XbaI and SalI and ligated to the same sites in pUC19 which contained Pcry1Ac-20kda, (iii) the cry11Aa stem loop/Pcry1Ac-20kda construct was digested with XbaI and PstI and ligated to the same sites in pHT3101, (iv) a fragment of cyt1Aa ORF that lacks its own stem loop structure at the 3’ end was amplified with CYT1-sigE-F and CYT-11Astem-R, and (v) the amplicon was digested with SacI and XbaI and ligated to the same sites in pHT3101 which included the cry11Aa stem loop and Pcry1Ac-20kda. The integrity of each construct was confirmed by restriction and nucleotide sequence analyses.
Fig. 8.
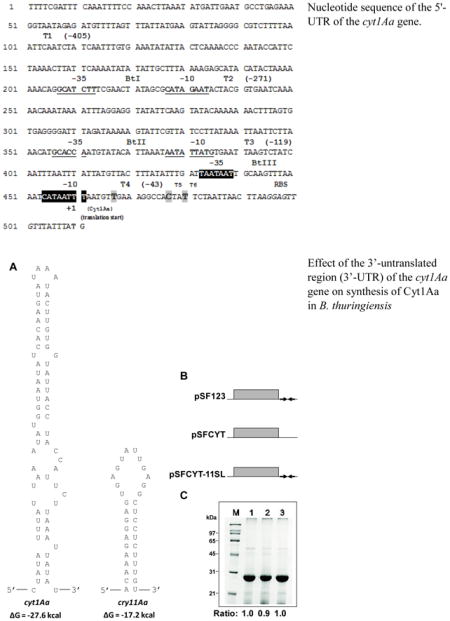
Effect of the 3’-untranslated region (3’-UTR) of the cyt1Aa gene on synthesis of Cyt1Aa in B. thuringiensis. A. Putative stem-loop structures formed at the 3’-ends of cyt1Aa and cry11Aa mRNAs, with a predicted ΔG value of -27.6 and -17.2 kcal as determined by the method of Tinoco et al. (Ge, 1999). B. Constructs used to test the effect of 3’-flanking regions of the cyt1Aa gene on the production of Cyt1Aa proteins in B. thuringiensis by replacing the cyt1Aa terminator with cry11Aa terminator. Plasmid pSFCYT, cyt1Aa gene lacking its terminator; pSF123, cyt1Aa gene with its own terminator and pSFCYT-11SL, cyt1Aa gene with native terminator replaced with the terminator from the cry11As gene. C. SDS-12% PAGE analysis of the relative level of Cyt1Aa proteins from the same volume of B. thuringiensis 4Q7 cell cultures with different constructs. Lane M, protein marker; lane 1, the strain harboring plasmid that has cyt1Aa with its own 3’ termination sequence [pSF123]; lane 2, the strain harboring plasmid that has cry11Aa without its own 3’ termination sequence [pSFCYT]; lane 3, the strain harboring plasmid that has cyt1Aa with the cry11Aa 3’ termination sequence [pSFCYT-11SL]. The rations at the bottom of the lanes were determined by densitometry scanning of the gel.
2.3. RNA analyses
Each B. thuringiensis strain with the different number of promoters was grown in 4 ml of BHI medium overnight and 100 μl of the pre-culture was used to inoculate 50 ml NBG broth. Ten ml from each culture was harvested at 16, 19, 22, 25, 28, 31, 34, and 37 h post inoculation (p.i.). These sampling time points were chosen based on a preliminary experiment in which cell development and sporulation were monitored using phase contrast microscopy, and Cyt1Aa synthesis assessed by SDS-PAGE analysis. At 28 h p.i., bipyramidal Cyt1Aa crystals and spores were observed in all strains with promoters, and spores only in the control strain lacking cyt1Aa promoters (4Q7/pSF). To extract total RNA, cells were centrifuged at 5,500 g at 4°C for 15 min. Lysozyme (10 mg/ml) was added to cell pellets and the content was mixed thoroughly and incubated at 37°C for 1 h. The mixture was suspended in 1 ml of TRIzol® reagent (Invitrogen, Carlsbad, CA) and 600 μl aliquots were transferred to 2 ml microcentrifuge tubes. The solution was mixed thoroughly and incubated at room temperature for 5 min. Then, 200 μl of chloroform was added, mixed thoroughly, incubated at room temperature for 3 min, and centrifuged at 15,000 g at 4°C for 15 min, after which the aqueous phase was transferred to fresh microcentrifuge tubes. The addition of TRIzol® and chloroform, followed by the centrifugation described above, was repeated once. The aqueous phase was transferred to fresh tubes and an equal volume of isopropanol was added, then the samples were centrifuged at 16,000 g at 4°C for 10 min. Precipitates were washed with 75% ethanol, centrifuged at 6,300 g at 4°C for 5 min, dried, and dissolved in 100 μl of DEPC-treated double-distilled water. RNA concentrations were determined by absorbance at 260/280 nm with a spectrophotometer (DU® 530, Beckman Coulter, Fullerton, CA). RNA analyses were performed as described previously (Park et al., 1998) with minor modifications, i.e., 5 μg of each RNA sample was blotted and antisense-cyt1Aa DNA probe was used, and intensities were quantified using the AlphaImager 2200 (Alpha Innotech Corp., San Leandro, CA). For statistical analyses, at least three separate replicate experiments were performed, each on different days, using different cultures.
2.4. BtIII transcripts
The 5’ transcription initiation site of the mRNA synthesized from the BtIII promoter was determined using the protocol described by Zhang and Chiang (1996). Briefly, DNAse I-treated RNAs were reversed transcribed using reverse primer MDMcyt1R (5’-CAAAATCTGTAGAAGTGGGAACTAATGC-3’; complementary positions 220 to 193 downstream from the translational start site of the cyt1Aa open reading frame) and the ProtoScript kit (Biolabs) according to manufacturer’s protocol. RNA was removed by treatment with RNAse H (Invitrogen), and single-stranded (ss) cDNA was fractionated in a 2% agarose gel and purified using the QIAquick Gel Extraction kit (Qiagen). Oligo B (phosphorylated 5’AGGGTGCCAACCTCTTCAAG-3’) was ligated to the 5’ end of ss cDNA using T4 RNA ligase (New England Biolab) according to manufacturer’s protocol. PCR was performed with Taq DNA polymerase (Promega) and the ss cDNA and RNA preparation (negative control) using a nested primer (DBGEcytIIR, 5’-CTTGCTGTTGATTGAGGG-3’; complementary positions 74 to 56 downstream from the translational start site of the cyt1Aa open reading frame, and Primer C (5’-CTTGAAGAGGTTGGCACCCT-3’, complement of Oligo B). The PCR product was separated in 2% agarose, purified with the Gel Extraction kit, and cloned in pGEM-T Easy (Promega) for nucleotide sequencing at the IIGB Instrumentation Facilities, Institute for Integrative Genome Biology, University of California, Riverside. Several clones were sequenced to determine the transcription initiation site.
2.5. Site-directed mutagenesis of BtIII promoter
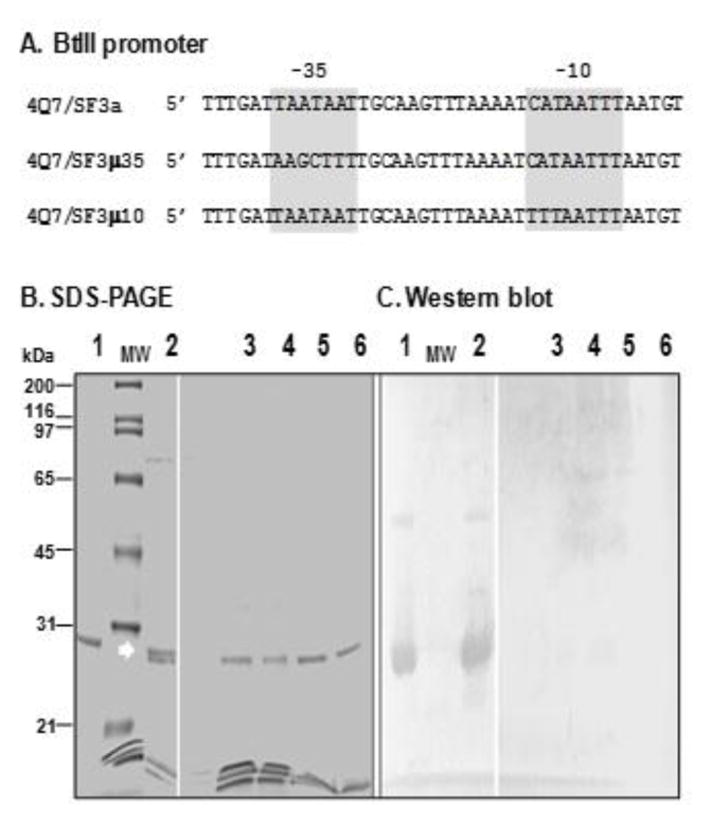
Base substitutions in the putative -35 and -10 sequences were performed using primer pairs DBBT3M and CYT1-R and DBBT3TB and CYT1-R, and the wild-type sequence with primers DBBT3 and CYT1-R (Table 1, Fig. 6) and Phire HotStart II polymerase (Thermo Scientific). The amplicons were digested with XbaI and SalI and cloned in the same sites in pSF3. The integrity of constructs was confirmed by nucleotide sequence analysis. The 4Q7 strain was electroporated with the resulting plasmids and tranformants 4Q7/SF3μ35 (mutated BtIII -35 box), 4Q7/SF3μ10 (mutated BtIII -10 box) and 4Q7/SF3a (wild-type BtIII -35 and -10 boxes) (Fig. 6) were selected as described above.
Fig. 6.
The -35 and -10 boxes are essential cis elements in BtIII for synthesis of Cyt1Aa. (A) Strains harboring cyt1Aa constructs with native -35 and -10 sequences (4Q7/SF3a), and nucleotide substitutions in -35 (4Q7/SF3μ35) and -10 (4Q7/SF3μ10). Recombinant strains were grown for 48 hr at which time >95% of cells sporulated and lysed and replicate culture samples were analyzed by SDS-PAGE (B) and Western blot analysis (C) for the presence of Cyt1Aa; purified Cyt1Aa (lane 1), 4Q7/SF3a (Cyt1Aa crystal observed by microscopy, lane 2), 4Q7/SF3μ35 (acrystalliferous, lanes 3, 4), 4Q7/SF3μ10 (acrystalliferous, lanes 5, 6); MW, molecular mass standards. Arrow, location of Cyt1Aa (top band) of the doublet.
2.6. Scanning electron microscopy and quantification of protein synthesis by B. thuringiensis
After obtaining synchronous populations by pre-culturing in BHI medium, each strain was grown in 50 ml of NBG medium at 30 C for 5 days to obtain spores and crystals from lysed cells. For scanning electron microscopy, Cyt1Aa crystals were purified as previously described (Park and Federici, 2000), and micrographs were taken with a Philips XL30-FEG scanning electron microscope to determine crystal shape and size. Of a total of 45 to 105 crystal images per construct, 20 whose axes were exactly or nearly at 90 degree to the field of the view were selected for measurement for each strain.
For protein gels, one ml or 500 μl of lysed culture was centrifuged at 10,000 g for 5 min. The pellet was re-suspended in 60 μl of 5x sample buffer (Laemmli, 1970) and boiled for 5 min, then centrifuged at 10,000 g for 5 min. Ten μl of each supernatant was fractionated by sodium dodecyl sulfate-polyacrylamide gel electrophoresis (SDS-PAGE) in a 12% gel and bands were visualized by Coomassie blue staining. To normalize the amount of Cyt1Aa produced by each strain, 12% SDS-PAGE was performed using series of diluted bovine serum albumin (BSA; New England Biolabs, Beverly, MA) with known amounts and scanned. The standard curve was created using the values obtained from the known BSA concentrations to estimate Cyt1Aa yield. All protein gels from five separate experiments were analyzed with an AlphaImager 2200 (Alpha Innotech Corp., San Leandro, CA) as described previously (Park et al., 2000), and representative results are shown here.
2.7. Spore counts
Viable spore counts were determined as previously described (Park et al., 1998). Briefly, cells were grown in 50 ml of NBG in 250-ml flasks shaken at 250 rpm for 5 days at 30°C. A 1-ml volume of the culture was then placed in a 1.5-ml tube, heated at 60°C for 20 min, diluted, and plated on nutrient agar. Colonies were counted after 12 h of growth at 30°C. Three replicates were performed and data were analyzed with the Super ANOVA program (Abacus Concepts, Berkeley, Calif.).
2.8. Statistical analyses
Statistical analyses were performed to determine Cyt1Aa’s crystal size, spore count, Cyt1Aa and Cry11Aa yields on SDS-PAGE, and RNA dot blot by using Duncan new multiple range and Tukey-Kramer methods with the Super ANOVA program (Abacus Concepts, Berkeley, CA).
2.9. Cyt1Aa synthesis in σ factor mutant strains of B. subtilis
The four asporogenic σ factor-deficient mutant strains of B. subtilis were transformed with pSF3, which contained the BtIII promoter to drive expression of cyt1Aa and Pcry1Ac-20kda. Transformants were grown in 25 ml of GYS medium [0.1% glucose, 0.2% yeast extract, 0.05% K2HPO4, 0.2% (NH4) 2SO4, 0.002% MgSO4, 0.005% MnSO4, 0.008% CaCl2] at 30 C for 3 days. Yields of Cyt1Aa were examined as described above for B. thuringiensis, except that 4 to 6 ml of the cultures was subjected to 12% SDS-PAGE analysis. Western blot was performed to detect Cyt1Aa using rabbit anti-Cyt1Aa antibody, as described previously (Park et al., 2000).
3. Results
3.1. BtIII is a third functional promoter for cyt1Aa
To identify potential promoters that B. thuringiensis σ factors might recognize, the nucleotide sequence of the 5’-UTR of cyt1Aa was examined, focusing on sequences immediately upstream from the four different transcripts reported previously (Waalwijk et al., 1985; Ward and Ellar, 1986; Ward et al., 1986; Dervyn et al., 1995). No easily recognizable promoter sequences were found immediately upstream from the transcriptional start site [T1] identified by Ward and Ellar (1986) in E. coli (Fig. 1A). However, the -35 and -10 sequences conserved among known BtI and BtII promoters were found immediately upstream from the transcripts mapped at, respectively, -271 bp (T2), as identified in B. thuringiensis and E. coli (Ward and Ellar, 1986; Dervyn et al., 1995), and -119 bp (T3), as identified in B. thuringiensis and B. subtilis (Ward and Ellar, 1986; Dervyn et al., 1995), from the translational start site (Fig. 1A). When the nucleotide sequence between the transcripts starting at -119 bp (T3) and -43 bp (T4) (Waalwijk et al., 1985; Ward et al., 1986) was examined (Fig. 2A, B), a possible third promoter (BtIII) sequence was identified. The putative BtIII -35 (TAATAAT)and -10 (CATAATTT) boxes, separated by 14 bases, showed high identity of, respectively, 100% and 75%, with the consensus sequence [(T/A)(A/C)ATA(A/T)(A/T)–14 bp–(CATACA(A/C)T] of promoters recognized by B. subtilis σE (Haldenwang, 1995; Helmann and Moran, Jr., 2002; Makita et al., 2004).
To determine whether BtIII was functional, a series of constructs was generated to compare transcription and Cyt1Aa synthesis directed by this promoter alone, either BtI or BtII, and combinations of these, i.e., BtI+II, or BtII+III and BtI+II+III (Figs. 1 and 2). Each of these constructs was electroporated into 4Q7, after which transcription and Cyt1Aa crystal formation were monitored during sporulation of the following recombinants: BtI+II+III (4Q7/pSF123), BtI+II (4Q7/pSF12), BtII+III (4Q7/pSF23), BtI (4Q7/pSF1), BtII (4Q7/pSF2), BtIII (4Q7/pSF3), and a control lacking BtI, BtII and BtIII to drive cyt1Aa expression (4Q7/pSF). Analyses of RNAs obtained from three separate experiments of cultures grown on three different days were performed to determine relative cyt1Aa transcript levels for these strains (Figs. 2 and 3). The cyt1Aa transcript was not detected in preparations from 4Q7/pSF. Promoters in the remaining 6 strains were functional, as cyt1Aa-specific transcripts were detected throughout the sporulation phase of growth (16-37 h). Apparent maximal transcript levels were noted at ~31 h with BtI+II+III (4Q7/pSF123), BtI+II (4Q7/pSF12) and BtI (4Q7/pSF1). For BtII+III (4Q7/pSF23) and BtII (4Q7/pSF2), increases in transcript levels were still observed ~37 h, the maximum time surveyed in this study; based on the trend indicated by the graphs it is likely that increases in these two transcripts continued after this time (Fig. 3). For BtIII (4Q7/pSF3), the cyt1Aa transcript levels were consistently lower when compared to the other constructs, especially from ~30–37 h, with the exception of BtII (4Q7/pSF2), for which the lowest levels were observed from 20–27 h (Fig. 3). Regardless, the results clearly demonstrated that BtIII contained functional cis elements active throughout sporulation.
Fig. 3.
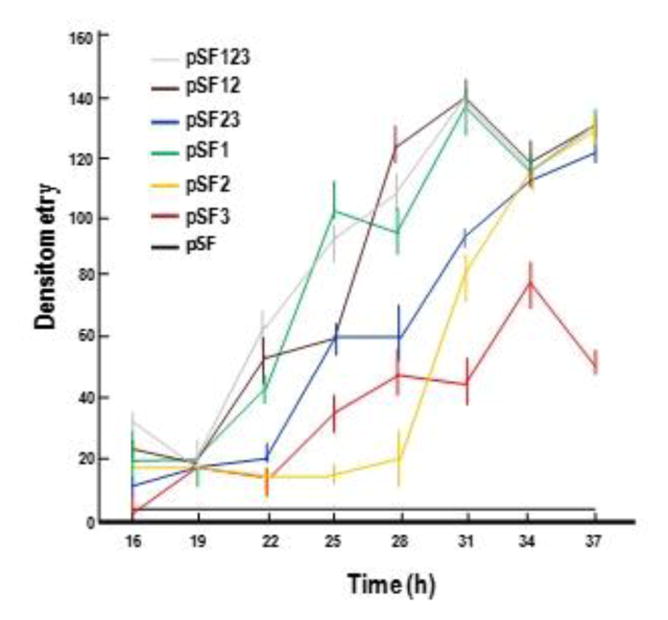
Densitometry of cyt1Aa transcripts from triplicate assays detected in various strains harboring different promoter (BtI, BtII, BtIII) constructs; pSF123 (BtI+II+III); pSF12 (BtI+II); pSF23 (BtII+III); pSF1 (BtI), pSF2 (BtII), pSF3 (BtIII); pSF (no promoter).
3.2. Structural characteristics of Cyt1Aa crystals synthesized using different promoter constructs
When grown under the same conditions, each strain harboring a different promoter construct produced Cyt1Aa crystals (Fig. 4). Cyt1Aa crystals were absent in 4Q7/pSF, which lacked the BtI, BtII and BtIII promoters. The shapes and sizes of Cyt1Aa crystals produced by expression of each promoter construct were determined by scanning electron microscopy (Fig. 4). All crystals had the bipyramidal shape characteristic of Cyt1Aa (Wu and Federici, 1993). However, statistically significant differences in size were observed among the crystals produced in different strains (Table 2). These experiments demonstrated that the BtIII promoter alone was capable of driving the synthesis of a significant quantity of Cyt1Aa, as assessed by crystal size, even though the crystals produced using this promoter were smaller than those produced by the other constructs. Specifically, the length and width of crystals produced in BtIII (4Q7/pSF3) were about 6–31% and 7–33% shorter than, respectively, those produced in BtII (4Q7/pSF2) and BtI (4Q7/pSF1). Interestingly, crystals produced in BtI+II (4Q7/pSF12) were significantly larger than those produced using all three promoters, but they were not significantly different in size compared to those produced using BtI alone. Larger crystals were observed in the strain with the BtI promoter (4Q7/pSF1), compared with those BtII (4Q7/pSF2) or BtIII (4Q7/pSF3) (Table 2).
Fig. 4.
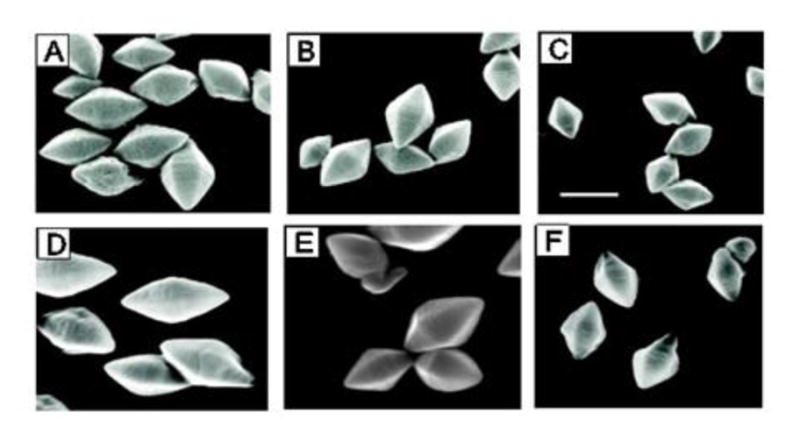
Scanning electron micrographs of Cyt1Aa crystals produced using the four different promoter constructs. A. Crystals produced using the 511 bp upstream sequence that contains all three promoters (BtI, BtII and BtIII; 4Q7/pSF123); B. Crystals produced using the 247 bp upstream sequence that contains only BtII and BtIII (4Q7/pSF23); C. Crystals produced using the 116 bp upstream sequence that contains only BtIII (4Q7/pSF3); D. Crystals produced using the 420 bp upstream sequence that contains only BtI and BtII (4Q7/pSF12); E. Crystals produced using the 286 bp upstream sequence that contains only BtI (4Q7/pSF1); F. Crystals produced using the 151 bp upstream sequence that contains only BtII (4Q7/pSF2). A bar indicates 1 μm and all micrographs are of the same magnification.
Table 2.
Dimensions and estimated volumes of Cyt1A crystals, mean number of spores produced per ml and estimated quantities of Cyt1A produced by different promoter constructs in Bacillus thuringiensisa
| Promoter Combinationb | Length ± SD μm | Width ± SD μm | Volume μm3c | Spores/ml x 105 (± SD X 105)d | Relative Ratio | Cyt1A per ml of culture (±SD) (μg)e | Cyt1A per spore (± SD) (pg)f | Ratiog |
|---|---|---|---|---|---|---|---|---|
| BtI+BtII+BtIII | 1.11 ± 0.10 a | 0.65 ± 0.08 d | 0.20 ± 0.07 g | 20.2 (1.2) a | 0.45 | 63.4 ± 1.1 a | 31.4 ± 0.6 f | 2.9 |
| BtI+BtII | 1.15 ± 0.14 a | 0.81 ± 0.06 e | 0.33 ± 0.09 h | 9.3 (1.1) b | 0.21 | 52.0 ±0.0 b | 56.1 ± 0.0 g | 5.2 |
| BtII+BtIII | 0.98 ± 0.15 b | 0.63 ± 0.10 d | 0.18 ± 0.08 g | 21.1 (2.3) a | 0.47 | 54.0 ±1.1 c | 25.7 ± 0.5 h | 2.4 |
| BtI | 1.08 ± 0.11 a | 0.77 ± 0.08 e | 0.28 ± 0.10 h | 16.9 (0.6) c | 0.37 | 54.5 ±0.9 c | 32.3 ± 0.5 i | 3.0 |
| BtII | 0.84 ± 0.10 c | 0.58 ± 0.08 f | 0.13 ± 0.05 i | 31.8 (1.1) d | 0.70 | 43.6 ± 0.4 d | 13.7 ± 0.1j | 1.3 |
| BtIII | 0.79 ± 0.13 c | 0.54 ± 0.07 f | 0.10 ± 0.04 j | 45.2 (2.1) e | 1.0 | 48.8 ± 0.9 e | 10.8 ± 0.2 k | 1.0 |
Of a total of 45 to 105 crystal images per construct from the same batch culture, 20 crystals from each strain were selected for the measurement of sizes. Mean values for crystal dimensions were calculated separately (n = 20) from measurements made on scanning electron micrographs. Values followed by different letters were significantly different at P = 0.05.
The names of the corresponding plasmids from the top to the bottom of the column are pSF123, pSF12, pSF23, pSF1, pSF2 and pSF3, respectively.
The volume of crystals was estimated based on twice the volume of a regular hexagonal pyramid, which is calculated by V = 1/3 x area of hexagon x height. The width was used to calculate the area of the hexagon and the length was used for height.
Mean values were determined based on three replicates. Values followed by different letters are significantly different at P = 0.05.
Values were calculated based on the SDS-PAGE gel shown in Fig. 5 using a standard curve developed using series of diluted bovine serum albumin. Mean values were determined based on three replicates. Values followed by different letters are significantly different at P = 0.05.
Values were calculated by dividing the quantity of Cyt1A produced per ml of culture in this table by the number of spores produced per ml of culture. Mean values were determined based on three replicates. Values followed by different letters are significantly different at P = 0.05
The relative quantity of Cyt1A per spore was calculated giving the amount produced by 4Q7/pSF3 an arbitrary value of 1.
In addition to measuring the size of crystals produced by each construct, the level of Cyt1Aa synthesis in each strain was assessed using protein profiles obtained by SDS-PAGE in 3 separate experiments (Fig. 5). Overall, a similar trend was observed among these experiments, with values from representative experiments reported here. Cyt1Aa was not produced in the strain lacking a Bt promoter (4Q7/pSF). The BtIII promoter strain (4Q7/pSF3) produced approximately 6–23% lower amounts of Cyt1Aa than that produced by most of the other strains. Interestingly, however, ~12% more Cyt1Aa was produced per unit medium by this strain compared to the BtII strain. Furthermore, as determined by SDS-PAGE, no significant difference in Cyt1Aa synthesis was observed by BtI (4Q7/pSF1), BtII (4Q7/pSF2) and BtIII (4Q7/pSF3) from day 2 to day 5 (data not shown).
Fig. 5.
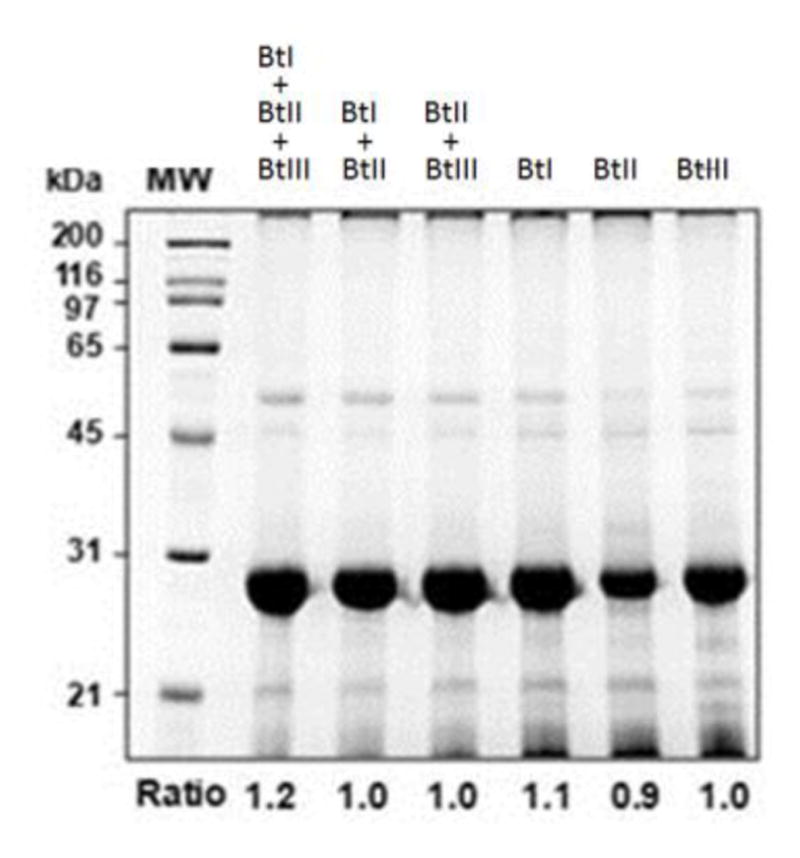
Analysis of Cyt1Aa protein synthesis by SDS-PAGE in B. thuringiensis using different promoter constructs. Lane M, protein markers; lane 1, Strain with the 511 bp upstream sequence that contains all three promoters (BtI, BtII and BtIII; 4Q7/pSF123); lane 2, Strain with 420bp upstream sequence that contains BtI and BtII (4Q7/pSF12); lane 3, Strain with the 247 bp upstream sequence that contains only BtII and BtIII (4Q7/pSF23); lane 4, Strain with the 286 bp upstream sequence that contains only BtI (4Q7/pSF1); lane 5, Strain with the 151 bp upstream sequence that contains only BtII (4Q7/pSF2); lane 6, Strain with the 116 bp upstream sequence that contains only BtIII (4Q7/pSF3). Relative ratio of Cyt1Aa production for each strain is shown at the bottom of the gel. This gel is a representative of results obtained in five separate replications.
To explain the discrepancy between the yield of Cyt1Aa protein and the size of the crystals obtained with the different promoter constructs, the number of spores produced per unit medium by each strain was determined. The strain (4Q7/pSF3) that synthesized the smallest crystals using the BtIII promoter alone produced more viable spores when compared to the other recombinants, for which the relative spore counts were 0.45 (BtI+II+III), 0.21 (BtI+II), 0.47 (BtII+III), 0.37 (BtI) and 0.7 (BtII) (Table 2). In addition, the amount of Cyt1Aa synthesized per spore in each recombinant was quantified (Table 2) using a standard curve based on known concentrations of bovine serum albumin (BSA), SDS-PAGE gel analysis of Cyt1Aa (Fig. 5), and the number of spores produced (Table 2). The collective data showed the yield was significantly lower with BtIII when compared with BtI/BtIII, with a relative ratio of 1:5.2, and interestingly when compared with BtI/BtII/BtIII the ratio was 1:2.9. Furthermore, the yields of Cyt1Aa protein per spore correlated well with crystal size, i.e., the smaller the crystal, the higher the number of spores (Table 2).
3.3 BtIII transcripts
In addition to the transcript T4 (6 bases downstream from the -10 box) previously reported (Waalwijk et al., 1985; Ward et al., 1986), two additional transcripts were identified in BtIII (4Q7/pSF3) (Fig. 1). T5 and T6 mapped at, respectively, 16 and 19 bases downstream from the -10 box. Based on their relative distances from the putative -10 sequence of BtIII, it is possible that T5 and T6 are degradation products of the T4 transcript.
3.4. BtIII -35 and -10 sequences are essential cis elements of a σE-specific promoter
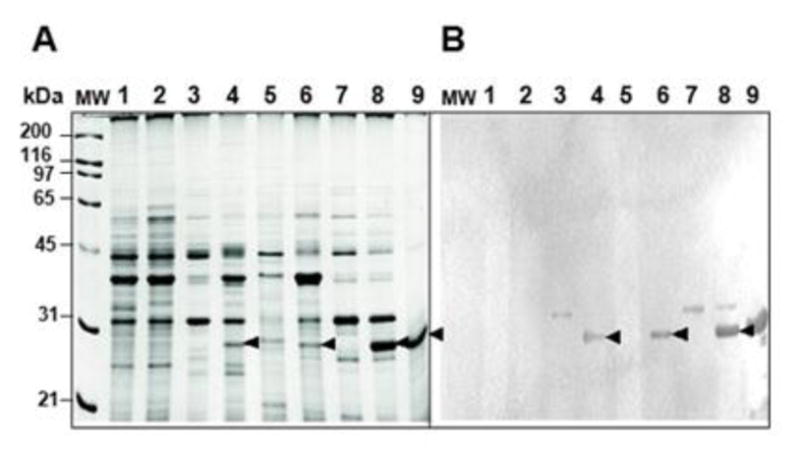
Comparison of the -35 and -10 consensus regions of the BtIII promoter with those promoters of B. subtilis (Fig. 1) suggested that this third promoter could be activated by σE-like factors. As cyt1Aa-specific transcripts were detected in B. subtilis (Ward et al., 1986), we utilized mutant strains of this species each lacking a known functional σ factor gene. The high homology and spacing of BtIII’s proposed -35 and -10 boxes to corresponding consensus sequences of B. subtilis (Fig. 1) strongly suggested these were essential for promoter function. Therefore, multiple site-specific nucleotide base substitutions were introduced in either the -35 or -10 box (Fig. 6A). Strains transformed with the mutant constructs (4Q7/pSF3μ35 and 4Q7/pSF3μ10) lacked visible crystals, and little or no Cyt1A was detected by Western blot analyses (Fig. 6B).
Mutants of B. subtilis each deficient in a specific σ factor were transformed with the BtIII promoter construct, pSF3, and Cyt1Aa synthesis of transformants was analyzed by SDS-PAGE and Western blot analysis to determine whether the BtIII was recognized by σE, σK, σF or σG factor. The presence of Cyt1Aa was observed in all strains except for the σE-deficient strain (Fig. 7).
Fig. 7.
Analysis of Cyt1Aa synthesis in B. subtilis σ-deficient mutants transformed with pSF3 that contains the BtIII promoter for expression of cyt1Aa. A. SDS-PAGE analysis of B. subtilis strains grown in GYS medium. B. Western blot analysis of Panel A using antibody raised against Cyt1Aa. Lane M, protein markers; lane 1, 1S60 (σE mutant); lane 2, 1S60 with BtIII; lane 3, 1S38 (σK mutant); lane 4, 1S38 with BtIII; lane 5, 1S86 (σF mutant); lane 6, 1S86 with BtIII; lane 7, spoIIIGΔ1 (σG mutant); lane 8, spoIIIGΔ1 with BtIII; lane 9, B. thuringiensis 4Q7 harboring BtIII. Arrowhead indicates the 27-kDa Cyt1A protein band.
3.5. Role of cyt1Aa 3’-UTR stem loop on Cyt1Aa synthesis
To determine whether the cyt1Aa 3’-UTR stem-loop contributed to high level of Cyt1Aa synthesis, potentially by stabilizing cyt1Aa mRNA, the following plasmid vectors were constructed: (i) pSFCYT in which cyt1Aa ORF was under the control of its three promoters but lacked its 3’ stem loop, and (ii) pSFCYT-11SL in which cyt1Aa ORF was under the control of its three promoters, but its native 3’ stem loop was substituted with the weaker stem-loop of the cry11Aa operon (Fig. 8A, B). The production of Cyt1Aa resulting from these two constructs was compared with that of BtI+II+III strain that contained the native 3’ stem-loop (Fig. 8C). Results of triplicate cultures showed Cyt1Aa synthesis per unit medium by 4Q7/pSFCYT (no stem-loop; lane 2) was approximately 10% less than that that produced by 4Q7/pSF123 and 4Q7/pSFCYT-11SL, both of which produced similar amounts of the toxin.
4. Discussion
In this study we demonstrated that cyt1Aa contains a previously unknown third functional promoter (BtIII). Earlier studies of the 5’-UTR of cyt1Aa suggested expression of this gene was primarily under control of typical tandem BtI and BtII promoters activated by, respectively, σE and σK transcription factors (Brown and Whiteley, 1988; 1990; Baum and Malvar, 1995; Dervyn et al., 1995). Four different transcripts, with only two attributed to BtI and BtII promoter (Fig. 1A), were identified in heterologous and native genetic backgrounds, respectively, E. coli and B. subtilis (Ward et al., 1986), and B. thuringiensis (Waalwijk et al., 1985; Ward and Ellar, 1986; Dervyn et al., 1995). This suggested there could be additional promoter(s) driving cyt1Aa expression in B. thuringiensis. Consequently, in addition to the two classical B. thuringiensis promoters, our promoter constructs, including those with mutant -35 and -10 boxes, and transcript analysis confirmed the existence of a functional BtIII promoter immediately upstream from the transcriptional start site (T4, Fig. 1A) that was identified previously in B. thuringiensis (Waalwijk et al., 1985) and B. subtilis (Ward et al., 1986).
Our results also suggest that the presence of three active promoters (BtI, BtII, and BtIII), together with the 20-kDa chaperone-like protein which functions post-translationally (McLean and Whiteley, 1987; Adams et al., 1989; Visick et al., 1991; Wu and Federici, 1995; Wirth et al., 1997), collectively contribute to the high level of Cyt1Aa synthesis and crystallization in B. thuringiensis subsp. israelensis strain 4Q7 (Bti 4Q7). As larger crystals were observed in Bti 4Q7 transformants harboring constructs that lacked the BtIII promoter, we are unable to assess the specific contribution of BtIII in the overall synthesis of Cyt1Aa. Further studies requiring disruption of the BtIII promoter sequence in cyt1Aa in pBtoxis, the toxigenic plasmid in wild-type B. thuringiensis subsp. israelensis (Berry et al. 2002), are required to conclusively determine its role in Cyt1Aa synthesis.
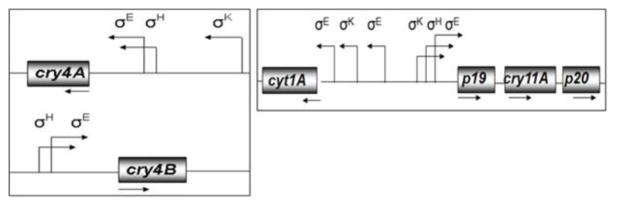
The three cyt1Aa promoters do not overlap, unlike those of cry4Aa, cry4Ba and cry11Aa (Fig. 9, and Wong et al., 1983; Baum and Malvar, 1995; Dervyn et al., 1995). Importantly, each is active during the sporulation phase of growth (Fig. 3), the period during which high levels of Cyt1Aa are synthesized and crystallize. To our knowledge, the combination and order of functional σE, σK, and “σE-like” promoters, respectively, BtI, BtII and BtIII, have not been reported previously, although a putative σH-type element was identified in cry1Ac, a gene that also contains σE and σK promoters (Perez-Garcia et al., 2010). Among cyt sequences available in databases including cyt1Aa studied here, putative σ factor-binding sequences have been identified for at least five. Two recognized by σE and σK were identified in cyt1Aa2 and cyt2Aa1 (Ward et al., 1986; Koni and Ellar, 1993), but only a single promoter recognized by σE, which was found in the upstream region of cyt1Ab1, cyt2Ba1, and cyt2Bb1 (Cheong and Gill, 1997; Guerchicoff et al., 1997; Thiery et al., 1997). In addition, at least six others (cyt1Ab1, cyt1Ca1, cyt2Aa1, cyt2Ba1, cyt2Bb1 and cyt2Bc1) contain putative promoter sequences that could be recognized by σE, based on our sequence analysis (data not shown).
Fig. 9.
Schematic illustration of the sigma factors that recognize the promoters of cyt1Aa, cry11Aa, cry4Aa and cry4Ba. The sigma factors involved in the expression of endotoxin genes of B. thuringiensis subsp. israelensis and references to these are as follows: cyt1Aa (Waalwijk et al., 1985; Ward and Ellar, 1986; Ward et al., 1986; Brown and Whiteley, 1988), cry11Aa (Dervyn et al., 1995; Poncet et al., 1997), cry4Aa (Yoshisue et al., 1995; 1997), and cry4Ba (Poncet et al., 1997; Yoshisue et al., 1997).
The high homology and spacing of BtIII's -35 and -10 boxes to consensus sequences of known B. subtilis promoters (Fig. 1B) indicated that BtIII could be activated by σE. Indeed, the synthesis of Cyt1Aa in B. subtilis mutant strains, 1S38, 1S86, spoIIIGΔ1, deficient in, respectively, σK, σF and σG function, but not in the σE–deficient 1S60 strain transformed with pSF3 (Fig. 7), provides strong evidence that transcription from BtIII is regulated by σE. Although it is possible that BtIII is recognized by σH due to its time of activation based on the results of previous studies (Waalwijk et al., 1985; Ward and Ellar, 1986), it has little or no similarity to the consensus sequence [(A/G)(A/G/C)AGGA(A/T)(A/T)T–14bp–(A/C)GAAT] (Fig. 1). In addition, the increase in cyt1Aa expression toward the end of sporulation observed in our experiments does not correspond with the transitional expression of spo0H during sporulation initiation. Further studies to show that σE or σH binds to the BtIII promoter are required to conclusively characterize this promoter. However, we favor a model, based on the collective data described here, that BtIII is activated by σE.
The variability in transcript levels observed by recombinants with different combinations or independent BtI, BtII and BtIII promoters during sporulation (Fig. 3) is not unexpected as the availability and relative concentrations of σ factors can fluctuate to accommodate efficient and differential expression of genes throughout different phases of sporulation (de Hoon et al., 2010). Our data show that (i) maximal level of cry1Aa transcripts occurs in the presence of the BtI promoter (σE) in combination with BtII (σK) and BtIII (σE), (ii) BtI is the most robust promoter of the three, followed by BtII and BtIII, and (iii) there is a general correlation between transcript levels, and crystal size, and the amount of Cyt1Aa produced per spore (Table 2; Fig. 3 and 4). Nevertheless, our data also indicates that the presence of BtIII is not required for maximal expression, as its absence in the other constructs does not significantly alter transcript levels (Fig. 3). Interestingly, however, the larger the size of the Cyt1Aa crystals in a strain, the fewer the number of sporulating cells, as assessed by the number of spores produced due to a fitness cost associated with making large crystals (Table 2). When the sizes of Cyt1A crystals produced by individual promoters were compared, BtI and BtIII produced, respectively, the largest and smallest. However, Cyt1A crystals produced by all three promoters were smaller than those produced by BtI-BtII, and showed no significant differences in size compared to those produced by BtII-BtIII, suggesting that there might be competition between BtI and BtIII. (Table 2). Consistent with this pattern, the BtIII promoter construct yielded the smallest Cyt1Aa crystals but more cells per unit medium (Table 2 and 3, Fig. 4), providing a level of Cyt1Aa synthesis per ml that was essentially similar to those obtained with the constructs containing other promoter combinations (Fig. 5). This result is consistent with previous reports showing that increases in endotoxin yields correlated with reduced spore counts, a phenomenon likely due to nutrient expenditure dedicated crystal synthesis rather than other cellular processes, including sporulation (Park et al., 1998; 1999). We do not have a specific reason for the observed decrease in viable spore counts. However, our results are in contrast with those reported by Barboza-Corona et al. (2014) in which a recombinant B. thuringiensis HD73 synthesizing a heterologous chitinase showed an increase in viable spore counts when compared with wild-type HD73. In their study, they suggested that the rapid nutrient depletion led to activation of Spo0A, a master regulator for entry into sporulation (Fujita and Losick, 2005). Regardless, the reliability of our results was confirmed through three separate experiments in which the overall discernible differences in crystal size among the three constructs were consistently observed by phase contrast and scanning electron microscopy.
As with cry11Aa, sequences in the 3’-UTR of cyt1Aa have the potential to form a secondary stem-loop structure that functions in transcription termination and mRNA stability (Waalwijk et al., 1985; Ward and Ellar, 1986; Agaisse and Lereclus, 1995), both of which could ultimately contribute to the overall accumulation of Cyt1Aa in B. thuringiensis subsp. israelensis. Using the method of Tinoco et al. (Ge, 1999), ΔG values of −27.6 kcal and −17.2 kcal were predicted for the 3’-UTR stem-loops of, respectively, cyt1Aa and cry11Aa (Fig. 8A). This suggested that cyt1Aa's stem-loop was more stable than that of cry11Aa, and therefore contributed to the relatively higher Cyt1Aa yield when compared to that of Cry11Aa (Ward et al., 1986; Agaisse and Ellar, 1995; Ge, 1999). The 10% decrease in Cyt1Aa synthesis following deletion of the cyt1Aa terminator (Fig. 8B, C) confirmed this sequence plays a role, though apparently minor, in net Cyt1Aa synthesis, a role that could also be substituted by a theoretically weaker cry11Aa stem loop, with little or no decrease in yield of Cyt1Aa.
Finally, it is known that mechanisms have evolved in B. thuringiensis subsp. israelensis to aggregate the four mosquitocidal proteins (Cyt1Aa, Cry4Aa, Cry4Ba, Cry11Aa) into a parasporal body delimited by fibrous matrix of unknown composition. This results in a highly effective PB capable of killing sensitive dipteran larvae, i.e., it is much more toxic per unit weight than any of the endotoxins alone (Diaz-Mendoza et al., 2012). These toxins function synergistically, with the primary synergist being Cyt1Aa, which by itself is not very toxic to mosquito larvae (Wirth et al., 1997). Previous studies have demonstrated that even at low levels Cyt1Aa is a potent synergist of Cry4Aa, Cry4Ab and Cry11Aa. Cyt1A can delay the evolution of resistance to mosquitocidal Cry proteins, for example, Cry11A, as well as the binary toxin of Lysinibacillus sphaericus (Wirth et al., Federici et al., 2007), and also restore the efficacy of these proteins against larvae resistant to them by allowing these toxins to bind to and/or pass through the midgut microvillar membrane (Federici et al., 2003). Thus, it might be possible to increase efficacy by reducing the amount of Cyt1Aa synthesized in B. thuringiensis subsp. israelensis to a level that retains its synergistic activity while increasing the amount of Cry and Bin proteins in recombinant bacteria. Such strains presumably could be more robust larvicides than wild-type or current recombinant strains (Federici et al., 2007). In this regard, our results reported here may assist in devising new strategies for genetically manipulating cyt1Aa, for example, by deleting the BtI and BtII promoters allowing for proportional and optimal increases of other mosquitocidal proteins that are assembled in the parasporal body.
Identifying the third promoter (BtIII) that has high identity to the σE promoter of Bacillus subtilis, from the 5’-untranslated region (UTR) of cyt1Aa
BtIII is not functional in a σE-deficient strain of B. subtilis and is active throughout sporulation.
Demonstrating that a stable stem-loop in the 3’-UTR (predicted ΔG = −27.6) contributes to the high level of Cyt1Aa synthesized
Acknowledgments
We thank Jeffrey J. Johnson for technical assistance with the phase contrast and scanning electron microscopy. This research was supported by a grant from the National Institutes of Health (RO1 AI45817) to B.A.F.
Footnotes
Conflict of Interests
The authors have declared that no competing financial interests exist.
Publisher's Disclaimer: This is a PDF file of an unedited manuscript that has been accepted for publication. As a service to our customers we are providing this early version of the manuscript. The manuscript will undergo copyediting, typesetting, and review of the resulting proof before it is published in its final citable form. Please note that during the production process errors may be discovered which could affect the content, and all legal disclaimers that apply to the journal pertain.
References
- Adams LF, Brown KL, Whiteley HR. Molecular cloning and characterization of two genes encoding sigma factors that direct transcription from a Bacillus thuringiensis crystal protein gene promoter. J Bacteriol. 1991;173:3846–3854. doi: 10.1128/jb.173.12.3846-3854.1991. [DOI] [PMC free article] [PubMed] [Google Scholar]
- Adams LF, Visick JE, Whiteley HR. A 20-kilodalton protein is required for efficient production of the Bacillus thuringiensis subspisraelensis 27-kirodalton crystal protein in Escherichia coli. J Bacteriol. 1989;171:521–530. doi: 10.1128/jb.171.1.521-530.1989. [DOI] [PMC free article] [PubMed] [Google Scholar]
- Agaisse H, Lereclus D. How does Bacillus thuringiensis produce so much insecticidal crystal protein? J Bacteriol. 1995;177:6027–6032. doi: 10.1128/jb.177.21.6027-6032.1995. [DOI] [PMC free article] [PubMed] [Google Scholar]
- Agaisse H, Lereclus D. STAB-SD: a Shine-Dalgarno sequence in the 5’-untranslated region is a determinant of mRNA stability. Mol Microbiol. 1996;20:633–643. doi: 10.1046/j.1365-2958.1996.5401046.x. [DOI] [PubMed] [Google Scholar]
- Baum JA, Malvar T. Regulation of insecticidal crystal protein production in Bacillus thuringiensis. Mol Microbiol. 1995;18:1–12. doi: 10.1111/j.1365-2958.1995.mmi_18010001.x. [DOI] [PubMed] [Google Scholar]
- Barboza-Corona JE, Delgadillo-Angeles JL, Castaneda-Ramırez JC, Barboza-Perez UE, Casados-Vazquez LE, Bideshi DK, del Rincon-Castro MC. Bacillus thuringiensis subsp. kurstaki HD1 as a factory to synthesize alkali-labile ChiA74Δsp chitinase inclusions, Cry crystals and spores for applied use. Microb Cell Fact. 2014;13:15. doi: 10.1186/1475-2859-13-15. [DOI] [PMC free article] [PubMed] [Google Scholar]
- Berry C, O'Neil S, Ben-Dov E, Jones AF, Murphy L, Quail MA, Holden MT, Harris D, Zaritsky A, Parkhill J. Complete sequence and organization of pBtoxis, the toxin-coding plasmid of Bacillus thuringiensis subsp. israelensis. Appl Environ Microbiol. 2002;68:5082–5095. doi: 10.1128/AEM.68.10.5082-5095.2002. [DOI] [PMC free article] [PubMed] [Google Scholar]
- Brown KL. Transcriptional regulation of the Bacillus thuringiensis subspthompsoni crystal protein gene operon. J Bacteriol. 1993;175:7951–7957. doi: 10.1128/jb.175.24.7951-7957.1993. [DOI] [PMC free article] [PubMed] [Google Scholar]
- Brown KL, Whiteley HR. Isolation of a Bacillus thuringiensis RNA polymerase capable of transcribing crystal protein genes. Proc Nat’l Acad Sci USA. 1988;85:4166–4170. doi: 10.1073/pnas.85.12.4166. [DOI] [PMC free article] [PubMed] [Google Scholar]
- Brown KL, Whiteley HR. Isolation of the second Bacillus thuringiensis RNA polymerase that transcribes from a crystal protein gene promoter. J Bacteriol. 1990;172:6682–6688. doi: 10.1128/jb.172.12.6682-6688.1990. [DOI] [PMC free article] [PubMed] [Google Scholar]
- Cheong H, Gill SS. Cloning and characterization of a cytolytic δ-endotoxin from Bacillus thuringiensis subsp jegathesan. Appl Environ Microbiol. 1997;63:3254–3260. doi: 10.1128/aem.63.8.3254-3260.1997. [DOI] [PMC free article] [PubMed] [Google Scholar]
- Crickmore N, Bone EJ, Williams JA, Ellar DJ. Contribution of the individual components of the delta-endotoxin crystal to mosquitocidal activity of Bacillus thuringiensis subspisraelensis. FEMS Microbiol Lett. 1995;131:249–254. [Google Scholar]
- Crickmore N, Ellar DJ. Involvement of a possible chaperonin in the efficient expression of a cloned CryIIA δ-endotoxin gene in Bacillus thuringiensis. Mol Microbiol. 1992;6:1533–1537. doi: 10.1111/j.1365-2958.1992.tb00874.x. [DOI] [PubMed] [Google Scholar]
- de Hoon MJL, Eichenberger P, Vitkup D. Hierarchial evolution of bacterial sporulation network. Curr Biol. 2010;20:R735–745. doi: 10.1016/j.cub.2010.06.031. [DOI] [PMC free article] [PubMed] [Google Scholar]
- Delécluse A, Poncet S, Klier A, Rapoport G. Expression of cryIVA and cryIVB genes, independently or in combination, in a crystal-negative strain of Bacillus thuringiensis subspisraelensis. Appl Environ Microbiol. 1993;59:3922–3927. doi: 10.1128/aem.59.11.3922-3927.1993. [DOI] [PMC free article] [PubMed] [Google Scholar]
- Dervyn E, Poncet S, Klier A, Rapoport G. Transcriptional regulation of the cryIVD gene operon from Bacillus thuringiensis subsp. israelensis. J Bacteriol. 1995;177:2283–2291. doi: 10.1128/jb.177.9.2283-2291.1995. [DOI] [PMC free article] [PubMed] [Google Scholar]
- Diaz-Mendoza M, Bideshi DK, Federici BA. A 54-kilodalton protein encoded by pBtoxix is required for parasporal body structural integrity in Bacillus thuringiensis subspisraelensis. J Bacteriol. 2012;194:1562–1571. doi: 10.1128/JB.06095-11. [DOI] [PMC free article] [PubMed] [Google Scholar]
- Federici BA, Lüthy P, Ibarra JE. Parasporal body of Bacillus thuringiensis israelensis: structure, protein composition, and toxicity. In: de Barjac H, Sutherland S, editors. Bacterial control of mosquitoes and blackflies: biochemistry, genetics, and application of Bacillus thuringiensis and Bacillus sphaericus. Rutgers University Press; New Brunswick: 1990. pp. 16–44. [Google Scholar]
- Federici BA, Park HW, Bideshi DK, Wirth MC, Johnson JJ, Sakano Y, Tang M. Developing recombinant bacteria for control of mosquito larvae. J AM Mosq Control Assoc. 2007;23:164–175. doi: 10.2987/8756-971X(2007)23[164:DRBFCO]2.0.CO;2. [DOI] [PubMed] [Google Scholar]
- Federici BA, Park H-W, Bideshi DK, Wirth MC, Johnson JJ. Recombinant bacteria for mosquito control. J Exp Biol. 2003;206:3877–3885. doi: 10.1242/jeb.00643. [DOI] [PubMed] [Google Scholar]
- Fujita M, Losick R. Evidence that entry into sporulation in Bacillus subtilis is governed by a gradual increase in the level and activity of the master regulon Spo0A. Genes Dev. 2005;19:2236–2244. doi: 10.1101/gad.1335705. [DOI] [PMC free article] [PubMed] [Google Scholar]
- Ge B. PhD thesis. Interdepartmental Program in Genetics, University of California; Riverside: 1999. [Google Scholar]
- Ge B, Bideshi D, Moar WJ, Federici BA. Different effects of helper proteins encoded by the cry2A and cry11A operons on the formation of Cry2A inclusions in Bacillus thuringiensis. FEMS Microbiol Lett. 1998;165:35–41. doi: 10.1111/j.1574-6968.1998.tb13124.x. [DOI] [PubMed] [Google Scholar]
- Goldberg LH, Margalit JA. Bacterial spore demonstrating rapid larvicidal activity against Anopheles sergentii, Uranotaenia unguiculate, Culex univitatus, Aedes aegypti and Culex pipiens. Mosq News. 1977;37:355–358. [Google Scholar]
- Guerchicoff A, Ugalde RA, Rubinstein CP. Identification and characterization of a previously undescribed cyt gene in Bacillus thuringiensis subspisraelensis. Appl Environ Microbiol. 1997;63:2716–2721. doi: 10.1128/aem.63.7.2716-2721.1997. [DOI] [PMC free article] [PubMed] [Google Scholar]
- Haldenwang WG. The sigma factors of Bacillus subtilis. Microbiol Rev. 1995;59:1–30. doi: 10.1128/mr.59.1.1-30.1995. [DOI] [PMC free article] [PubMed] [Google Scholar]
- Helmann JD, Moran CP., Jr . RNA polymerase and sigma factors. In: Sonenshein AL, Hoch JA, Losick R, editors. Bacillus subtilis and its closest relatives: from genes to cells. American Society for Microbiology; Washington, D.C: 2002. pp. 289–312. [Google Scholar]
- Ibarra JE, Federici BA. Isolation of a relatively nontoxic 65-kilodalton protein inclusion from the parasporal body of Bacillus thuringiensis subsp. israelensis. J Bacteriol. 1986;165:527–533. doi: 10.1128/jb.165.2.527-533.1986. [DOI] [PMC free article] [PubMed] [Google Scholar]
- Koni PA, Ellar DJ. Cloning and characterization of a novel Bacillus thuringiensis cytolytic delta-endotoxin. J Mol Biol. 1993;229:319–327. doi: 10.1006/jmbi.1993.1037. [DOI] [PubMed] [Google Scholar]
- Laemmli UK. Cleavage of structural proteins during the assembly of the head of bacteriophage T4. Nature. 1970;227:680–685. doi: 10.1038/227680a0. [DOI] [PubMed] [Google Scholar]
- Lereclus D, Arantes O, Chaufaux J, Lecadet MM. Transformation and expression of a cloned δ-endotoxin gene in Bacillus thuringiensis. FEMS Microbiol Lett. 1989;60:211–218. doi: 10.1016/0378-1097(89)90511-9. [DOI] [PubMed] [Google Scholar]
- Makita Y, Nakao M, Ogasawara N, Nakai K. DBTBS: database of transcriptional regulation in Bacillus subtilis and its contribution to comparative genomics. Nucleic Acids Res. 2004;32:D75–D77. doi: 10.1093/nar/gkh074. [DOI] [PMC free article] [PubMed] [Google Scholar]
- Mclean KM, Whiteley HR. Expression in Escherichia coli of a cloned crystal protein gene of Bacillus thuringiensis subspisraelensis. J Bacteriol. 1987;169:1017–1023. doi: 10.1128/jb.169.3.1017-1023.1987. [DOI] [PMC free article] [PubMed] [Google Scholar]
- Park H-W, Bideshi DK, Federici BA. Molecular genetic manipulation of truncated Cry1C protein synthesis in Bacillus thuringiensis to improve stability and yield. Appl Environ Microbiol. 2000;66:4449–4455. doi: 10.1128/aem.66.10.4449-4455.2000. [DOI] [PMC free article] [PubMed] [Google Scholar]
- Park H-W, Bideshi DK, Johnson JJ, Federici BA. Differential enhancement of Cry2A versus Cry11A yields in Bacillus thuringiensis by use of the cry3A STAB mRNA sequence. FEMS Microbiol Lett. 1999;181:319–327. doi: 10.1111/j.1574-6968.1999.tb08862.x. [DOI] [PubMed] [Google Scholar]
- Park H-W, Federici BA. Domain I plays an important role in the crystallization of Cry3A in Bacillus thuringiensis. Mol Biotechnol. 2000;16:97–107. doi: 10.1385/MB:16:2:97. [DOI] [PubMed] [Google Scholar]
- Park H-W, Ge B, Bauer LS, Federici BA. Optimization of Cry3A yields in Bacillus thuringiensis by use of sporulation-dependent promoter in combination with the STAB-SD mRNA sequence. Appl Environ Microbiol. 1998;64:3932–3938. doi: 10.1128/aem.64.10.3932-3938.1998. [DOI] [PMC free article] [PubMed] [Google Scholar]
- Perez-Garcia G, Basurto-Rios R, Ibarra JE. Potential effect of a putative sigma (H)- driven promoter on the expression of Cry1Ac of Bacillus thuringiensis. J Invertebr Pathol. 2010;104:140–146. doi: 10.1016/j.jip.2010.02.010. [DOI] [PubMed] [Google Scholar]
- Poncet S, Dervyn E, Klier A, Rapoport G. Spo0A represses transcription of the cry toxin genes in Bacillus thuringiensis. Microbiology. 1997;143:2743–2751. doi: 10.1099/00221287-143-8-2743. [DOI] [PubMed] [Google Scholar]
- Schnepf E, Crickmore N, Van Rie J, Lereclus D, Baum J, Feltelson J, Zeigler DR, Dean DH. Bacillus thuringiensis and its pesticidal crystal proteins. Microbiol Mol Biol Rev. 1998;62:775–807. doi: 10.1128/mmbr.62.3.775-806.1998. [DOI] [PMC free article] [PubMed] [Google Scholar]
- Thiery I, Delécluse A, Tamayo MC, Orduz S. Identification of a gene for Cyt1A-like hemolysis from Bacillus thuringiensis subspmedellin and expression in a crystal-negative B. thuringiensis strain. Appl Environ Microbiol. 1997;63:468–473. doi: 10.1128/aem.63.2.468-473.1997. [DOI] [PMC free article] [PubMed] [Google Scholar]
- Visick JE, Whiteley HR. Effect of a 20-kilodalton protein from Bacillus thuringiensis subspisraelensis on production of the CytA protein by Escherichia coli. J Bacteriol. 1991;173:1748–1756. doi: 10.1128/jb.173.5.1748-1756.1991. [DOI] [PMC free article] [PubMed] [Google Scholar]
- Waalwijk C, Dullemans AM, van Workum ME, Visser B. Molecular cloning and the nucleotide sequence of the Mr 28,000 crystal protein gene of Bacillus thuringiensis subspisraelensis. Nucleic Acids Res. 1985;13:8207–8217. doi: 10.1093/nar/13.22.8207. [DOI] [PMC free article] [PubMed] [Google Scholar]
- Ward ES, Ellar DJ. Bacillus thuringiensis var. israelensisdelta-endotoxin. Nucleotide sequence and characterization of the transcripts in Bacillus thuringiensis and Escherichia coli. J Mol Biol. 1986;191:1–11. doi: 10.1016/0022-2836(86)90417-1. [DOI] [PubMed] [Google Scholar]
- Ward ES, Ridley AR, Ellar DJ, Todd JA. Bacillus thuringiensis var. israelensisδ-endotoxin cloning and expression of the toxin in sporogenic and saprogenic strains of Bacillus subtilis. J Mol Biol. 1986;191:13–22. doi: 10.1016/0022-2836(86)90418-3. [DOI] [PubMed] [Google Scholar]
- Wirth MC, Georghiou GP, Federici BA. Cyt1A enables Cry1A endotoxins of Bacillus thuringiensis to overcome high level of CryIV resistance in the mosquito, Culex quinquefasciatus. Proc Nat’l Acad Sci USA. 1997;94:10536–10540. doi: 10.1073/pnas.94.20.10536. [DOI] [PMC free article] [PubMed] [Google Scholar]
- Wong HC, Chang S. Identification of a retroregulator that stabilizes mRNAs in bacteria. Proc Nat’l Acad Sci USA. 1986;83:3233–3237. doi: 10.1073/pnas.83.10.3233. [DOI] [PMC free article] [PubMed] [Google Scholar]
- Wong HC, Schnepf HE, Whiteley HR. Transcriptional and translational start sites for the Bacillus thuringiensis crystal protein gene. J Biol Chem. 1983;258:1960–1967. [PubMed] [Google Scholar]
- Wu D, Chang FN. Synergism in mosquitocidal activity of 26 and 65 kDa proteins from Bacillus thuringiensis subspisraelensis crystal. FEBS Lett. 1985;190:232–236. [Google Scholar]
- Wu D, Federici BA. A 20-kilodalton protein preserves cell viability and promotes CytA crystal formation during sporulation in Bacillus thuringiensis. J Bacteriol. 1993;175:5276–5280. doi: 10.1128/jb.175.16.5276-5280.1993. [DOI] [PMC free article] [PubMed] [Google Scholar]
- Wu D, Federici BA. Improved production of the insecticidal CryIVD protein in Bacillus thuringiensis using cryIA(c) promoters to express the gene for an associated 20-kDa protein. Appl Microbiol Biotechnol. 1995;42:697–702. doi: 10.1007/BF00171947. [DOI] [PubMed] [Google Scholar]
- Yoshisue H, Fukada T, Yoshida K, San K, Kurosawa S, Sakai H, Komano T. Transcription regulation of Bacillus thuringiensis subsp. israelensis mosquito larvicidal crystal protein gene cryIVA. J Bacteriol. 1993a;175:2750–2753. doi: 10.1128/jb.175.9.2750-2753.1993. [DOI] [PMC free article] [PubMed] [Google Scholar]
- Yoshisue H, Ihara K, Nishimoto T, Sakai H, Komano T. Expression of the genes for insecticidal crystal proteins in Bacillus thuringiensis: cryIVA, not cryIVB, is transcribed by RNA polymerase containing sigma-H and that containing sigma-E. FEMS Microbiol Lett. 1995;127:65–72. doi: 10.1111/j.1574-6968.1995.tb07451.x. [DOI] [PubMed] [Google Scholar]
- Yoshisue H, Nishimoto T, Sakai H, Komano T. Identification of a promoter for the crystal protein-encoding gene cryIVB from Bacillus thuringiensis subsp. israelensis. Gene. 1993b;137:247–251. doi: 10.1016/0378-1119(93)90015-u. [DOI] [PubMed] [Google Scholar]
- Yoshisue H, Sakai H, Sen K, Yamagiwa W, Komano T. Identification of a second transcriptional start site for the insecticidal protein gene cryIVA of Bacillus thuringiensis subsp. israelensis. Gene. 1997;185:251–255. doi: 10.1016/s0378-1119(96)00653-1. [DOI] [PubMed] [Google Scholar]
- Zhang X-H, Chiang VL. Single-stranded DNA ligation by T4 RNA ligase for PCR cloning of 5’-noncoding fragments and coding sequences of a specific gene. Nucleic Acids Res. 1996;24:990–991. doi: 10.1093/nar/24.5.990. [DOI] [PMC free article] [PubMed] [Google Scholar]


