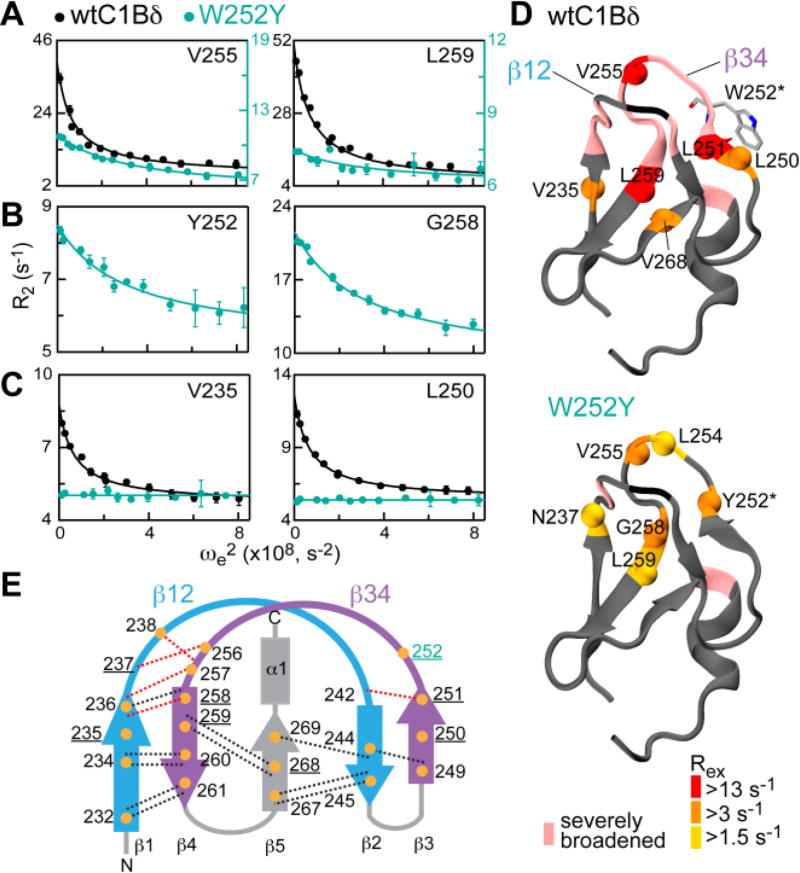
Figure 2.
DAG-toggling mutation alters the dynamics of ligand binding loops of C1Bδ. (A–C) Representative 15N R1ρ relaxation dispersion curves at 14.1 T shown for three scenarios described in the text. Solid lines are the fits to Eqs. S5 and S7. (D) Rex values of the wt and W252Y mapped onto the 3D structure of C1Bδ (1PTQ) and color-coded according to their magnitude. N-H groups with quantifiable dispersion are represented with spheres. (E) Topology diagram of C1Bδ showing a subset of H-bonds (dotted lines) that connect β-strands and loop hinges and involve amide 1H (orange circles). H-bonds that involve slow-exchanging amide 1H are in black; H-bonds whose presence is not detectable by HX experiments are in red. Residues with quantifiable exchange are underlined.

