

Abstract
Purpose
Squamous cell lung cancers (SQCLC) account for 25% of all NSCLCs, yet the prognosis of these patients is poor and treatment options are limited. Amplified FGFR1 is one of the most common oncogenic events in SQCLCs, occurring in ~20% of cases. AZD4547 is a potent and selective FGFR1-3 inhibitor with anti-tumor activity in FGFR1 amplified SQCLC cell lines and patient-derived xenografts.
Design
Based on these data, we performed a phase 1 study of AZD4547 in patients with previously treated stage IV FGFR1 amplified SQCLCs (NCT00979134). FGFR1 amplification (FGFR1:CEP8 ≥ 2) was determined by FISH. The primary endpoint was safety/tolerability. Secondary endpoints included anti-tumor activity, pharmacokinetics, pharmacodynamics, and molecular analyses.
Results
15 FGFR1 amplified patients were treated. The most common related AEs were gastrointestinal and dermatologic. Grade ≥ 3 related AEs occurred in 3 patients (23%). Thirteen patients were evaluable for radiographic response assessment. The overall response rate was 8% (1 PR). 2/15 (13.3%) patients were progression free at 12 weeks and the median overall survival was 4.9 months. Molecular tests including next-generation sequencing, gene expression analysis, and FGFR1 immunohistochemistry showed poor correlation between gene amplification and expression; potential genomic modifiers of efficacy; and heterogeneity in the 8p11 amplicon.
Conclusion
AZD4547 was tolerable at the 80mg po bid dose with modest anti-tumor activity. Detailed molecular studies show that these tumors are heterogeneous, with a range of mutational co-variates and stark differences in gene expression of the 8p11 amplicon that likely explain the modest efficacy of FGFR inhibition in this disease.
Keywords: squamous lung cancer, FGFR1, AZD4547
Introduction
Despite the recent FDA-approval of a number of new treatment options for patients with squamous cell lung cancers (SQCLCs), efforts at targeting genetic aberrations in these patients have been largely unsuccessful. There are a number of reasons for this, including a paucity of experimental models that accurately recapitulate patients’ tumors and a general focus on actionable driver events that occur in adenocarcinomas but are absent in SQCLCs. From the standpoint of personalized therapy, management has been, as a result, impersonal, a reflection of our poor understanding of the biology of this disease. Recently, however, The Cancer Genome Atlas’ comprehensive molecular analysis of 178 early stage SQCLC tumors (1) along with parallel work by other investigators identified a number of potentially actionable oncogenic events in this disease, including mutations in the Discoidin Domain Receptor 2 gene (DDR2) (2) and amplification of the Fibroblast Growth Factor Receptor 1 gene (FGFR1) (3). The latter has been a particularly promising target given its relatively high event frequency (approximately 20% of tumors in some series) and encouraging pre-clinical modeling, which confirmed its oncogenic potential and sensitivity to pharmacologic inhibition (3, 4). Most relevant to this paper is work by Zhang and colleagues, who generated a series of five FGFR1 amplified SQCLC patient-derived xenografts, three of which showed robust tumor regression in response to treatment and one of which showed sustained growth inhibition with the small molecular inhibitor AZD4547 (4).
AZD4547 is a potent and selective inhibitor of FGFR 1, 2, and 3. Cellular enzyme inhibition assays demonstrate high potency against FGFRs 1–3 (IC50 = 13nM for FGFR1, 2nM for FGFR2, and 40M for FGFR3) with good selectivity: the Insulin-Like Growth Factor 1 Receptor (IGF1R, IC50 = 829nM) and Kinase Insert Domain Receptor (KDR, IC50 = 285nM) are the only other kinases with sub-μM IC50s. An antecedent phase 1 dose-finding study of AZD4547 in patients with advanced solid tumors identified a recommended expansion dose of 80mg oral twice daily, which was determined to be both safe and biologically active, exceeding the equivalent drug concentration that led to tumor regression in FGFR1 amplified xenograft models. A histology-specific expansion study was also performed in patients with FGFR1 amplified stage IV SQCLCs. We now report the aggregate phase 1 results of AZD4547 in FGFR1 amplified stage IV SQCLC patients with particular attention paid to biologic correlates of response assessed through genomic, transcriptional, and immunohistochemical analyses.
Materials and Methods
Patient Eligibility
All patients had a histologic diagnosis of stage IV SQCLC, confirmation of FGFR1 amplification by fluorescence in-situ hybridization (FISH, see below), World Health Organization (WHO) performance status of 0–1, and normal renal, hepatic, and hematologic function. Patients needed to have had disease progression following first-line platinum-based chemotherapy with measurable disease as per Response Criteria in Solid Tumors (RECIST) 1.1. Key exclusion criteria included a history or evidence on screening of specific ophthalmologic conditions including retinal pigmented epithelium detachment (RPED), dry or wet age-related macular degeneration, retinal vein occlusion (RVO), retinal degenerative diseases, or any other chorioretinal defect.
Study Design and Treatment
This was an international phase 1b study of AZD4547 monotherapy conducted at 29 centers in 7 countries (UK, United States, Spain, Germany, Netherlands, France, and Italy). The study protocol was approved by the Institutional Review Boards (IRB) at each institution and in accordance with the Declaration of Helsinki. The primary endpoints of this study were to characterize the safety, tolerability, and preliminary antitumor activity of AZD4547 at the recommended expansion dose in this population of patients. A sample size of 12 evaluable patients was considered adequate to characterize the preliminary anti-tumor activity of AZD4547 in this molecularly-defined cohort, providing reasonable confidence of estimating the true response rate.
Patients received treatment with AZD4547 at a dose of 80mg oral twice daily continuously on an every 21 day cycle. Toxicity was graded according to the NCI Common Toxicity Criteria version 4.0. Ophthalmologic assessments (including ophthalmologic CT) were required at baseline, monthly for the first 3 months, then every 8 weeks thereafter. Tumor size was assessed by CT imaging of all known sites of disease every 2 cycles (6 weeks). Response and determination of progression were made using RECIST 1.1 by local investigators. Response confirmation was made with a follow-up scan at least 4 weeks after the initial assessment. Progression-free survival was assessed and reported at 12 weeks. Median overall survival was calculated using the Kaplan-Meier method.
Blood for AZD4547 pharmacokinetic analysis was obtained on day 1 of cycles 2 and 3 at the following time-points: pre-dose, 0.5–2 hours post-dose, 5–6 hours post-dose, and 8–12 hours post-dose. Plasma drug concentration was analyzed by PRA International. Blood for FGF2 and FGF23 ligand assessment was obtained at screening; pre-dose on days 1, 8, and 15 of cycle 1; and pre-dose on day 1 of every cycle thereafter.
Determination of FGFR1 amplification
For the purposes of trial eligibility, FGFR1 amplification by FISH was determined through central testing using a non-commercial DAKO kit (N=13, Quintiles) and by local testing using a Zytovision SPEC FGFR1/CEN 8 probeset (N=2, images centrally reviewed for confirmation). Amplification was defined as a ratio of 8p signals ≥ 2 relative to the centromere. Amplification was further stratified as “low” (ratio 2–2.6) and “high” (ratio ≥ 2.6) for the purposes of response assessment.
Next-generation sequencing
Genomic alterations in key cancer-associated genes were profiled using two platforms. Ten samples were analyzed using an exon capture by hybridization followed by next-generation sequencing assay termed MSK-MPACT (Integrated Mutation Profiling of Actionable Cancer Targets), which encompasses all protein-coding exons and select introns of 341 cancer genes. (5, 6) Genes were selected to include commonly implicated oncogenes, tumor suppressor genes, and components of pathways deemed actionable by current targeted therapies (Supplementary File 1). All somatic alterations were called in reference to matched germline DNA. One additional sample was analyzed through FoundationONE™. Calls for copy number gain and amplification utilized cut-off ratios of between 1.6–2 and ≥2, respectively, normalized against the average ploidy of the tumor.
RNA extraction and gene expression by nanoString analysis
Prior to processing tumor for RNA extraction, each sample was reviewed by an internal certified pathologist to confirm disease diagnosis and verify tumor content. A minimum of one 5μM section per patient was used; however, where tumor size or content was small two sections were used. RNA was extracted from macrodissected tissue using the Allprep DNA/RNA kit (Qiagen) according to the manufacturer’s instructions. RNA quantity was assessed by Qubit (ThermoFisher Scientific).
Barcoded probes to measure gene expression were manufactured by nanoString Technologies (Supplementary File 2). The nCounter assay also included 6 positive controls and 8 negative controls. nCounter analysis was performed according to the manufacturer’s instructions. Data were collected using the nCounter digital analyser. nCounter data were normalized through an internally developed Pipeline Pilot Tool (NAPPA, publicly available on the Comprehensive R Archive Network, CRAN, Harbron & Wappett (2014) R package: NAPPA http://CRAN.R-project.org/package=NAPPA). In brief, data were log2 transformed after being normalized in two steps: raw nanoString counts were first background adjusted with a Truncated Poisson correction using internal negative controls followed by a technical normalization using internal positive controls. Data was then corrected for input amount variation through a Sigmoid shrunken slope normalization step using the mean expression of housekeeping genes. A transcript was designated as not detected if the raw count was below the average of the 8 internal negative control raw counts plus 2 standard deviations reflecting approximately a 95% confidence interval.
FGFR1 immunohistochemistry
5μM FFPE tissue sections were placed onto glass slides, dewaxed and rehydrated. All incubations were performed at room temperature and TBS containing 0.05% Tween (TBST) used for washes. Antigen retrieval was performed in pH 6 retrieval buffer (S1699, Dako) at 110°C for 5min in a RHS-1 microwave vacuum processor (Milestone), then peroxidase activity (3% hydrogen peroxide for 10min), endogenous biotin (Vector, SP-2002) and non-specific binding sites (Dako, X0909) blocked. 1:50 FGFR-1 antibody (Epitomics 2144-1), in antibody diluent (Dako, S0809), was applied to sections for 1hr. The Vectastain Elite ABC kit (Vector, PK-6101) was then added as instructed. Sections were washed and developed in diaminobenzidine for 10min (Dako, K3466) then counterstained with Carazzi’s hematoxylin. Controls included the FFPE KG1a (FGFR-1 expressing (FGFR2/3 negative)) xenograft tumour as a positive control and the FFPE KMS11 (FGFR-3 expressing (FGFR2/3 negative)) xenograft tumour as a negative control. Percent tumor content from each patient sample is shown in Supplementary File 3.
Results
Clinical characteristics, safety, and efficacy
A total of 15 patients with FGFR1 amplified (FGFR1:CEP8 ≥ 2) stage IV SQCLCs were treated at the recommended expansion dose of AZD4547 across the phase 1 cohorts. Thirteen of these patients were treated as part of the SQCLC expansion cohort. Two patients were treated as part of the dose-escalation cohort at the recommended expansion dose of 80mg bid. Two other patients with clusters of FGFR1 signals (≥4) in ≥ 10% of cells but with an amplification ratio < 2 were treated as part of the SQCLC expansion cohort and are excluded from this analysis as non-amplified. The clinical characteristics of the 15 FGFR1 amplified patients treated are shown in Table 1. Prior treatments received by each patient, along with responses where available, are shown in Supplementary File 4.
Table 1.
Clinical characteristics
| All (N=15) | High amp (N=7) | Low amp (N=8) | |
|---|---|---|---|
| Age | |||
| Median | 66 | 67 | 66 |
| Range | 48–72 | 48–73 | 55–72 |
| Sex | |||
| Female | 6 (40%) | 4 (57%) | 2 (25%) |
| Race | |||
| White | 11 (73%) | 7 (100%) | 4 (50%) |
| WHO performance status | |||
| Restricted activity | 10 (67%) | 4 (57%) | 6 (75%) |
| Prior lines of therapy | |||
| Median (range) | 3 (1–7) | 2 (1–5) | 3 (2–7) |
| Prior treatment with first-line platinum doublet | 100% | 100% | 100% |
| Histology | |||
| Squamous cell carcinoma | 100% | 100% | 100% |
The most frequent grade ≥ 2 adverse events (AE) are shown in Table 2. Toxicities generally affected the gastrointestinal tract and mucosal/cutaneous surfaces. Six patients (40%) experienced a grade ≥ 3 AE. Three (23%) patients in the SQCLC expansion cohort experienced a serious adverse event (SAE) related to study drug (Table 3). Two patients in the preceding dose-escalation cohort experienced central serous retinopathy and dehydration (both related, grade 3) and grade 5 deterioration (unrelated) as SAEs. Three patients in the SQCLC expansion (23%) discontinued therapy to due a side effect from study drug, which included asthenia, bilateral central subfoveal edema, and general deterioration. There were no treatment-related deaths. Two patients came off study prior to undergoing their first CT scan, one for toxicity and the other from death due to disease.
Table 2.
most frequent grade ≥ 2 adverse events
| Adverse event | N (% frequency) |
|---|---|
| Constipation | 8 (53.3) |
| Dry mouth | 5 (33.3) |
| Fatigue | 5 (33.3) |
| Diarrhea | 5 (33.3) |
| Dyspnea | 5 (33.3) |
| Decreased appetite | 4 (26.7) |
| Vomiting | 4 (26.7) |
| Dry Skin | 4 (26.7) |
| Breath Sounds Abnormal | 4 (26.7) |
| Dry eye | 3 (20.0) |
| Stomatitis | 3 (20.0) |
| Epistaxis | 3 (20.0) |
| Hyperphosphatemia | 3 (20.0) |
| Nausea | 2 (13.3) |
| Asthenia | 2 (13.3) |
| Onychomadesis | 2 (13.3) |
Table 3.
Serious adverse events
| Adverse Event | Grade | Related to AZD4547? |
|---|---|---|
| central serous retinopathy | 3 | Yes |
| dehydration | 3 | Yes |
| deterioration | 5 | No |
| anorexia | 3 | No |
| asthenia | 2 | Yes |
| dyspnea/hypoxia | 2 | No |
| deterioration | 3 | No |
| dyspnea | 2 | Yes |
| hyponatremia | 4 | No |
Of the 13 patients who underwent a follow-up CT scan, one achieved a confirmed partial response (PR, 8%), four patients had stable disease (SD, 31%) as a best response and the remaining eight patients had progression of disease (PD, 61%) (Figure 1). 2/15 (13.3%) patients were progression free at 12 weeks. Median overall survival (OS) was 4.9 months.
Figure 1.
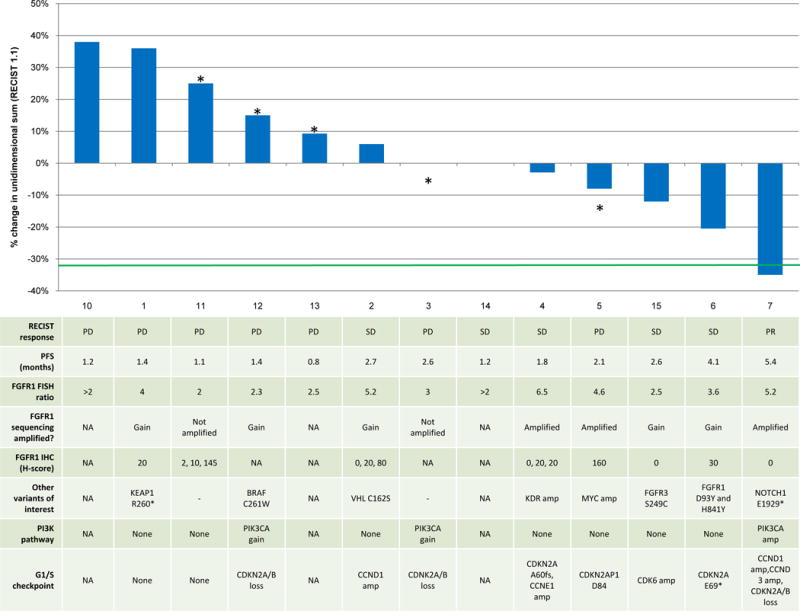
Waterfall plot of best response with molecular data shown in the table below for each corresponding patient. Data include FGFR1 amplification by FISH, FGFR1 immunohistochemistry, and somatic genomic alterations. *denotes disease progression.
FGFR1 amplification, protein, and mRNA expression uncover heterogeneity in the 8p11 amplicon
To explore whether molecular covariates might play a role in determining response to AZD4547, we performed targeted exon sequencing, immunohistochemistry (IHC), and gene expression analysis on all available archived pre-treatment tumors. Eleven of 15 patients had adequate material for next-generation sequencing. A full list of the somatic variants and copy number alterations can found in Supplementary File 5, with a subset of results presented in Figure 1. Of the 11 patients tested (10 of whom were evaluable for CT response as shown on Figure 1), 4 (36%) had evidence of FGFR1 amplification (ratio ≥2, normalized to average tumor ploidy) and 5 (45%) had evidence of gain (ratio = 1.6–2.0) by sequencing. Two patients had no evidence of amplification by sequencing (18%).
IHC for FGFR1 was performed on samples from 8 patients (Figure 1). There was no correlation between FGFR1 protein expression and degree of gene amplification either by FISH or by sequencing. The maximum H-score was 160 (range 0–160), with 4 patient tumors (50%) showing no evidence of protein expression (H-score = 0, Patients 2, 4, 15, and 7). Three patients had multiple tumor areas available for IHC assessment. IHC of these areas showed heterogeneity in FGFR1 protein expression, with one patient’s tumor samples showing H-scores of 2, 10, and 145 and another’s showing scores of 0, 20 and 80. We did find evidence of FGFR1 heterogeneity by FISH as well in samples from Patient 4 and in a patient untreated with drug but whose tumor underwent screening (Supplementary Figure 1A–B).
We assessed for FGFR1 mRNA expression as part of a broader panel of genes located in the 8p11 amplicon. Eight patients had material left for this analysis, which was also performed on FGFR1 amplified (positive controls) and non-amplified (negative controls) lung cancer cell lines. As shown in Figure 2, the pattern of gene expression in our patients’ tumors was strikingly different from those seen in the FGFR1 amplified positive controls (DMS114, H520, H1703). While nearly all 8p11 genes were concordantly and highly expressed in the FGFR1 amplified cell lines, gene expression in the patient tumor samples was variable and lower. Some exhibited higher expression in genes located closer to the centromere (Patients 5 and 8) while others exhibited uniformly low expression of all 8p11 genes (Patients 3, 4A, 2A). Still others showed a fragmented expression pattern (Patient 4C and 11). With regard to FGFR1 in particular, gene expression was relatively low in most patients’ tumors. We did identify heterogeneity in FGFR1 mRNA expression in one patient who had two sites of disease available for testing, commensurate with the heterogeneous protein expression detected by IHC (Patient 2A and B). Overall, protein expression did match gene expression where material was available for both assays. Importantly, however, neither occurred at high level in any tumor sample. MYC mRNA expression was also assessed in 8 patients, and while present in all tested cases, was not overexpressed relative to FGFR1 in any case (data not shown).
Figure 2.
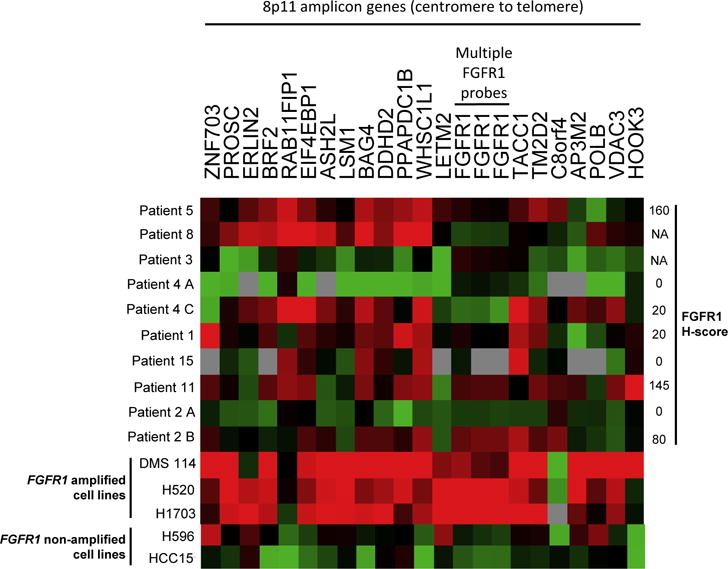
Heatmap for mRNA expression of select genes located on the 8p11 amplicon, arranged from centromere (left) to telomere (right). Red coloration denotes high expression and green denotes low expression for a given tumor sample. Grey denotes no detection of gene expression. H-score for FGFR1 protein expression is indicated on the right where available. DMS114, H520, and H1703 NSCLC cell lines were included as positive controls (FGFR1 amplified); H596 and HCC15 NSCLC cell lines were included as negative controls (FGFR1 non-amplified).
Next-generation sequencing identifies molecular co-variates as potential response modifiers
Because SQCLCs are often marked by changes within or across multiple signaling pathways, we screened for somatic co-alterations in other putative oncogenic drivers and tumor suppressors, including those within the commonly altered PI3K and cell cycle pathways. These are listed in Figure 1. Most tumors had either amplification of a cyclin or cyclin-dependent kinase or an inactivating CDKN2A alteration (N=8/11, 72%). Most did not have co-alteration in an upstream PI3K pathway member (N=4/11, 36%). Neither PI3K pathway alterations nor G1/S checkpoint alterations seemed to correlate with response in a predictable fashion, with the one confirmed partial responder’s tumor harboring PIK3CA amplification, CCND1/3 amplification, and CDKN2A loss.
We did identify other somatic alterations, however, with the potential to modify response. These included FGFR3 S249C, FGFR1 D131N, FGFR1 D93Y and H841Y, and NOTCH1 E1929* mutations as potential sensitizers and a KEAP1 R260* mutation and MYC amplification as potential resistance factors.
AZD4547 pharmacokinetics
The plasma concentration of AZD4547 was assessed on day 1 of cycles 2 and 3 pre-dose and during prespecified time windows post-dose. There was variability in the PK between patients, in part because of dose reductions from 80mg to 40mg bid in one patient, making specific correlative assessments difficult (Supplementary File 6). Overall, across the histologic expansion arms of the study (Part C), the predose geometric mean concentrations were similar at cycle 2 and cycle 3, ranging from 92.5–182.2ng/mL and 56.8–170.3ng/mL, respectively, suggesting stability in the PK of AZD4547 over time. There was no clear correlation between C2D1 or C3D1 PK data and response, either by RECIST or unidimensional shrinkage (Supplementary Figure 2).
Serum phosphate pharmacodynamics and response
FGF23 is a potent phosphatonin that causes renal phosphate excretion upon binding to FGFR1 and its co-receptor klotho. Serum phosphate is thus a pharmacodynamic biomarker of FGFR1 inhibition in renal cells. As shown in Figure 3A, there was a modest but significant increase in average serum phosphate of about 0.4 mmol/L, or 1 mg/dL, from patients treated with AZD4547 at cycle 2 day 1 (p<0.001). We analyzed the relationship between best percent change in tumor size and increase in serum phosphate as stratified by degree of FGFR1 amplification (Figure 3B). Patients who were treated with the phosphate binder renagel were excluded from this analysis. There was a significant association between the best change in tumor size and increase in serum phosphate at cycle 2 day 1 in patients whose tumors had a high degree of FGFR1 amplification (p<0.001). FGF2 and FGF23 ligand dynamics were also studied but showed a substantial amount of intrapatient variability without apparent correlation with response or PK (data not shown).
Figure 3.
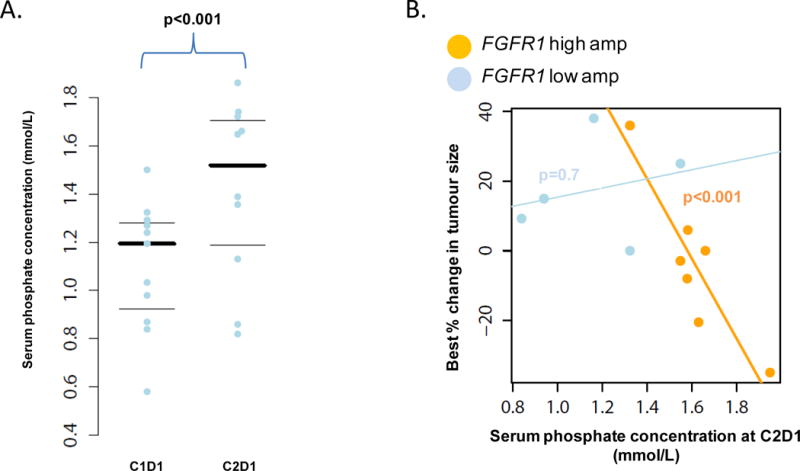
(A) Plot of serum phosphate concentration for each patient at cycle 1 day 1 and cycle 2 day 1. Thicker black line indicates mean phosphate concentration. (B) Plot of serum phosphate concentration at cycle 2 day 1 against best % change in tumor size parsed by FISH low and high amplification status. There was a significant association between higher serum phosphate concentration and best change in % tumor size in the high amplification group (p<0.001).
Discussion
This is, to our knowledge, the first prospective study of FGFR1 inhibition in patients with FGFR1 amplified stage IV squamous cell lung cancers to report relatively comprehensive data on the molecular landscape of these tumors, with an eye towards elucidating the relationship between gene, RNA, and protein expression. While pre-clinical studies provided a strong rationale for kinase inhibition in this setting, the clinical data to date show only modest efficacy in this study as well as studies of the pan-FGFR inhibitor BGJ398 and the multi-kinase inhibitor dovitinib. (7, 8) Correlative studies performed by us suggest two possible explanations for this.
First, while all patient tumors exhibited FGFR1 amplification by FISH, only a subset was found to have amplification by sequencing. This is perhaps not surprising in light of the fragmented and heterogeneous nature of the 8p11 amplicon in this disease, as previously described by Malchers and colleagues. (9) Targeted exon sequencing, while encompassing many genes, does not provide sufficient gene coverage to perform a chromosomal-level analysis of the 8p11 amplicon. Our gene expression data does, however, provide strong evidence of heterogeneity in the 8p11 amplicon, as the patterns of gene expression in our patients’ tumors were strikingly different from those seen in the FGFR1 amplified cell lines. That these cell lines are exquisitely sensitive to FGFR1 pharmacologic inhibition suggests that these differences are biologically meaningful.
In line with the gene expression results, FGFR1 protein expression poorly correlated with gene amplification, with 5 of 8 tumor samples showing no or very low protein expression, including the one from our confirmed partial responder (Patient 7, though this may reflect a false negative result in the absence of confirmatory gene expression data). As FGFR1 amplification correlates poorly with gene and protein expression, we question the functional relevance of these biomarkers assessed in isolation for most patients, a concern raised by investigators in other studies. (10) It is worth noting that some of this may be due to intra- and inter-tumoral heterogeneity as suggested by variability in FGFR1 protein and gene expression in different tumor specimens tested from the same patient and from other work published by us previously. (11) It is also worth noting that none of our patients had tumors that were “triple positive” (high FGFR1 gene amplification, gene expression, and protein expression), and so we were unable to assess the predictive impact of a tumor with consistent high-level expression of FGFR1, which might define a smaller, targetable subset of FGFR1 amplified SQCLCs. Indeed, the 4 SQCLC PDXs generated by Zhang and colleagues that showed tumor regression or sustained growth inhibition in response to AZD4547 also showed high levels of FGFR1 protein expression by IHC and western blot relative to the negative control. (4) The one FGFR1 amplified PDX that did not (L133) respond to drug exhibited low levels of FGFR1 protein expression by IHC and western blot. And while Camidge and colleagues have detailed the predictive value of very high levels of MET amplification (ratio ≥ 5) in NSCLC (12), the lack of responses in our study and poor correlation with protein/RNA expression limits our ability to comment on patients whose tumors bear very high degrees of FGFR1 amplification.
Second, other factors may be at play in dictating sensitivity to FGFR1 inhibition in the patients who demonstrated tumor response in our study. Examples include Patient 15’s tumor (-12%), which harbored an FGFR3 S249C mutation, a common activating mutation in bladder cancer that causes ligand-independent dimerization and phosphorylation of the receptor with known susceptibility to FGFR inhibition (13, 14). Patient 6’s tumor (-20%) contained two somatic missense mutations in FGFR1, including a mutation (D93Y) in the first immunoglobulin (Ig)-like domain (D1). While the functional relevance of this mutation is not known, crystallographic work suggests that it might alter the ability of the D2 Ig-like domain to bind to heparin, which is required for ligand-independent activation of the receptor (15).
Patient 7 was the only patient to develop a PR to AZD4547. Interestingly, sequencing uncovered a NOTCH1 E1929* nonsense mutation, which causes deletion of the key C-terminal ankyrin repeats in Notch1. Notch1 is a type 1 transmembrane receptor that has important roles in determining cell differentiation, proliferation, and survival. The C-terminal Notch Intracellular Domain (NICD) consists of seven highly conserved ankyrin repeats. Activation of Notch1 causes cleavage of the NICD, which localizes to the nucleus and acts as a transcriptional activator (16). Deletion of the NICD creates a dominant negative form of the protein (17). Small and colleagues (16) previously showed that Notch1 repression potentiates the oncogenicity of wild-type FGFR1. NIH 3T3 cells stably transfected with a dominant negative form of Notch1 (lacking the NICD) exhibited anchorage-independent growth and robust colony formation upon FGF1 simulation that was not seen in Notch1-active conditions. This effect was abrogated by the addition of the FGFR1 inhibitor PD166866. Notch1 repression was also associated with the induction of FGF1, 3, 4, and 5 mRNA and protein suggesting that autocrine production of FGFR1-activating ligands may determine the degree to which FGFR1 is an oncogenic driver. This is in keeping with data from Malchers and colleagues (9), who identified autocrine production of FGF2 as a potential mediator of response to FGFR1 inhibition in an FGFR1 amplified SQCLC model. While MYC expression was also assessed, Patients 6 and 7 (−20%, −35% response) had insufficient tumor material for testing, preventing us from ruling-out lack of MYC expression as a potential sensitizer. (9)
Finally, paired pre-treatment/post-treatment tumor biopsies were not obtained in this study, precluding a direct assessment of FGFR1 pathway inhibition. That said, the observed elevation in serum phosphate is a well-characterized on-target effect of the drug attributable to inhibition of FGF23 signaling through FGFR1 in the kidney. We note that the antecedent phase 1 dose finding study showed that higher doses of AZD4547 induced greater elevations in serum phosphate. Higher drug doses might, therefore, yield an improvement in efficacy, though with increased and likely unacceptable toxicity.
In conclusion, AZD4547 appears to have modest efficacy in patients with previously treated stage IV FGFR1 amplified SQCLC. Gene amplification does not correlate well with gene and protein expression. Other common genomic modifiers, specifically G1/S checkpoint aberrations and PI3K pathway alterations, do not appear to mediate sensitivity to FGFR1 inhibition. Gene expression analysis of the 8p11 amplicon demonstrates divergent patterns of expression in our patients’ tumors compared to FGFR1 amplified cell lines, the latter of which are known to be exquisitely sensitive to drug inhibition. Future studies should move away from FGFR1 gene amplification and expression as predictive biomarkers and focus instead on discrete genomic events involving the FGFRs (missense mutations, translocations) or more detailed assessments of 8p11 amplification or pathway activation as predictors of response. Until this occurs, combinatorial therapy coupling FGFR1 inhibition with, for example, PI3K or CDK4/6 inhibition is also unlikely to work. This is of particular clinical relevance as large-scale targeted therapy efforts in this disease, such as SWOG’s S1400 (LUNG-MAP) protocol, move beyond their first-generation monotherapy efforts to consider other therapeutic strategies.
Supplementary Material
Supplementary File 1- MSK-IMPACT gene list.
Supplementary File 2- nanoString codeset list.
Supplementary File 3- Percent tumor cell content in H&E slides from patients where available.
Supplementary File 4- Treatment history for each patient where available.
Supplementary File 5- Next-generation sequencing data by patient.
Supplementary File 6- AZD4547 dose intensity.
Supplementary Figure 1- Evidence of FGFR1 heterogeneity by FISH in samples from the same patient. FGFR1 FISH images from Patient 4 (A) and patient untreated on the study (B, Patient X) are shown. Patient 4’s samples were both taken from the lung, with one showing amplification and the other showing polysomy. Patient X’s samples were taken from a soft tissue lesion and the lung, with the former showing gene amplification and the latter, 2–3 copies per cell without amplification.
Supplementary Figure 2- C2D1 and C3D1 PK data with reference to response.
Statement of Translational Relevance.
Initial attempts at identifying targeted therapies for patients with squamous cell lung cancers (SQCLC) have largely failed, despite relatively detailed knowledge of the somatic events that occur in these cancers. The reasons for this are not clear. Current hypotheses center around the functional validity of the current panel of biomarkers and the role of genomic complexity as it relates to bypass pathways. None of this has been shown to be clinically relevant to date. We present clinical and molecular data that show that targeted therapy development for FGFR1 amplified SQCLCs will need to adjust for the molecular complexity of these tumors in a more comprehensive fashion for existing and future trials, with implications for other targeted efforts in this disease.
Acknowledgments
Funding: P30 CA008748
References
- 1.TCGA Network. Comprehensive genomic characterization of squamous cell lung cancers. Nature. 2012;489(7417):519–25. doi: 10.1038/nature11404. [DOI] [PMC free article] [PubMed] [Google Scholar]
- 2.Hammerman PS, Sos ML, Ramos AH, Xu C, Dutt A, Zhou W, et al. Mutations in the DDR2 Kinase Gene Identify a Novel Therapeutic Target in Squamous Cell Lung Cancer. Cancer Discovery. 2011;1:78–89. doi: 10.1158/2159-8274.CD-11-0005. [DOI] [PMC free article] [PubMed] [Google Scholar]
- 3.Weiss J, Sos ML, Seidel D, Peifer M, Zander T, Heuckmann JM, et al. Frequent and Focal FGFR1 Amplification Associates with Therapeutically Tractable FGFR1 Dependency in Squamous Cell Lung Cancer. Science Translational Medicine. 2010;2:62ra93. doi: 10.1126/scitranslmed.3001451. [DOI] [PMC free article] [PubMed] [Google Scholar]
- 4.Zhang J, Zhang L, Su X, Li M, Xie L, Malchers F, et al. Translating the Therapeutic Potential of AZD4547 in FGFR1-Amplified Non–Small Cell Lung Cancer through the Use of Patient-Derived Tumor Xenograft Models. Clinical Cancer Research. 2012;18:6658–67. doi: 10.1158/1078-0432.CCR-12-2694. [DOI] [PubMed] [Google Scholar]
- 5.Cheng D, Mitchell T, Zehir A, Shah R, Benayed R, Syed A, et al. MSK-IMPACT: A hybridization capture-based next generation sequencing clinical assay for solid tumor molecular oncology. J Mol Diagn. 2014 doi: 10.1016/j.jmoldx.2014.12.006. in press. [DOI] [PMC free article] [PubMed] [Google Scholar]
- 6.Won H, Scott S, Brannon A, Shah R, Berger M. Detecting Somatic Genetic Alterations in Tumor Specimens by Exon Capture and Massively Parallel Sequencing. J Vis Exp. 2013;80:e50710. doi: 10.3791/50710. [DOI] [PMC free article] [PubMed] [Google Scholar]
- 7.Nogova L, Sequist LV, Garcia JMP, Andre F, Delord J-P, Hidalgo M, et al. Evaluation of BGJ398, a Fibroblast Growth Factor Receptor 1–3 Kinase Inhibitor, in Patients With Advanced Solid Tumors Harboring Genetic Alterations in Fibroblast Growth Factor Receptors: Results of a Global Phase I, Dose-Escalation and Dose-Expansion Study. Journal of Clinical Oncology. 2017;35:157–65. doi: 10.1200/JCO.2016.67.2048. [DOI] [PMC free article] [PubMed] [Google Scholar]
- 8.Lim SH, Sun J-M, Choi Y-L, Kim HR, Ahn S-M, Lee JY, et al. Efficacy and Safety of Dovitinib in Pretreated Advanced Squamous Non-small Cell Lung Cancer with FGFR1 Amplification: A Single-arm, Phase II Study. Cancer. 2016 doi: 10.1002/cncr.30135. [DOI] [PubMed] [Google Scholar]
- 9.Malchers F, Dietlein F, Schöttle J, Lu X, Nogova L, Albus K, et al. Cell-autonomous and non-cell-autonomous mechanisms of transformation by amplified FGFR1 in lung cancer. Cancer Discovery. 2013 doi: 10.1158/2159-8290.CD-13-0323. [DOI] [PubMed] [Google Scholar]
- 10.Wynes MW, Hinz TK, Gao D, Martini M, Marek LA, Ware KE, et al. FGFR1 mRNA and Protein Expression, not Gene Copy Number, Predict FGFR TKI Sensitivity across All Lung Cancer Histologies. Clinical Cancer Research. 2014;20:3299–309. doi: 10.1158/1078-0432.CCR-13-3060. [DOI] [PMC free article] [PubMed] [Google Scholar]
- 11.Paik PK, Shen R, Won H, Rekhtman N, Wang L, Sima CS, et al. Next-Generation Sequencing of Stage IV Squamous Cell Lung Cancers Reveals an Association of PI3K Aberrations and Evidence of Clonal Heterogeneity in Patients with Brain Metastases. Cancer Discovery. 2015;5:610–21. doi: 10.1158/2159-8290.CD-14-1129. [DOI] [PMC free article] [PubMed] [Google Scholar]
- 12.Camidge D, Ou S-HI, Shapiro G, Otterson G, Vilaruz L, Villalona-Calero M, et al. Efficacy and safety of crizotinib in patients with advanced c-MET-amplified non-small cell lung cancer (NSCLC) J Clin Oncol. 2014;32:5s:8001. [Google Scholar]
- 13.Tomlinson DC, Hurst CD, Knowles MA. Knockdown by shRNA identifies S249C mutant FGFR3 as a potential therapeutic target in bladder cancer. Oncogene. 2007;26:5889–99. doi: 10.1038/sj.onc.1210399. [DOI] [PMC free article] [PubMed] [Google Scholar]
- 14.Tomlinson DC, Lamont FR, Shnyder SD, Knowles MA. Fibroblast Growth Factor Receptor 1 Promotes Proliferation and Survival via Activation of the Mitogen-Activated Protein Kinase Pathway in Bladder Cancer. Cancer Research. 2009;69:4613–20. doi: 10.1158/0008-5472.CAN-08-2816. [DOI] [PMC free article] [PubMed] [Google Scholar]
- 15.Huhtala MT, Pentikäinen OT, Johnson MS. A dimeric ternary complex of FGFR1, heparin and FGF-1 leads to an ‘electrostatic sandwich’ model for heparin binding. Structure. 1999;7:699–709. doi: 10.1016/s0969-2126(99)80091-4. [DOI] [PubMed] [Google Scholar]
- 16.Small D, Kovalenko D, Soldi R, Mandinova A, Kolev V, Trifonova R, et al. Notch Activation Suppresses Fibroblast Growth Factor-dependent Cellular Transformation. Journal of Biological Chemistry. 2003;278:16405–13. doi: 10.1074/jbc.M300464200. [DOI] [PubMed] [Google Scholar]
- 17.Rebay I, Fehon RG, Artavanis-Tsakonas S. Specific truncations of Drosophila Notch define dominant activated and dominant negative forms of the receptor. Cell. 1993;74:319–29. doi: 10.1016/0092-8674(93)90423-n. [DOI] [PubMed] [Google Scholar]
Associated Data
This section collects any data citations, data availability statements, or supplementary materials included in this article.
Supplementary Materials
Supplementary File 1- MSK-IMPACT gene list.
Supplementary File 2- nanoString codeset list.
Supplementary File 3- Percent tumor cell content in H&E slides from patients where available.
Supplementary File 4- Treatment history for each patient where available.
Supplementary File 5- Next-generation sequencing data by patient.
Supplementary File 6- AZD4547 dose intensity.
Supplementary Figure 1- Evidence of FGFR1 heterogeneity by FISH in samples from the same patient. FGFR1 FISH images from Patient 4 (A) and patient untreated on the study (B, Patient X) are shown. Patient 4’s samples were both taken from the lung, with one showing amplification and the other showing polysomy. Patient X’s samples were taken from a soft tissue lesion and the lung, with the former showing gene amplification and the latter, 2–3 copies per cell without amplification.
Supplementary Figure 2- C2D1 and C3D1 PK data with reference to response.