

Abstract
Early detection of metastasis can be aided by circulating tumor cells (CTCs), which also show potential to predict early relapse. Due to the limited CTC numbers in peripheral blood in early stages, we investigated CTCs in pulmonary vein blood accessed during surgical resection of tumors. Pulmonary vein (PV) and peripheral vein (Pe) blood specimens from patients with lung cancer were drawn during the perioperative period and assessed for CTC burden using a microfluidic device. From 108 blood samples analyzed from 36 patients, PV had significantly higher number of CTCs compared to pre-operative Pe (p<0.0001) and intra-operative Pe (p<0.001) blood. CTC clusters with large number of CTCs were observed in 50% of patients, with PV often revealing larger clusters. Long term surveillance indicated that presence of clusters in pre-operative Pe blood predicted a trend toward poor prognosis. Gene expression analysis by RT-qPCR revealed enrichment of p53 signaling and extracellular matrix involvement in PV and Pe samples. Ki67 expression was detected in 62.5% of PV samples and 59.2% of Pe samples, with the majority (72.7%) of patients positive for Ki67 expression in PV having single CTCs as opposed to clusters. Gene ontology analysis revealed enrichment of cell migration and immune-related pathways in CTC clusters, suggesting survival advantage of clusters in circulation. Clusters display characteristics of therapeutic resistance, indicating the aggressive nature of these cells. Thus, CTCs isolated from early stages of lung cancer are predictive of poor prognosis and can be interrogated to determine biomarkers predictive of recurrence.
Keywords: Lung cancer, circulating tumor cells (CTCs), CTC clusters, microfluidics, metastasis
Introduction
Circulating tumor cells (CTCs) and cell-free DNA are emerging as promising tools for rapid, convenient and less-invasive screens for detecting and monitoring a patient’s cancer (1). CTCs play an important role in metastasis, which accounts for majority of cancer deaths (2–5). These cells can provide useful prognostic information and can also be utilized to make therapeutic decisions in clinical cancer management (2,4,6–8). The biology of CTCs have been explored extensively mostly in advanced stages of cancer wherein their typically greater numbers enables useful downstream analysis (9). Such studies in early stages have been limited by the low number of these cells (10). In order to understand early events and the role of CTCs in initiation of the metastatic cascade, it is essential to understand phenotypic and genotypic characteristics of CTCs in earlier stages of cancer.
Lung cancer, the leading cause of cancer-related deaths across the world (2,11–13), provides a potential model to study the utility of CTCs, which may be used toward disease screening. The disease has a poor survival rate of 5% for stage IV disease with the dismal survival rate attributed to the lack of early detection (12). The high incidence and pressing need to improve survival calls for improved early diagnostic tools. Assessing CTCs can offer repeated monitoring of patients, a useful way of observing patients for relapse after resection (14). In this study, we aimed at identifying specific characteristics of CTCs in patients undergoing surgery for early stage lung cancer. However, their rarity in the bloodstream (few CTCs among millions of blood cells) required alternate strategies for sequestering them to better examine their biological potential (6,15).
In order to overcome the limitation of the low frequency of CTCs, we decided to study these cells when enriched near their origin, i.e. from the pulmonary vein of the affected lobe which can be accessed at the time of tumor resection. There have been few studies documenting the presence of CTCs in the pulmonary veins of patients with lung cancer (16,17). One study showed that the presence of CTCs in the pulmonary vein indicated a poor prognosis relative to those with an absence of CTCs in the tumor draining vein (17). Also, the pulmonary vein shows a significantly high number of CTCs relative to that obtained through conventional peripheral vein methods (16,18). The higher yields obtained from the PV offers a useful strategy to study CTCs and their role in tumor progression. While a few studies have investigated the pulmonary vein as a potential source of increased CTCs (16,17,19–22), most of these studies utilized the CellSearch EpCAM-based platform, negative selection and/or centrifugation for enriching PV CTCs. This study is to our knowledge, novel in the following aspects: (a). None of the previous studies examined the differences in characteristics of CTCs from these different sources, especially at a genetic level, (b). In our study, CTCs were examined at multiple (≥ 2) time-points around surgical resection; this comparison of different time-points during the perioperative period would presumably indicate actual differences in CTCs obtained from different sources, (c). CTCs were isolated from the pulmonary and peripheral veins using microfluidics, a more sensitive platform for CTC detection (1) with the incorporation of multiple antibodies to capture diverse CTC populations, (d). Patients were monitored longitudinally to study the CTC changes from resection to follow-up, and (e). Gene expression profiling by RT-qPCR for 96 genes revealed differentially expressed genes between the different CTC sources. We thus hypothesized that PV CTCs will offer a useful strategy for obtaining higher CTC yields from early stage lung cancer where peripheral CTCs might be inadequate; furthermore, CTCs from the pulmonary vein may provide molecular markers of invasion and metastasis that could inform surveillance biomarkers during follow-up to detect early recurrence and metastasis.
Materials and Methods
Microfluidic isolation of CTCs using OncoBean Chip
The OncoBean Chip, a previously reported microfluidic device for CTC capture (23), was utilized for CTC isolation in the present study. The OncoBean Chip is a high-throughput device, with a radial flow profile that enables high capture even at high flow rates (Figure S1). The device gave a mean capture yield >80% with lung cancer cell line H1650 spiked into blood even when operated at a throughput of 10 ml/hr. The device was also tested at different flow rates from 1 – 10 ml/hr and showed efficient capture at high flow rates compared to the standard flow rate of 1 ml/hr. Clinical specimens were also analyzed to test the clinical efficacy of the OncoBean Chip (23).
Patient Demographics
The study was conducted according to the Declaration of Helsinki, Belmont Report and U.S. Common Rule guidelines, and was approved by an Institutional Review Board (IRB). Informed consent was obtained from patients. Patients with surgically resectable (clinical stage I-III) lung cancer were enrolled into the study at the time of surgery. Thirty-six patients underwent surgery (NSCLC=35, SCLC=1) (Table S1). Among NSCLC group, there were 20 patients with adenocarcinoma and 15 with squamous cell lung cancer. When broken down by pathologic stage, among the NSCLC patients, 19 patients were stage I, 7 were stage II and 8 were stage III. One patient was found to have stage IV disease, with metastatic disease found 3 weeks after surgery. The median age of patients was 70 years, and the population consisted of 15 males and 21 females.
Isolation of pulmonary and peripheral vein CTCs from early stage lung cancer patients
Blood specimens were processed through the OncoBean Chip at a flow rate of 5 ml/hr, using combinations of antibodies against Epithelial Cell Adhesion Molecule (EpCAM), Epidermal Growth Factor Receptor (EGFR), and CD133. Previously described protocol for blood sample processing (6,23) was followed with a few modifications. Briefly, following antibody incubation, the devices were blocked with 3% bovine serum albumin (BSA). An average of 4.3, 4.0 and 2.0 ml of Pre-op Pe, Intra-op Pe and Intra-op PV blood was processed for CTC analysis through each device. Blood was processed through the device at 5 ml/hr followed by washing with phosphate buffered saline (PBS). After washing, the cells captured on the device were fixed with 4% paraformaldehyde (PFA) for enumeration. Devices were stored at 4 °C until immunostaining was performed.
Immunofluorescent staining was performed by first permeabilizing the cells with 0.2% Triton-X 100, followed by blocking with 3% BSA + 2% normal goat serum. Primary antibodies Cytokeratin 7/8 and CD45 and secondary antibodies Alexa Fluor 546 and Alexa Fluor 488 respectively were used to identify the cells.
CTC Identification and Analysis
Cells captured on the device were stained for Cytokeratin (CK) 7/8, CD45 and DAPI. The devices were automatically imaged by Nikon Ti Eclipse fluorescence microscope. CTCs were counted based on positive staining for CK and DAPI and negative staining for CD45.
Other Immunocytochemistry
Devices containing CTC clusters and pre-stained for enumeration were additionally stained for anti-CD44 and visualized by Alexa Fluor 647. Positive staining among CTCs was identified by CK7/8+, CD44+, CD45− and DAPI+.
Statistical Analysis for CTC enumeration
Statistical analyses were performed using OriginPro, SAS, and R (24). Enumerated CTCs from peripheral and pulmonary veins were compared by the Wilcoxon Signed Rank test for each pair of sources. CTC clusters were also analyzed by the Wilcoxon test. Significance is determined if p<0.05. Progression-free survival was estimated using the Kaplan-Meier method and compared using the log-rank test.
RNA extraction and RT-qPCR
RNA was extracted from 51 pulmonary and peripheral vein CTC enriched samples. For RNA extraction, the captured cells were lysed on chip immediately after PBS wash using Arcturus PicoPure RNA Extraction buffer. The lysate and the device were incubated at 42 °C for 30 min, followed by a wash with water and collection of effluent. All effluents were stored at -80°C until RNA analysis. The second effluent collected was processed to isolate RNA for cDNA synthesis and multiplex gene expression analysis. The total RNA samples were used to synthesize cDNA that were preamplified for the target 96 genes using a pool of TaqMan assays. Then the preamplified cDNA were subjected to qPCR to determine expression patterns of target 96 genes forming a “comprehensive CTC panel” using TaqMan assays and the Biomark HD instrument (Fluidigm).
Gene expression data analysis
Raw Ct values generated by Biomark HD (Fluidigm) were normalized to GAPDH for each sample using the -ΔCt method (25,26). Undetected transcripts automatically generate a Ct value of 999, which were changed to Ct of 40 for numerical analyses (25,26). Statistical analysis was performed using R software (24). Wilcoxon rank sum tests were used to calculate differential expression between PV and Pe groups, or between Clusters and Single CTCs groups. Samples containing more than 50% of their CTCs in clusters of any size, and/or samples consisting of clusters with >=5 or >=10 CTCs within them were considered as ‘Cluster’, while other samples were considered as ‘Single’. Samples containing 0 CTCs by enumeration were discarded from the analysis of Cluster vs Single CTCs. Log2 fold change was calculated from median expression (2-ΔCt) values for each group of samples relative to the respective comparison group. Heatmaps were generated using the heatmap.2 function under the gplots library of R. The p-values generated by the Wilcoxon rank sum tests, and the log2FC from median expression values were input into a pathway analysis software, IPathwayGuide (AdvaitaBio). For PV versus Pe gene expression comparisons, a log2FC cut-off of 2.0 and p-value cut-off of 0.05 was used. For pathway analysis of Clusters and Single CTC categories, log2FC cut-off of 0.3 and p-value cut-off of 0.05 was used to determine differentially expressed genes.
DNA isolation and mutational analysis
DNA was extracted from fixed (samples M1, M4) and fresh (samples M2, M3) patient samples using the Arcturus PicoPure DNA Extraction Kit. Manufacturer’s protocols were adapted and modified for microfluidic extraction. Extracted DNA was concentrated using the Cleanup Protocol of the QiAmp DNA Micro Kit (Qiagen). All DNA samples, with the exception of sample M4-pulmonary, were amplified using the REPLI-g UltraFast Mini Kit (Qiagen) for whole genome amplification. Sample M4-pulmonary was used for mutational analysis without amplification. DNA quality and quantity were measured using TapeStation Genomic Tape (DNA Sequencing Core, University of Michigan). Mutations were detected using the qBiomarker Somatic Mutation PCR Array: Human Lung Cancer (Qiagen/SABiosciences) in the 384-well format (96x4) and the ABI 7900HT (384-well Fast Block). The average Ct method was used for analysis of mutations as per manufacturer recommended template.
Results
Strategy for CTC analysis
Pre-operative peripheral (Pre-op Pe) blood was collected 0-2 hours prior to surgery. During the initial phases of the operation, the pulmonary vein branches draining the cancer containing lobe of the lung were identified (Figure 1). Blood was drawn from the pulmonary vein (Intra-op PV) via a 25-gauge needle early in the operation, prior to significant lung or tumor manipulation. Simultaneously, blood was drawn from a peripheral vein or arterial line (Intra-op Pe). Finally, a post-operative peripheral (Post-op Pe) blood draw was performed within 1-3 days of surgery. Follow-up blood was drawn via a peripheral vein at the time of follow-up visits. Blood specimens were collected in EDTA tubes and processed on the same day for CTC analysis.
Figure 1.
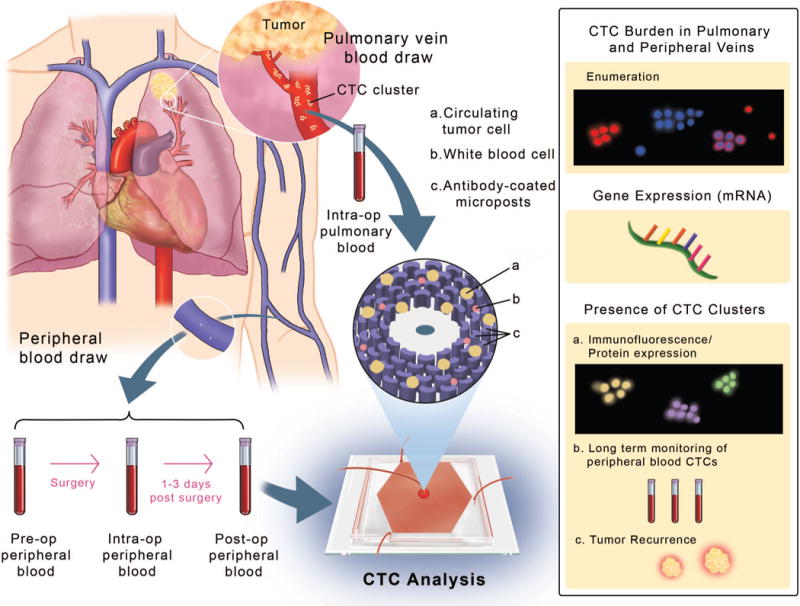
Study schematic representing the anatomy of the lung displaying the pulmonary vein (PV) and peripheral veins (Pe). Blood was drawn from the veins at different time-points around tumor resection and processed through the OncoBean Chip, followed by analysis by enumeration and genomic profiling (inset on right).
Whole blood samples from patients and healthy donors (Figure S2) were processed using a high-throughput radial flow microfluidic device, the OncoBean Chip (23) at a flow rate of 5 ml/hr, using different combinations of antibodies against Epithelial Cell Adhesion Molecule (EpCAM), Epidermal Growth Factor Receptor (EGFR) and CD133.
CTC burden in different venous sources
Captured cells were enumerated by immunostaining for Cytokeratin (CK) 7/8 and CD45, in addition to DAPI. Cells positive for Cytokeratin 7/8 and DAPI, and negative for leukocyte specific marker CD45 were scored as CTCs (Figure 2A). Since PV blood volumes were most often limited to 3 ml, CTC numbers are reported per 3 ml. From 36 patients analyzed, CTCs were detected in the pre-op peripheral (pre-op Pe), intra-op peripheral (intra-op Pe) and intra-op pulmonary vein (intra-op PV) in 77.8%, 69.4% and 83.3% of patients respectively. The range of detected CTCs in the pre-op Pe varied from 0–15 CTCs per 3 ml, with a median of 1.5 CTCs per 3 ml. The intra-op Pe had a detection range of 0–28.5 CTCs per 3 ml with a median count of 1.3 CTCs per 3 ml. The intra-op PV specimens showed CTCs in the range of 0–10,278 per 3 ml, with a median of 7.5 CTCs per 3 ml (Figure 2B). Microfluidic capture confirmed that a significantly higher number of CTCs were detected from the PV when compared to the pre-op (p <0.0001) and intra-op (p<0.001) Pe samples, as determined by the Wilcoxon Signed Rank test (Figure 2C). The pre-op and intra-op Pe samples did not show a significant difference in CTC numbers (p = 0.34).
Figure 2.
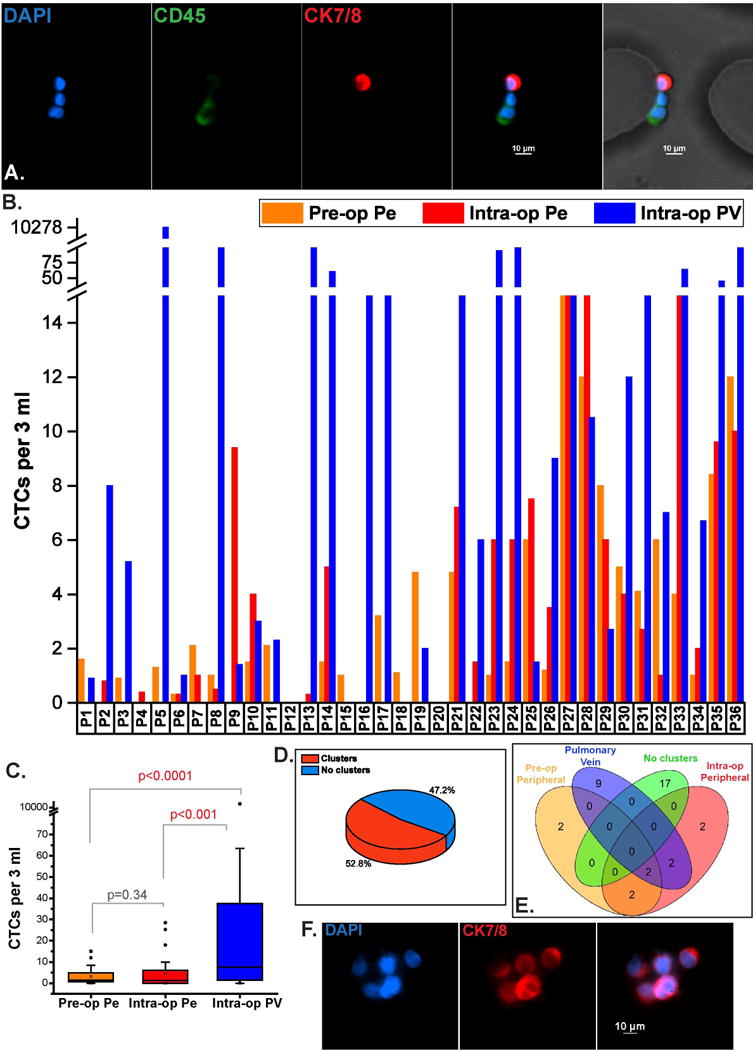
CTC enumeration from different venous sources. (A). Immunofluorescent staining of captured cells showing a CTC (CK7/8+, DAPI+, CD45-) captured next to CD45+ blood cells on the OncoBean Chip, (B). CTC burden from pre-op Pe, intra-op Pe and intra-op PV samples across 36 patients, (C). Range of CTCs from different sources showing higher CTC abundance in PV, (D). Frequency of CTC clusters observed in all patients at any time-point, (E). Individual incidence of CTC clusters in each venous specimen among all samples, (F). Immunofluorescent staining of CTC clusters captured in a lung cancer patient.
CTC cluster analysis
CTC clusters have been detected in a few cancers, and studies indicate that they have a greater capability to metastasize (27). CTC clusters, defined here as groups of 2 or more CTCs captured within close proximity of each other were observed in large numbers in the pulmonary vein of one patient (P5) early on in our study, which led to further investigation of these aggregates in subsequent samples in the different blood sources. CTC clusters were detected in 52.7% of the 36 patients irrespective of the blood source (Figure 2D). Among patients with observed clusters (19/36), the average volumes of blood processed were 3.5 ml of pre-op Pe, 3.3 ml of intra-op Pe and 1.8 ml of PV. Clusters in PV were observed in 13/36 (36.1%) patients, while 6/36 (16.6%) and 8/36 (22.2%) patients had clusters in pre-op and intra-op Pe samples respectively, with 6 patients having clusters in multiple time-points (Figure 2E). Representative immunofluorescence staining images of clusters are shown in Figure 2F.
The clusters in PV varied in size from 2 CTCs to >200 CTCs, while those in either Pe group ranged from 2-9 CTCs. A total of 9 clusters (range 0–3) were observed in pre-op Pe, 22 clusters (range 0–6) were detected in intra-op Pe, and 1116 clusters (range 0–885) in PV were observed among all patients. Of these, 593 (53.1%) of PV clusters consisted of >= 5 CTCs, and 319 (28.6%) of these clusters were comprised of >=10 CTCs. Examples of different CTC cluster sizes are shown in Figure 3A. A distribution of the clusters segregated by their size is also shown in Figure 3B. With the exception of patient P9, the peripheral blood yielded small clusters (<5 CTCs), while the PV had a heterogeneous size distribution of captured CTC clusters in 7/13 samples (Figure 3B). In the 36 patient samples in which clusters of CTCs were found (n=19), the number of CTCs in clusters compared to the total number of CTCs present as both clusters and single cells was analyzed. The PV showed a higher median percentage of clustered CTCs to total CTCs when compared to pre-op Pe and intra-op Pe. The PV also showed capture of bigger clusters than the two peripheral sources (p<0.05) for clusters with ≥5CTCs and for clusters with ≥10CTCs, whereas no difference was observed among the peripheral sources. Intriguingly, the number of clusters with >5 or >10 CTCs showed an increasing trend with the disease stage, although statistical significance was not observed due to the small sample size (Figure S3). However, the percentage of CTCs in clusters in pre-op peripheral blood were significantly associated with stage (p=0.0061 by Kruskal Wallis test). Moreover, patients with CTC clusters in the Pre-op Pe blood showed a trend towards lower progression free survival (PFS) than those patients without clusters (p= 0.1058 by log-rank test), indicating the potential clinical relevance of CTC clusters even in early stage lung cancer (Figure 3C).
Figure 3.
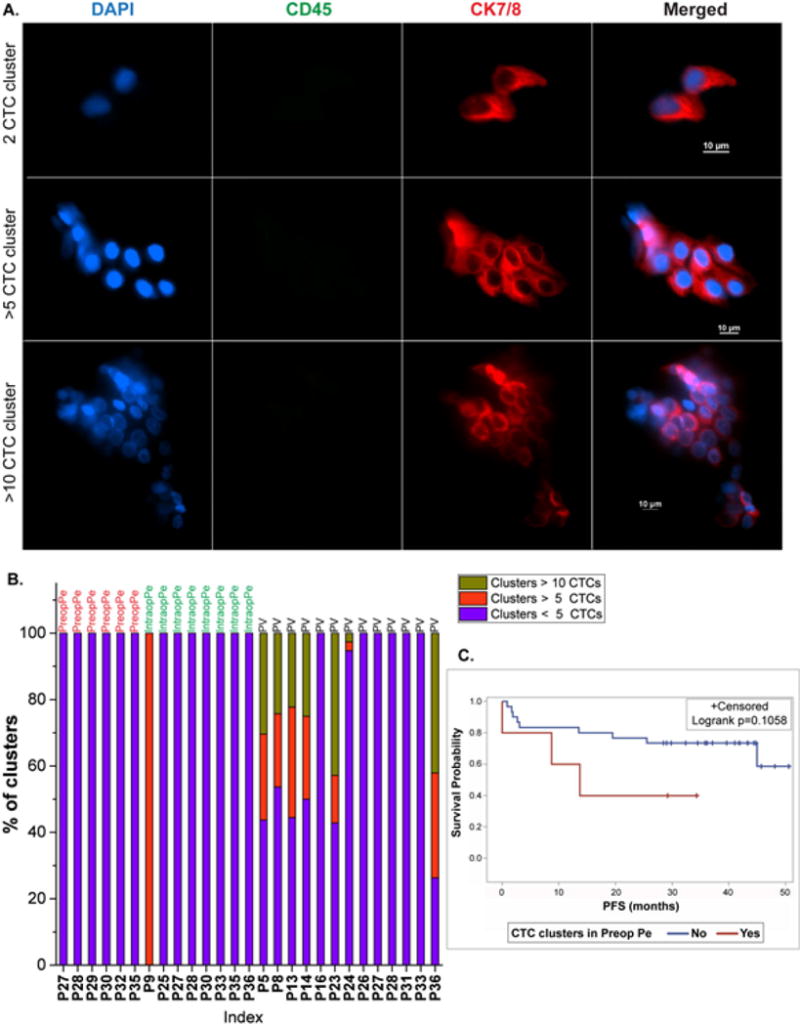
CTC clusters in lung cancer patients. (A). Immunofluorescent staining images of captured CTC clusters showing a 2 CTC cluster, >5 CTC cluster, and >10 CTC cluster, (B). Distribution of sizes of the clusters obtained from cluster positive specimens, (C). Survival curves showing comparison of progression free survival (PFS) in patients with clusters (red) and without clusters (blue) in the Pre-op Pe blood.
Monitoring of patients with CTC clusters
CTC clusters have been shown to be associated with poor prognosis (20,27). It is also believed that the cells within clusters can escape cell death (28). Considering their prognostic significance and their ability to survive, we sought to monitor patients with detectable perioperative CTC clusters. The objective was to examine if the CTC numbers in the peripheral vein during follow-up were associated with the presence of clusters or by higher numbers of CTCs in the PV at the time of resection. For 12 patients, 6 had >1 follow-up time-points, and the median duration at the time of follow-up blood draw was 10 months, with a range of 2-26 months. Original analysis had revealed that 4 of these patients had clusters with >10CTCs, one patient had clusters with >5CTCs, 7 patients had clusters of 2-5CTCs evident in their PV, pre-op Pe or intra-op Pe. Figure 4 represents CTCs per 3 ml from the peripheral vein at pre-op, intra-op and post-op Pe time intervals in addition to the follow-up longitudinal time-point(s). CTCs per 3 ml from the PV are also shown for each patient. 7/12 (58.3%) patients had persistent CTCs (>2 CTCs per 3 ml) at their last follow-up time point, and 9/12 (75%) patients had persistent CTCs at any long-term time-point. Interestingly, 6/9 (66.7%) patients with at least 50% CTCs found in clusters in any blood source had persistent CTCs at last follow-up. Surveillance data collected indicated that out of 9 patients in our overall 36 patient cohort who were positive for recurrence, 6 patients had CTC clusters in one or more of their blood sources.
Figure 4.
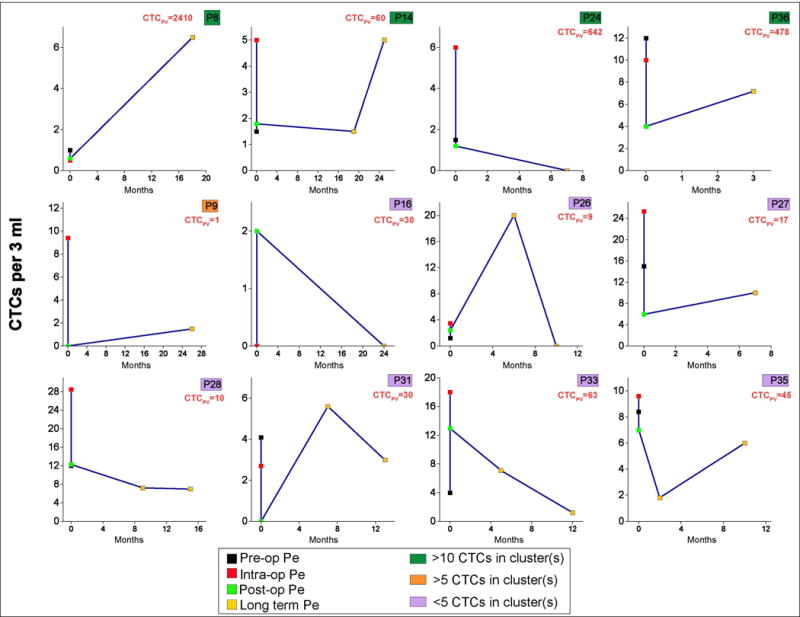
Longitudinal monitoring of patients with CTC clusters. PV CTC numbers at initial analysis are indicated in orange. Color keys shown in green, yellow and pink represent cluster sizes.
mRNA expression profiling of captured CTCs
The PV and Pe as sources of CTCs demonstrated macroscopic differences in enumerated CTCs and populations of cells captured (single or clusters). In order to compare genotypic differences, we examined the CTCs at the transcript level using Fluidigm Biomark HD system to perform quantitative RT-PCR for a 96 gene “comprehensive CTC panel”. We first analyzed 26 samples (13 PV and 13 Pe) for gene expression. Three housekeeping genes GAPDH, RAB7A and HPRT1 were used as reference. While HPRT1 was detected inconsistently among the samples, GAPDH and RAB7A showed similar detection levels as evaluated by Ct values (Figure S4) among the 26 samples, and GAPDH was chosen as the reference for normalization. An additional set of 25 patient samples was added to the cohort, amounting to a total of 51 samples (24 PV and 27 Pe) for RNA analysis. After normalization to GAPDH using the ΔCt method (25,26), the gene expression patterns for PV and Pe specimens were compared (Figure S5). Figure 5 shows a clustering heat map of expression levels of genes among PV and Pe samples. The PV and Pe specimens did not segregate by unsupervised clustering, suggesting similarities in gene expression signatures. The genes that are expressed in both sources include mesenchymal genes namely TGFβ1, VIM (Vimentin) and CD44, oncogenes including PIK3CA, MAPK1, and BRAF, extracellular matrix (ECM) related genes such as ANXA2, SPARC, metastasis genes including MMP9, TIMP1, TIMP2, apoptotic genes such as MCL1, and inflammatory or cytokine related genes such as CXCR1, IL6R and IL8. The PV and Pe samples also showed significant differential expression of 7 genes (p<0.05) including TTF-1, EMP2 (epithelial membrane protein 2), COL3A1 and CCDC80 (extracellular matrix related) (29), TP53, KRAS and MS4A1 (p<0.05). The fold changes are indicated in Figure S6. The significantly differentially expressed genes with a log2FC greater than 2 were used to analyze enriched pathways in the PV compared to Pe samples. Pathway analysis (IPathwayGuide, Advaita Bio) revealed enrichment of ‘p53 signaling pathway’ (p=0.0012) and ‘cell cycle’ (p=0.0016) (Table S2). Representative hematoxylin and eosin staining of adenocarcinoma and squamous tumors, and immunohistochemical staining of tissues for p53 are shown in Figure S7. Furthermore, gene ontology analysis revealed enrichment of terms such as ‘positive regulation of cell-substrate adhesion’ (p=0.009), ‘cell-substrate adhesion’ (p=0.01), ‘integrin-mediated signaling pathway’ (p=0.019) and ‘regulation of cell-substrate adhesion’ (p=0.03) (Table S3), suggesting the involvement of adhesion molecules and extracellular matrix in the dissemination of CTCs, as expected (27,29). Additionally, ‘Ras protein signal transduction’ was also an enriched GO term (p=0.04), again implicating cell migration and adhesion, and cell malignancy (30,31). The strong Cytokeratin staining of PV CTCs, and the higher expression of the epithelial gene EMP2 (p=0.02), combined with positive staining of anti-CD44, an EMT-related marker (32), in some of the PV clusters (Figure S8) also suggests the presence of an intermediate phenotype (expressing both epithelial and mesenchymal markers) of cells within the pulmonary vein CTCs.
Figure 5.
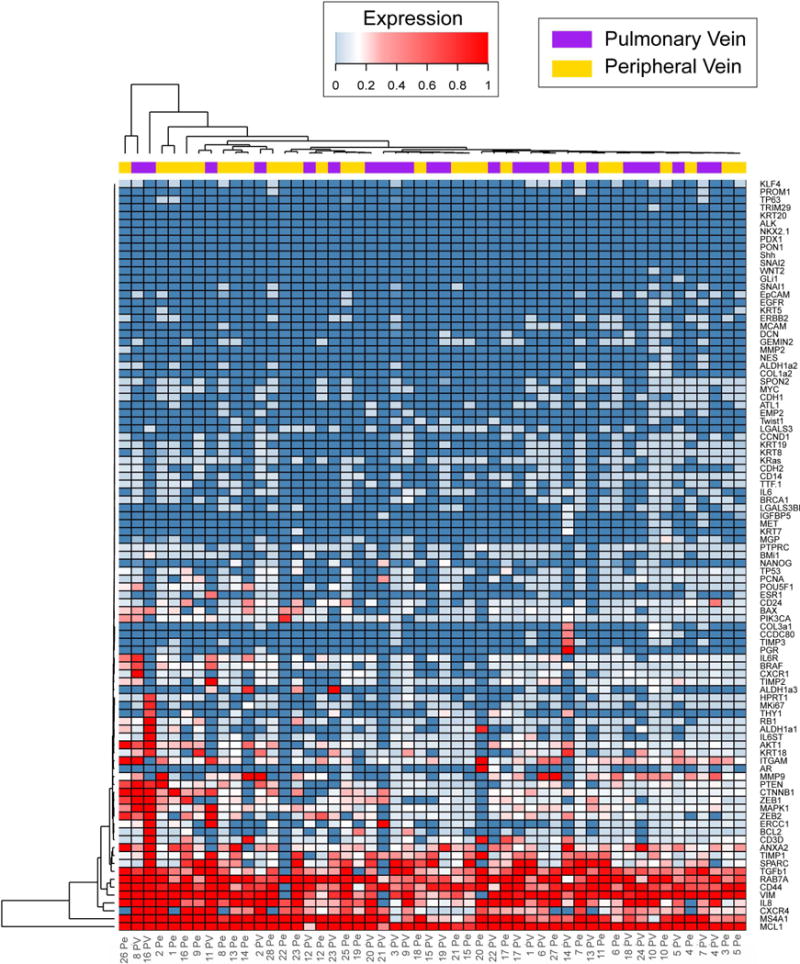
Gene expression profiling of PV and Pe samples by RT-qPCR showing unsupervised hierarchical clustering of PV and Pe gene expression (2(-ΔCt)). PV and Pe samples are indicated by purple and yellow bars respectively.
mRNA analysis performed according to the presentation of CTCs detected in the sample in single or clustered form, also revealed differential expression of 5 genes (p<0.05) between CTC clusters (n=13 samples) and single CTCs (n=27 samples). These genes included ESR1, PTPRC, IL6, RAB7A, and MAPK1. Figure 6A shows the log2 fold change of the median expression in each group of the above genes. Pathway analysis of differentially expressed genes (Figure S9) revealed upregulation of pathways such as ‘cytokine-cytokine receptor interaction’ (p=0.002), ‘IL-17 signaling pathway’ (p=0.013), ‘TNF signaling pathway’ (p=0.021), ‘Jak-STAT signaling pathway’ (p=0.036) suggesting activation of immune mechanisms in the clusters (Figure 6B). The ‘EGFR tyrosine kinase inhibitor resistance’ pathway was also highly significant (p=0.02), supporting the speculation that clusters are capable of contributing to drug resistance by either staying dormant, or by evading immune-activated cell death (33,34). ‘HIF-1 signaling pathway’ further corroborates this conjecture, since hypoxia is known to arm tumor cells with the ability to resist treatment (35,36). The clusters were also enriched for gene ontology terms relating to cell motility and locomotion, in addition to immune regulation, suggestive of their high migratory and cell survival capabilities (Figure 6C).
Figure 6.

Gene expression analysis of CTC clusters and single CTC samples. (A). log2FC of the significantly differentially expressed genes in clusters and single CTCs, (B). Top pathways (p<0.05) enriched in clusters vs single CTCs, (C). Top gene ontology terms (p<0.05) enriched in the analysis of clusters vs single CTCs.
Upon further analysis, it was revealed that Ki67, a proliferation marker, was expressed in 15/24 (62.5%) PV samples, and 16/27 (59.2%) Pe samples (Figure S10). It was also notable that Ki67 expression was not detected in any of the healthy controls (n=4). Interestingly, in the comparison of clusters and single CTCs, 8 out of 11 (72.7%) PV samples positive for Ki67 expression had single CTCs detected, while 57.1% of the clusters were negative for Ki67 expression (Figure S11). This is consistent with literature reports indicating that absence of proliferative markers could indicate resistance to chemotherapy treatment (33), again confirming the treatment resistance capability of clusters.
Mutational analysis of lung CTCs
The molecular characteristics of CTCs were further explored by mutational analysis of selected genes using the DNA isolated from captured CTCs. DNA was extracted from paired peripheral and pulmonary vein samples from patients M2 and M3, from peripheral vein blood of patient M1, and from pulmonary vein blood of patient M4. The qBiomarker Somatic Mutation PCR Array: Human Lung Cancer (Qiagen) was chosen to represent a comprehensive spectrum of frequently mutated genes in lung cancer. The array includes multiple assays for genes including AKT1, BRAF, CTNNB1, EGFR, ERBB2, HRAS, KRAS, NRAS, PIK3CA, STK11 and TP53. Using this array, mutations were detected in 5/6 samples tested involving at least one of the genes CTNNB1, EGFR, KRAS, PIK3CA and TP53 (Table 1). Interestingly, no mutations were detected in sample M1-peripheral, which had 0 CTCs detected by enumeration. TP53 mutations were detected in 5/6 samples, with all 3 pulmonary vein samples positive for TP53 mutations. The detailed list of specific somatic mutations for each gene tested is given in Table S4.
Table 1.
Mutational analysis of CTCs. Table shows detected mutations in peripheral (Pe) and pulmonary vein (PV) CTC samples from lung cancer patients.
| Mutations | |||||||||||
|---|---|---|---|---|---|---|---|---|---|---|---|
| Sample | AKT1 | BRAF | CTNNB1 | EGFR | ERBB2 | HRAS | KRAS | NRAS | PIK3CA | STK11 | TP53 |
| M1 Pe | − | − | − | − | − | − | − | − | − | − | − |
| M2 Pe | − | − | − | − | − | − | + | − | − | − | + |
| M2 PV | − | − | − | + | − | − | + | − | + | − | + |
| M3 Pe | − | − | − | − | − | − | − | − | + | − | + |
| M3 PV | − | − | + | − | − | − | + | − | + | − | + |
| M4 PV | − | − | − | − | − | − | − | − | − | − | + |
Discussion
The field of circulating tumor cells (CTCs) research has seen many breakthroughs, most if not all, with the common overarching theme of sampling from the peripheral blood. While the peripheral blood adds convenience to ease sampling constraints, analysis is hindered by issues of skin cell contamination during venipuncture (37), and detection of a diluted concentration of cells as the CTCs are being circulated through the entire vasculature. Despite these challenges, the peripheral blood has the advantage of more closely reflecting the metastasis initiating population of cells (38) since the identified cells would likely be on their passage to distant tumor formation. It would however be illuminating to identify CTCs at every “checkpoint” of their passage from dissemination to new tumor formation, as they can potentially indicate the dynamically changing behavior of tumor cells and the heterogeneity of tumors. We thus chose to study CTCs not only at different time-points, but also from different venous sources – the pulmonary vein presumably reflecting the origin of these escaping cells, and the peripheral vein presumably harboring cancer cells en route to distant metastasis. We have thus followed early stage lung cancer patients undergoing tumor resections through their surgery.
We demonstrate CTC capture and analysis using a high-throughput microfluidic device, the OncoBean Chip (23). Similar studies have been previously undertaken (16,17,19,21,22,39–41) in different cancers wherein different anatomical sources were investigated for CTCs. Morphological and molecular heterogeneity were observed in lung CTCs recovered from peripheral and pulmonary vein blood (20,28). While reinforcing these heterogeneities, our study also involves genomic profiling through RT-qPCR and mutational analysis, and long-term monitoring of patients with CTC clusters present, as they could have potential prognostic value (27).
Despite focusing on early stages of lung cancer, CTCs were isolated in the vast majority of the patient cohort in at least one time-point of blood draw. The pulmonary vein (PV) offers the advantage of being the first tumor draining vein for CTCs before passage of the blood onto the systemic circulation, and was presumed to have an enriched source of CTCs. This was indeed observed to be the case in the present cohort wherein a higher abundance of CTCs was found in comparison to the pre-op and intra-op peripheral samples. On the other hand, the peripheral vein samples collected before and during surgery did not show differences in CTC detection rates, suggesting that the CTC numbers do not vary significantly within a few hours of sampling from the same blood source. However, our data indicate that the PV could be thought of as a “storehouse” for CTCs until such time as they are ready for distant tumor seeding through the circulation. This is supported by the findings by Seinel et al. that the presence of CTCs in the PV is associated with poorer survival (17).
An advantage of the pulmonary vein sampling in combination with microfluidic recovery using the OncoBean Chip was the detection of CTC clusters. CTC clusters were detected in close to half the patient population in at least one time point, with the pulmonary vein accounting for majority of the cluster incidence. Studies have found that CTC clusters or microemboli have more metastatic potential than single CTCs (27,42), and that cells within the cluster may be protected from immune invasion and survive longer (28). Liotta et al. also found that bigger clusters produced more metastasis than smaller ones (42). This may have potential clinical relevance in predicting at resection the possibility of long term recurrence. For instance, 7 of 19 patients positive for clusters had big clusters (comprised of 10 or higher CTCs). These were only observed in the PV, while neither of the two peripheral specimens showed presence of >10 cell clusters. This suggests that most of these CTC clusters in the PV may not be able to enter the systemic circulation, or that bigger clusters may get lodged in areas of smaller vasculature (13). Alternatively, the PV could be accounting for the larger chunks of the tumor being shed into circulation, with most of these cells later undergoing anoikis (7,43) or otherwise leaving the system, and only the ones with the ability to survive the stresses in circulation continuing on (28).
Gene expression analysis by RT-qPCR revealed differences in the PV and Pe samples suggesting molecular heterogeneity in the two populations. Epithelial to mesenchymal transition (EMT) has been implicated in the tumor dissemination and metastatic process (44). Our gene expression data reveals the presence of intermediate phenotype cells (45–47) isolated from both pulmonary vein and peripheral veins. Pathway analysis reveals p53 signaling and cell cycle pathways in the PV. This could indicate activation of apoptotic mechanisms in the PV CTCs, thereby throwing light on why not all CTCs are capable of further metastasis. Contrastingly, it could indicate continuous DNA repair, suggestive of the malignancy of some of the PV CTCs. Indeed, authors Seinel et al. observed poorer survival of patients who were positive for CTCs in the pulmonary vein (17). This has important implications in lung tumor resections, as it evidences that tumor resections must be combined with CTC-eliminating strategies in order for surgery to be “curative”. Integrins and adhesion molecules were also enriched in the PV in gene ontology analysis. These may have important implications in suggesting the role of the tumor microenvironment (27,29) in the early stages of metastasis such as tumor cell intravasation and extravasation process. This in turn validates the aforementioned surmise that the PV CTCs could be thought of as the origin of the escaping tumor cells.
The higher expression of TP53 in the Pe CTCs might be indicative of the dynamic changes that CTCs undergo in the circulation in order to better survive shear stresses in the flow and/or to be invasive. The lower expression in the PV could indicate that p53 may not be transcriptionally active in the released cells (48) i.e. in the PV. DNA damage is one stress mechanism that may activate p53 (48), and the higher expression of the DNA repair gene ERCC1 in the PV suggests that the DNA repair mechanism was active in the cells released in the PV, thereby preventing activation of p53.
Ras protein signaling, implicated in the PV and Pe CTCs, is known to influence cell growth, survival and migration, in addition to malignancy of tumor cells (30). Ras protein signaling may be induced by growth factors (30). Targeting the Ras signaling pathway as a cancer treatment modality is now an area of frantic research, as this pathway is activated in many different cancers, including those of the lung (30,31).
CTC clusters or microemboli have been observed rarely in breast, prostate and lung cancers (27,37,49). They were shown to increase metastasis in mice models of breast cancer, and also have prognostic significance in predicting survival (20,27,50). Among the patients analyzed for mRNA expression profiles, the PV and Pe samples were segregated according to presence or absence of CTC clusters. Gene expression analysis revealed higher expression of IL6 (p=0.02) among the clustered CTCs compared to single CTCs. IL6 has been shown to have an activating effect on genes which can promote growth and anti-apoptosis signals (51). CTC clusters have also been previously shown to be negative for apoptosis (34). Our data supports this observation by the high expression of the anti-apoptotic BCL2 gene in the clusters compared to single CTCs. Together, these point to the highly aggressive or tumorigenic potential of CTC clusters (51).
Recent studies in breast cancer have implied that metastasis is related to CTC clusters with epithelial phenotype as evidenced by expression of various keratins (50,52). It has also been demonstrated that the clusters have high expression of adhesion markers, lack of which disrupt clusters and reduce their metastatic ability (27). We too observed a higher, albeit not statistically significant expression of epithelial markers such as EpCAM, EMP2, KRT19, KRT7, KRT8, suggesting a similar role in metastasis. Further studies are needed to understand these phenomena. Furthermore, mRNA expression of the excision repair cross complementation 1 (ERCC1) gene (53) was observed to be higher in cluster samples in contrast to the single CTC samples. This gene is involved in repair of damaged DNA, and its higher expression in lung CTCs has been correlated to worse progression free survival (53). Taken together, RNA expression data from CTC clusters point toward factors that may provide a survival advantage to these clusters, in so far as allowing growth, promoting invasion and metastasis as well as avoiding anoikis in the circulation (34,51).
Gene data analysis of clusters and single CTC samples using a pathway analysis software (IPathwayGuide, AdvaitaBio) showed enrichment of various gene ontology terms involving cell migration, motility and immune regulation. CTC clusters are known to have tight cell junctions regulated by various adhesion complexes. Clusters have also been shown to have a higher metastatic capability as compared to single CTCs (50). Our data additionally indicates that CTC clusters may have higher migratory/motile ability than single CTCs, which might be useful in their metastatic route through the bloodstream. They may also be highly efficient at evading immune related cell death in the circulation, as evidenced by the GO term ‘platelet activation’. Indeed, ‘cloaking’ of CTCs by platelets has been observed and suggested as a mechanism to protect the cells in circulation (54). Enrichment of the IL-17 signaling pathway is also suggestive of the invasiveness of the clusters, as it has been shown that IL-17 encourages metastasis and is associated with poor survival (55,56).
The expression of Ki67 in our sample set provided interesting insights into CTC biology. Patient specimens showed positivity of Ki67 expression while the healthy controls had no detectable levels of the gene. In addition, 8 out of 11 PV samples that were positive for Ki67 had single CTCs. While there have been variable reports of Ki67 in CTCs and CTC clusters (3,57), it has been theorized that CTC clusters are better able to evade cytotoxic/chemotherapeutic drugs due to absence of proliferation as indicated by Ki67 (3,34). This is also corroborated by the higher expression of ERCC1 (treatment resistant marker (58)) in the PV clusters, and further reinforced by the upregulation of ‘EGFR inhibitor resistance’ and ‘HIF-1 signaling’ pathways in the clusters. Hypoxia is theorized to promote epithelial-mesenchymal transition (36), which in turn confers treatment resistance (35). Ki67 positive samples could thus indicate more proliferative tumors and poor prognosis, as is indicated by other studies in breast and prostate cancer that showed poor prognosis for patients with Ki67+ CTCs (14,46). Ki67 thus shows promise as a potential biomarker for investigating CTCs in early lung cancer to predict disease progression.
Lastly, the finding that CTCs isolated from both PV and Pe carried at least one lung tumor specific mutation confirms that, the CTCs found in both sources (PV and Pe) are shed from primary tumor. Furthermore, TP53 mutations were found in 83% of the samples tested whereas KRAS and PIK3CA were mutated in 50% of the samples, validating once again that CTCs are potential surrogates for tissue biopsy.
The finding of clusters of CTCs in the pulmonary and peripheral veins of patients undergoing tumor resections may have clinical significance which impacts long term monitoring. Our study indicates that the PV may harbor CTCs of mixed epithelial and mesenchymal features, and while some of the larger clusters may be filtered by smaller blood vessels, there still may remain a significant number to lead to metastasis and progression. This raises interesting possibilities of addressing tumor resections with therapies to eliminate the PV CTCs as they may manifest in the form of long term recurrence. Put together, the key findings suggest that the PV harbor different populations of CTCs than the peripheral vein, which may have implications in future assessment of resections and therapy.
Supplementary Material
Acknowledgments
The authors are grateful to the clinical specimen coordinators Shari Barnett and Melinda Shearrer, and acknowledge the Lurie Nanofabrication Facility (LNF), Microscopy and Image Analysis Laboratory (MIL), DNA Sequencing Core, and the Takayama lab at the University of Michigan. The authors would like to thank Lisa D’Angelo for the medical illustration. IHC of primary tumors was performed by the Research Histology and Immunoperoxidase Laboratory at the University of Michigan Comprehensive Cancer Center under support of grant P30CA046592.
Funding Sources
This study was funded by the National Institute of Health (NIH) Director’s New Innovator Award (1DP2OD006672–01) to S. Nagrath, SIG-NIH grant (S10OD16187) to M.S. Wicha, and the Rackham International Student Fellowship to V. Murlidhar.
References
- 1.Haber DA, Velculescu VE. Blood-based analyses of cancer: circulating tumor cells and circulating tumor DNA. Cancer discovery. 2014;4:650–61. doi: 10.1158/2159-8290.CD-13-1014. [DOI] [PMC free article] [PubMed] [Google Scholar]
- 2.Wu C, Hao H, Li L, Zhou X, Guo Z, Zhang L, et al. Preliminary investigation of the clinical significance of detecting circulating tumor cells enriched from lung cancer patients. Journal of thoracic oncology : official publication of the International Association for the Study of Lung Cancer. 2009;4:30–6. doi: 10.1097/JTO.0b013e3181914125. [DOI] [PubMed] [Google Scholar]
- 3.Krebs MG, Hou JM, Sloane R, Lancashire L, Priest L, Nonaka D, et al. Analysis of circulating tumor cells in patients with non-small cell lung cancer using epithelial marker-dependent and -independent approaches. Journal of thoracic oncology : official publication of the International Association for the Study of Lung Cancer. 2012;7:306–15. doi: 10.1097/JTO.0b013e31823c5c16. [DOI] [PubMed] [Google Scholar]
- 4.Cristofanilli M, Budd GT, Ellis MJ, Stopeck A, Matera J, Miller MC, et al. Circulating tumor cells, disease progression, and survival in metastatic breast cancer. N Engl J Med. 2004;351:781–91. doi: 10.1056/NEJMoa040766. [DOI] [PubMed] [Google Scholar]
- 5.Aguirre-Ghiso JA, Bragado P, Sosa MS. Metastasis awakening: targeting dormant cancer. Nature medicine. 2013;19:276–7. doi: 10.1038/nm.3120. [DOI] [PMC free article] [PubMed] [Google Scholar]
- 6.Nagrath S, Sequist LV, Maheswaran S, Bell DW, Irimia D, Ulkus L, et al. Isolation of rare circulating tumour cells in cancer patients by microchip technology. Nature. 2007;450:1235–9. doi: 10.1038/nature06385. [DOI] [PMC free article] [PubMed] [Google Scholar]
- 7.Paterlini-Brechot P, Benali NL. Circulating tumor cells (CTC) detection: clinical impact and future directions. Cancer letters. 2007;253:180–204. doi: 10.1016/j.canlet.2006.12.014. [DOI] [PubMed] [Google Scholar]
- 8.Poveda A, Kaye SB, McCormack R, Wang S, Parekh T, Ricci D, et al. Circulating tumor cells predict progression free survival and overall survival in patients with relapsed/recurrent advanced ovarian cancer. Gynecologic oncology. 2011;122:567–72. doi: 10.1016/j.ygyno.2011.05.028. [DOI] [PubMed] [Google Scholar]
- 9.Pantel K, Alix-Panabieres C. Functional Studies on Viable Circulating Tumor Cells. Clinical chemistry. 2015 doi: 10.1373/clinchem.2015.242537. [DOI] [PubMed] [Google Scholar]
- 10.Alix-Panabieres C, Pantel K. Challenges in circulating tumour cell research. Nature reviews Cancer. 2014;14:623–31. doi: 10.1038/nrc3820. [DOI] [PubMed] [Google Scholar]
- 11.Nanguzgambo AB, Razack R, Louw M, Bolliger CT. Immunochemistry and lung cancer: application in diagnosis, prognosis and targeted therapy. Oncology. 2011;80:247–56. doi: 10.1159/000329064. [DOI] [PubMed] [Google Scholar]
- 12.Hirsch FR, Franklin WA, Gazdar AF, Bunn PA., Jr Early detection of lung cancer: clinical perspectives of recent advances in biology and radiology. Clin Cancer Res. 2001;7:5–22. [PubMed] [Google Scholar]
- 13.Wendel M, Bazhenova L, Boshuizen R, Kolatkar A, Honnatti M, Cho EH, et al. Fluid biopsy for circulating tumor cell identification in patients with early-and late-stage non-small cell lung cancer: a glimpse into lung cancer biology. Physical biology. 2012;9:016005. doi: 10.1088/1478-3967/9/1/016005. [DOI] [PMC free article] [PubMed] [Google Scholar]
- 14.Stott SL, Lee RJ, Nagrath S, Yu M, Miyamoto DT, Ulkus L, et al. Isolation and characterization of circulating tumor cells from patients with localized and metastatic prostate cancer. Science translational medicine. 2010;2:25ra3. doi: 10.1126/scitranslmed.3000403. [DOI] [PMC free article] [PubMed] [Google Scholar]
- 15.Marrinucci D, Bethel K, Bruce RH, Curry DN, Hsieh B, Humphrey M, et al. Case study of the morphologic variation of circulating tumor cells. Human pathology. 2007;38:514–9. doi: 10.1016/j.humpath.2006.08.027. [DOI] [PubMed] [Google Scholar]
- 16.Okumura Y, Tanaka F, Yoneda K, Hashimoto M, Takuwa T, Kondo N, et al. Circulating tumor cells in pulmonary venous blood of primary lung cancer patients. The Annals of thoracic surgery. 2009;87:1669–75. doi: 10.1016/j.athoracsur.2009.03.073. [DOI] [PubMed] [Google Scholar]
- 17.Sienel W, Seen-Hibler R, Mutschler W, Pantel K, Passlick B. Tumour cells in the tumour draining vein of patients with non-small cell lung cancer: detection rate and clinical significance. European journal of cardio-thoracic surgery : official journal of the European Association for Cardio-thoracic Surgery. 2003;23:451–6. doi: 10.1016/s1010-7940(02)00865-5. [DOI] [PubMed] [Google Scholar]
- 18.Reddy RM, Murlidhar V, Zhao L, Grabauskiene S, Zhang Z, Ramnath N, et al. Pulmonary venous blood sampling significantly increases the yield of circulating tumor cells in early-stage lung cancer. The Journal of thoracic and cardiovascular surgery. 2015 doi: 10.1016/j.jtcvs.2015.09.126. [DOI] [PubMed] [Google Scholar]
- 19.Hashimoto M, Tanaka F, Yoneda K, Takuwa T, Matsumoto S, Okumura Y, et al. Significant increase in circulating tumour cells in pulmonary venous blood during surgical manipulation in patients with primary lung cancer. Interactive cardiovascular and thoracic surgery. 2014;18:775–83. doi: 10.1093/icvts/ivu048. [DOI] [PubMed] [Google Scholar]
- 20.Funaki S, Sawabata N, Abulaiti A, Nakagiri T, Shintani Y, Inoue M, et al. Significance of tumour vessel invasion in determining the morphology of isolated tumour cells in the pulmonary vein in non-small-cell lung cancer. European journal of cardio-thoracic surgery : official journal of the European Association for Cardio-thoracic Surgery. 2013;43:1126–30. doi: 10.1093/ejcts/ezs553. [DOI] [PubMed] [Google Scholar]
- 21.Pirozzi G, Tirino V, Camerlingo R, La Rocca A, Martucci N, Scognamiglio G, et al. Prognostic value of cancer stem cells, epithelial-mesenchymal transition and circulating tumor cells in lung cancer. Oncology reports. 2013;29:1763–8. doi: 10.3892/or.2013.2294. [DOI] [PubMed] [Google Scholar]
- 22.Funaki S, Sawabata N, Nakagiri T, Shintani Y, Inoue M, Kadota Y, et al. Novel approach for detection of isolated tumor cells in pulmonary vein using negative selection method: morphological classification and clinical implications. European journal of cardio-thoracic surgery : official journal of the European Association for Cardio-thoracic Surgery. 2011;40:322–7. doi: 10.1016/j.ejcts.2010.11.029. [DOI] [PubMed] [Google Scholar]
- 23.Murlidhar V, Zeinali M, Grabauskiene S, Ghannad-Rezaie M, Wicha MS, Simeone DM, et al. A radial flow microfluidic device for ultra-high-throughput affinity-based isolation of circulating tumor cells. Small. 2014;10:4895–904. doi: 10.1002/smll.201400719. [DOI] [PMC free article] [PubMed] [Google Scholar]
- 24.R Development Core Team. A language and environment for statistical computing. Vienna, Austria: R Foundation for Statistical Computing; 2010. [Google Scholar]
- 25.Schmittgen TD, Livak KJ. Analyzing real-time PCR data by the comparative C(T) method. Nature protocols. 2008;3:1101–8. doi: 10.1038/nprot.2008.73. [DOI] [PubMed] [Google Scholar]
- 26.Livak KJ, Schmittgen TD. Analysis of relative gene expression data using real-time quantitative PCR and the 2(-Delta Delta C(T)) Method. Methods. 2001;25:402–8. doi: 10.1006/meth.2001.1262. [DOI] [PubMed] [Google Scholar]
- 27.Aceto N, Bardia A, Miyamoto DT, Donaldson MC, Wittner BS, Spencer JA, et al. Circulating tumor cell clusters are oligoclonal precursors of breast cancer metastasis. Cell. 2014;158:1110–22. doi: 10.1016/j.cell.2014.07.013. [DOI] [PMC free article] [PubMed] [Google Scholar]
- 28.Sun YF, Yang XR, Zhou J, Qiu SJ, Fan J, Xu Y. Circulating tumor cells: advances in detection methods, biological issues, and clinical relevance. Journal of cancer research and clinical oncology. 2011;137:1151–73. doi: 10.1007/s00432-011-0988-y. [DOI] [PubMed] [Google Scholar]
- 29.Ting DT, Wittner BS, Ligorio M, Vincent Jordan N, Shah AM, Miyamoto DT, et al. Single-cell RNA sequencing identifies extracellular matrix gene expression by pancreatic circulating tumor cells. Cell reports. 2014;8:1905–18. doi: 10.1016/j.celrep.2014.08.029. [DOI] [PMC free article] [PubMed] [Google Scholar]
- 30.Rajalingam K, Schreck R, Rapp UR, Albert S. Ras oncogenes and their downstream targets. Biochim Biophys Acta. 2007;1773:1177–95. doi: 10.1016/j.bbamcr.2007.01.012. [DOI] [PubMed] [Google Scholar]
- 31.Keeton AB, Salter EA, Piazza GA. The RAS-Effector Interaction as a Drug Target. Cancer Res. 2017;77:221–6. doi: 10.1158/0008-5472.CAN-16-0938. [DOI] [PMC free article] [PubMed] [Google Scholar]
- 32.Luo M, Brooks M, Wicha MS. Epithelial-mesenchymal plasticity of breast cancer stem cells: implications for metastasis and therapeutic resistance. Current pharmaceutical design. 2015;21:1301–10. doi: 10.2174/1381612821666141211120604. [DOI] [PMC free article] [PubMed] [Google Scholar]
- 33.Pantel K, Speicher MR. The biology of circulating tumor cells. Oncogene. 2015 doi: 10.1038/onc.2015.192. [DOI] [PubMed] [Google Scholar]
- 34.Hou JM, Krebs MG, Lancashire L, Sloane R, Backen A, Swain RK, et al. Clinical significance and molecular characteristics of circulating tumor cells and circulating tumor microemboli in patients with small-cell lung cancer. Journal of clinical oncology : official journal of the American Society of Clinical Oncology. 2012;30:525–32. doi: 10.1200/JCO.2010.33.3716. [DOI] [PubMed] [Google Scholar]
- 35.Shibue T, Weinberg RA. EMT, CSCs, and drug resistance: the mechanistic link and clinical implications. Nat Rev Clin Oncol. 2017 doi: 10.1038/nrclinonc.2017.44. [DOI] [PMC free article] [PubMed] [Google Scholar]
- 36.Wu G, Wilson G, George J, Liddle C, Hebbard L, Qiao L. Overcoming treatment resistance in cancer: Current understanding and tactics. Cancer letters. 2017;387:69–76. doi: 10.1016/j.canlet.2016.04.018. [DOI] [PubMed] [Google Scholar]
- 37.Carlsson A, Nair VS, Luttgen MS, Keu KV, Horng G, Vasanawala M, et al. Circulating tumor microemboli diagnostics for patients with non-small-cell lung cancer. Journal of thoracic oncology : official publication of the International Association for the Study of Lung Cancer. 2014;9:1111–9. doi: 10.1097/JTO.0000000000000235. [DOI] [PMC free article] [PubMed] [Google Scholar]
- 38.Baccelli I, Schneeweiss A, Riethdorf S, Stenzinger A, Schillert A, Vogel V, et al. Identification of a population of blood circulating tumor cells from breast cancer patients that initiates metastasis in a xenograft assay. Nature biotechnology. 2013;31:539–44. doi: 10.1038/nbt.2576. [DOI] [PubMed] [Google Scholar]
- 39.Peeters DJ, Brouwer A, Van den Eynden GG, Rutten A, Onstenk W, Sieuwerts AM, et al. Circulating tumour cells and lung microvascular tumour cell retention in patients with metastatic breast and cervical cancer. Cancer letters. 2015;356:872–9. doi: 10.1016/j.canlet.2014.10.039. [DOI] [PubMed] [Google Scholar]
- 40.Bissolati M, Sandri MT, Burtulo G, Zorzino L, Balzano G, Braga M. Portal vein-circulating tumor cells predict liver metastases in patients with resectable pancreatic cancer. Tumour biology : the journal of the International Society for Oncodevelopmental Biology and Medicine. 2014 doi: 10.1007/s13277-014-2716-0. [DOI] [PubMed] [Google Scholar]
- 41.Rahbari NN, Bork U, Kircher A, Nimitz T, Scholch S, Kahlert C, et al. Compartmental differences of circulating tumor cells in colorectal cancer. Annals of surgical oncology. 2012;19:2195–202. doi: 10.1245/s10434-011-2178-1. [DOI] [PubMed] [Google Scholar]
- 42.Liotta LA, Saidel MG, Kleinerman J. The significance of hematogenous tumor cell clumps in the metastatic process. Cancer Res. 1976;36:889–94. [PubMed] [Google Scholar]
- 43.Yu M, Ting DT, Stott SL, Wittner BS, Ozsolak F, Paul S, et al. RNA sequencing of pancreatic circulating tumour cells implicates WNT signalling in metastasis. Nature. 2012;487:510–3. doi: 10.1038/nature11217. [DOI] [PMC free article] [PubMed] [Google Scholar]
- 44.Aceto N, Toner M, Maheswaran S, Haber DA. En Route to Metastasis: Circulating Tumor Cell Clusters and Epithelial-to-Mesenchymal Transition. Trends in Cancer. 2015;1:44–52. doi: 10.1016/j.trecan.2015.07.006. [DOI] [PubMed] [Google Scholar]
- 45.Armstrong AJ, Marengo MS, Oltean S, Kemeny G, Bitting RL, Turnbull JD, et al. Circulating tumor cells from patients with advanced prostate and breast cancer display both epithelial and mesenchymal markers. Molecular cancer research : MCR. 2011;9:997–1007. doi: 10.1158/1541-7786.MCR-10-0490. [DOI] [PMC free article] [PubMed] [Google Scholar]
- 46.Raimondi C, Gradilone A, Naso G, Vincenzi B, Petracca A, Nicolazzo C, et al. Epithelial-mesenchymal transition and stemness features in circulating tumor cells from breast cancer patients. Breast Cancer Res Treat. 2011;130:449–55. doi: 10.1007/s10549-011-1373-x. [DOI] [PubMed] [Google Scholar]
- 47.Yu M, Bardia A, Wittner BS, Stott SL, Smas ME, Ting DT, et al. Circulating breast tumor cells exhibit dynamic changes in epithelial and mesenchymal composition. Science. 2013;339:580–4. doi: 10.1126/science.1228522. [DOI] [PMC free article] [PubMed] [Google Scholar]
- 48.Levine AJ. p53, the cellular gatekeeper for growth and division. Cell. 1997;88:323–31. doi: 10.1016/s0092-8674(00)81871-1. [DOI] [PubMed] [Google Scholar]
- 49.Stott SL, Hsu CH, Tsukrov DI, Yu M, Miyamoto DT, Waltman BA, et al. Isolation of circulating tumor cells using a microvortex-generating herringbone-chip. Proceedings of the National Academy of Sciences of the United States of America. 2010;107:18392–7. doi: 10.1073/pnas.1012539107. [DOI] [PMC free article] [PubMed] [Google Scholar]
- 50.Cheung KJ, Padmanaban V, Silvestri V, Schipper K, Cohen JD, Fairchild AN, et al. Polyclonal breast cancer metastases arise from collective dissemination of keratin 14-expressing tumor cell clusters. Proceedings of the National Academy of Sciences of the United States of America. 2016 doi: 10.1073/pnas.1508541113. [DOI] [PMC free article] [PubMed] [Google Scholar]
- 51.Guo Y, Xu F, Lu T, Duan Z, Zhang Z. Interleukin-6 signaling pathway in targeted therapy for cancer. Cancer treatment reviews. 2012;38:904–10. doi: 10.1016/j.ctrv.2012.04.007. [DOI] [PubMed] [Google Scholar]
- 52.Cheung KJ, Ewald AJ. A collective route to metastasis: Seeding by tumor cell clusters. Science. 2016;352:167–9. doi: 10.1126/science.aaf6546. [DOI] [PMC free article] [PubMed] [Google Scholar]
- 53.Das M, Riess JW, Frankel P, Schwartz E, Bennis R, Hsieh HB, et al. ERCC1 expression in circulating tumor cells (CTCs) using a novel detection platform correlates with progression-free survival (PFS) in patients with metastatic non-small-cell lung cancer (NSCLC) receiving platinum chemotherapy. Lung cancer. 2012;77:421–6. doi: 10.1016/j.lungcan.2012.04.005. [DOI] [PubMed] [Google Scholar]
- 54.Hu Q, Bomba HN, Gu Z. Engineering platelet-mimicking drug delivery vehicles. Frontiers of Chemical Science and Engineering. 2017:1–9. [Google Scholar]
- 55.Li Q, Han Y, Fei G, Guo Z, Ren T, Liu Z. IL-17 promoted metastasis of non-small-cell lung cancer cells. Immunol Lett. 2012;148:144–50. doi: 10.1016/j.imlet.2012.10.011. [DOI] [PubMed] [Google Scholar]
- 56.Wang L, Yi T, Kortylewski M, Pardoll DM, Zeng D, Yu H. IL-17 can promote tumor growth through an IL-6-Stat3 signaling pathway. J Exp Med. 2009;206:1457–64. doi: 10.1084/jem.20090207. [DOI] [PMC free article] [PubMed] [Google Scholar]
- 57.Sarioglu AF, Aceto N, Kojic N, Donaldson MC, Zeinali M, Hamza B, et al. A microfluidic device for label-free, physical capture of circulating tumor cell clusters. Nat Methods. 2015;12:685–91. doi: 10.1038/nmeth.3404. [DOI] [PMC free article] [PubMed] [Google Scholar]
- 58.Kasimir-Bauer S, Bittner AK, Konig L, Reiter K, Keller T, Kimmig R, et al. Does primary neoadjuvant systemic therapy eradicate minimal residual disease? Analysis of disseminated and circulating tumor cells before and after therapy. Breast cancer research : BCR. 2016;18:20. doi: 10.1186/s13058-016-0679-3. [DOI] [PMC free article] [PubMed] [Google Scholar]
Associated Data
This section collects any data citations, data availability statements, or supplementary materials included in this article.