

Abstract
Cells lacking the tumor suppressor gene LKB1/STK11 alter their metabolism to match the demands of accelerated growth, leaving them highly vulnerable to stress. However, targeted therapy for LKB1-deficient cancers has yet to be reported. In both Kras/p53/Lkb1 cell lines and a genetically engineered mouse model (GEMM) of Kras/p53/Lkb1-induced lung cancer, much higher rates of DNA damage occur resulting in increased dependence on Chk1 checkpoint function. Here we demonstrate that short-term treatment with the Chk1 inhibitor AZD7762 reduces metabolism in pembrolizumab tumors, synergizing with the DNA damaging drug gemcitabine to reduce tumor size in these models. Our results offer preclinical proof of concept for use of a Chk1 inhibitor to safely enhance the efficacy of gemcitabine, particularly in aggressive KRAS-driven LKB1-deficient lung adenocarcinomas.
Keywords: Lkb1, Chk1, DNA damage, apoptosis
Introduction
The LKB1/STK11 tumor suppressor gene is the third most commonly mutated gene in lung adenocarcinoma, following TP53 and KRAS, and accounts for approximately 30% of non-small cell lung cancers (NSCLC) (1-6). LKB1/STK11 encodes a serine/threonine protein kinase that phosphorylates AMPK in low ATP conditions to restore energy homeostasis by regulating nutrient uptake and metabolism (7-12). Inactivation of LKB1 not only alters cellular metabolic processes (1,13-15), but also induces a more aggressive tumor phenotype (16-19). Unlike targeted therapies for oncogene-driven lung adenocarcinomas – such as the third-generation tyrosine kinase inhibitor AZD9291 effective for the EGFR T790M mutation or the first-generation ALK inhibitor crizotinib effective for the EML4-ALK fusion variants (20-23) – specific targeted therapies for LKB1-deficient NSCLC are not yet available.
Gemcitabine, a deoxycytidine analog, has been used in chemotherapy to treat various solid tumors (24,25). Gemcitabine is a pro-drug and is metabolized inside cells into the active di-/tri-phosphate gemcitabine, resulting in decreasing dNTP pool and terminating DNA synthesis (24,26). Chk1, a critical cell cycle checkpoint kinase, can halt the cell cycle in response to DNA damage to provide time for DNA repair; alternatively, cells begin apoptosis if DNA damage is unrepairable (27,28). Based on this knowledge, both preclinical data and mechanistic studies advocate the use of Chk1 inhibitors in combination with induction of DNA damage (by irradiation or antimetabolites) as a potential anticancer therapy (29). Consistent with this theory, we previously reported that Kras/p53/Lkb1 lung tumors have a much higher DNA damage rate when compared to Kras/p53 lung tumors, leading to an increased dependence on Chk1 function (14). In the current study, with an ultimate goal of treating Lkb1-deficient lung cancer in preclinical models, we demonstrate in vitro that down-regulation of Chk1 preferentially kills Kras/p53/Lkb1 cell lines, and that gemcitabine significantly increases the antitumor effects of this Chk1 inhibitor. Further, in vivo, we show that gemcitabine at low dose strengthens the effect of Chk1 inhibitor AZD7762 as measured by the reduction in size of Kras/p53/Lkb1 lung cancers.
Materials and Methods
Cells lines and screens
Murine Kras/p53 (634, 855, and 857) and Kras/p53/Lkb1 (t2, t4, and t5) lung cancer cell lines were derived from tumor nodules of the genetically engineered Kras/p53 and Kras/p53/Lkb1 mice in Dr. Wong's laboratory in 2013 (14). Human NSCLC cell lines A549 and H2122 were obtained from American Type Culture Collection in 2009. All cell lines were authenticated by DNA fingerprinting and verified as mycoplasma-free using Universal Mycoplasma Detection Kit (ATCC). The genome-wide pooled shRNA library screen that identified synthetic lethal hits in combination with Lkb1 loss was previously described (14).
For the array-based high-throughput kinase inhibitor screen, 375 cells in 50 μL of media were plated into individual wells of 384-well plates. Next, 33 nL of 1 mM library compound covering 998 previously reported clinical and preclinical kinase inhibitors were pin-transferred into each well, resulting in a final concentration of 660 nM in 0.066% DMSO. Cells were cultured for two days and viable cells were then measured using CellTiter-Glo luminescent cell viability assays (Promega), according to the manufacturer's instructions. All reactions were performed in duplicate plates.
Cell proliferation assay
Cells were plated into 96-well plates at 2,000 cells per well in 200 μL of media containing 3 μg/mL puromycin to select for shRNA lentiviral-transduced cells. Viable cells were measured daily using CellTiter-Glo luminescent cell viability assay (Promega), according to the manufacturer's instructions. All reactions were performed in triplicate.
RT-qPCR
Total RNA from cultured cells was extracted using Trizol (Invitrogen). To generate cDNA, 1 μg total RNA was reverse transcribed using the ImProm-II RT system (Promega) according to the manufacturer's instructions. Real-time quantitative PCR (RT-qPCR) was performed in a final volume of 20 μL containing 10 μL of 2× SYBR Green PCR master mix (Applied Biosystems), 1 μL of 10 μM forward primer, 1 μL of 10 μM reverse primer, and cDNA corresponding to 45 ng RNA using StepOnePlus Real-Time PCR System (Applied Biosystems) according to the manufacturer's protocol. All reactions were performed in triplicate. qPCR primers were designed using Primer3 software (http://bioinfo.ut.ee/primer3/): Chek1, (forward) 5′-CTGGGATTTGGTGCAAACTT-3′, and (reverse) 5′-GCCCGCTTCATGTCTACAAT-3′; mouse actin, (forward) 5′-CTAAGGCCAACCGTGAAAAG-3′, and (reverse) 5′-GACCAGAGGCATACAGGGAC-3′. All qPCR reactions were performed in triplicate.
Plasmid constructs and mutagenesis
For pTetOn-shRNA, Chek1 shRNA (shChek1-4) was subcloned into the Tet-pLKO-puro lenti vector (Addgene) to generate pTetOn-shChek1-4 plasmid, which was confirmed by sequencing. For resistant cDNA, wild type cDNA encoding murine Chek1 (BC100386) was purchased from Thermo Scientific. The shChek1-4 resistant cDNA of Chek1 (Chek1R) was made by mutagenesis PCR and then subcloned into the BamH I and Not I sites of pCDH-CMV-MCS-EF1-puro (pCDH) vector (System Biosciences) to generate pCDH-Chek1R. A silent mutation of Chek1 against shChek1-4 was introduced using a targeted primer pair: (forward) 5′-CAGTGGAAAAAAAGCTGCATGA ATCAGGTT-3′, and (reverse) 5′-ATGCAGCTTTTTTTCCACTGATAGCCCAAC-3′. All mutagenized plasmids were confirmed by sequencing.
Immunostainings and antibodies
For Western blot analyses, cells were lysed in 1× LDS Sample Buffer (Invitrogen) containing a protease and phosphatase inhibitor cocktail (Thermo). Proteins were resolved by SDS-PAGE and analyzed by immunoblotting with the indicated antibodies. Proteins were visualized with horseradish peroxidase-conjugated secondary antibodies (Amersham Biosciences) and an enhanced chemiluminescent substrate kit (Thermo). For immunohistochemistry (IHC), lungs were perfused with 10% formalin overnight and then stored in 70% ethanol. Lungs were embedded in paraffin, sectioned at 5 μm, and stained for cleaved caspase-3 by the Department of Pathology in Brigham and Women's Hospital.
Anti-Chk1 antibody was obtained from Cell Signaling, anti-β-actin antibody from Sigma, and Anti-cleaved caspase-3 antibody from Abcam.
In vitro drug combination studies
For in vitro drug combination studies, 1,000 cells in 200 μL of media were plated into individual wells of 96-well plates. AZD7762 was serially diluted in a 4-fold decay gradient in the ‘A’ to ‘H’ direction of 96-well plates, starting with a maximum concentration of 0.5 μM. Other drugs were serially diluted in a 4-fold decay gradient in the ‘1’ to ‘12’ direction of 96-well plates, starting with a maximum concentration of 10 μM. After three days of incubation, viable cells were measured using CellTiter-Glo luminescent cell viability assays (Promega) according to manufacturer's instructions. All reactions were performed in duplicate plates.
Data were first normalized against vehicle-treated control cells (defined as 100% growth) and then analyzed with Calcusyn software (http://www.biosoft.com/w/calcusyn.htm) using the Chou-Talalay method (30). The combination index = [D]1 [Dx]1+ [D]2/[Dx]2, where [D]1 and [D]2 were the concentrations required by each drug in combination to achieve the same effect as concentrations [Dx]1 and [Dx]2 of each drug alone. Values <1 indicate synergy, whereas values >1 indicate antagonism. The Calcusyn combination index (CI) can be interpreted as follows: values <0.1 indicate very strong synergism; values of 0.1–0.3 indicate strong synergism; and values of 0.3–0.7 indicate synergism.
In vivo studies
All mouse studies were conducted through Institutional Animal Care and Use Committee (IACUC) approved animal protocols.
For treatment studies in Kras+/G12D Trp53L/L Lkb1L/L (Kras/p53/Lkb1) mice (14), AZD7762 was dosed intraperitoneally at 25 mg/kg daily and gemcitabine was dosed intraperitoneally at 20 mg/kg twice a week. Tumor development was monitored by MRI and tumor volume was calculated using 3D Slicer software (https://www.slicer.org). All treatments were initiated when tumor volumes reached 150-200 mm3.
For tumor xenograft studies, 1 × 10⁶ Kras/p53/Lkb1 (t2, t4, and t5) cells or 5 × 10⁶ NSCLC (A549 and H2122) cells in 200 μL of PBS with 50% Matrigel (Corning) were subcutaneously implanted into the dorsal flank region of 7-week-old female athymic nude mice (Charles River). After tumor xenografts reached 5 mm in diameter, mice were treated with the indicated drugs for 3 weeks. Tumor dimensions were assessed using electronic digital calipers.
For 18F-FDG-PET/CT imaging (31), before and after two treatments with AZD7762, mice were fasted for 12 h and then injected with 18F-2-fluoro-deoxy-D-glucose (FDG) via tail vein for 1 h. Mice were then imaged using a Siemens Inveon PET/CT scanner. For each tumor, hypermetabolic activity was quantified using the maximum standard uptake value (SUVmax) obtained from FDG-PET imaging. Changes in hypermetabolic activity after treatment were normalized by related baseline values and then compared by tumor genotype.
Statistical Analysis
Statistical analyses were carried out using GraphPad Prism (GraphPad Software). All numerical data are presented as mean ± SEM. Grouped analysis was performed using two-way ANOVA. Column analysis was performed using one-way ANOVA or Student's t test. A p value < 0.05 was considered statistically significant.
Results
Chek1 is a synthetic lethal gene selectively required for Lkb1-deficient cell proliferation
With the goal of elucidating a treatment for LKB1-deficient lung cancer, previously we performed a genome wide shRNA library screen using Lkb1-deficient cell lines derived from genetically engineered Lkb1-deficient mice, and Chek1 was one of the top hits (Supplementary Fig. S1A) (14). In the current study, we performed a small molecule kinase inhibitor screen using the same set of Lkb1-deficent cell lines and Chk1 (target of Kin177) again appeared in the top hits list (Fig. 1). To determine whether Chk1 was a specific hit, we performed in vitro proliferation assays using Lkb1-wt (634, 855, and 857) and Lkb1-null (t2, t4, and t5) cell lines transduced with the indicated shChek1s. Successful knockdown of Chek1 in Lkb1-wt 634 cells was confirmed by RT-qPCR and Western blotting (Fig. 2A and Supplementary Fig. S1B). In two independent assays, both shChek1-1 and shChek1-4 preferentially slowed Lkb1-null cell growth (Fig. 2B).
Figure 1. Array-based high-throughput kinase inhibitor screen.
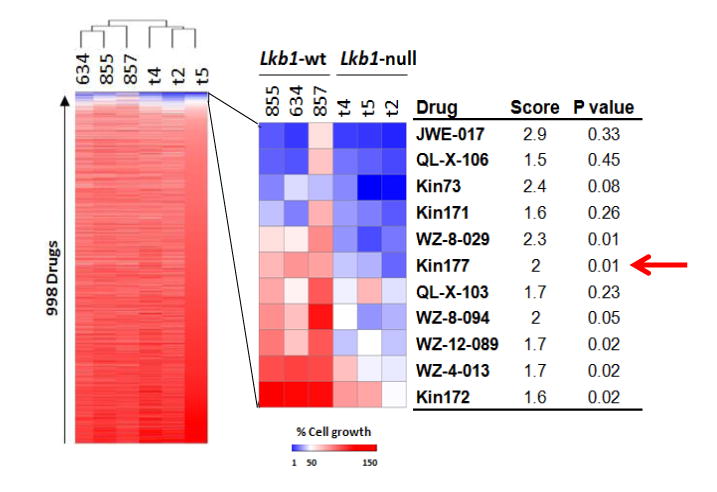
Lkb1-wt and Lkb1-null cells were treated with a collection of 998 kinase inhibitors for 2 days, and live cells were then monitored with luminescent cell viability assays. The heatmap on the left represents the results of unsupervised cluster analysis of cell growth relative to DMSO-treated cells. The heatmap on the right provides an expanded view of compounds with the greatest activity in this assay, compound names, scores (ratio of growth of Lkb1-wt to Lkb1-null), and p-values for differences between Lkb1-wt and Lkb1-null cell lines (Student's t-test).
Figure 2. Dtymk is the synthetic lethal target of Lkb1 loss.
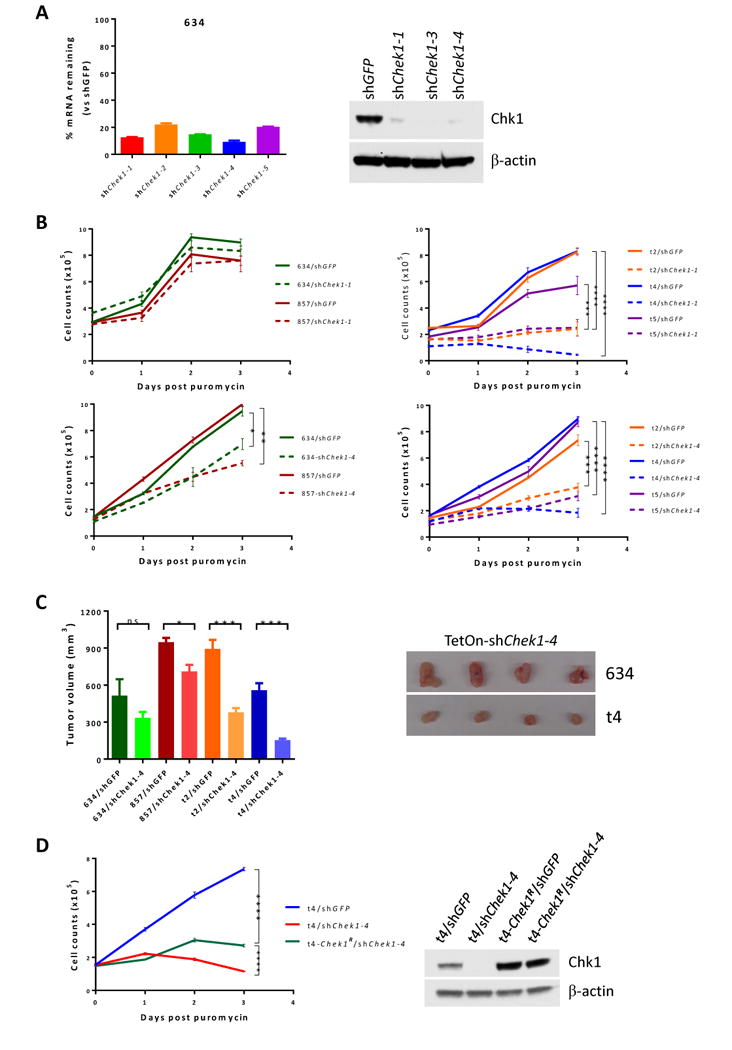
A, qPCR and Western blot analysis of Chek1/Chk1 expression in Lkb1-wt 634 cells upon knockdown of Chek1 with the indicated shRNAs.
B, proliferation assays. Lkb1-wt (634 and 857) (two left panels) and Lkb1-null (t2, t4, and t5) (two right panels) cell lines were transduced with shGFP and shChek1-1 (two upper panels) or shChek1-4 (two lower panels) for 2 days and then plated into 96-well plates at 2000 cells/well in 200 μl medium containing 3 μg/ml puromycin. Viable cells were measured daily with CellTiter-Glo Assays. *, **, ***, ****, p values ≤ 0.05, 0.01, 0.001, and 0.0001, respectively. Data represent mean ± SD for 3 replicates.
C, athymic nude mice were subcutaneously implanted with 1×10⁶ Lkb1-wt (634 and 857) or Lkb1-null (t2 and t4) cells transduced with shChek1-4 and treated with JQ1 for 3 weeks. Tumors were then measured and tumor volume (mm3) was calculated as (length × width2)/2. Data represent mean ± SD for 4 mice. Lkb1-wt 634/shChek1 and Lkb1-null t4/shChek1 tumor xenografts are shown.
D, Lkb1-null t4 cells were transduced with a pCDH-Chek1R vector co-expressing GFP. t4-Chek1R cells were then sorted by FACS for GFP. The t4-Chek1R cells were further transduced with shGFP or shChek1-4, and then plated into 96-well plates for proliferation assays as in (B). Chk1 protein levels in the indicated cells were confirmed by Western blot.
To investigate whether knockdown of Chek1 reduced tumor growth in vivo, Lkb1-wt (634 and 857) and Lkb1-null (t4 and t5) cell lines transduced with pTetOn-shGFP or pTetOn-shChek1-4 were subcutaneously implanted into athymic nude mice. Consistent with in vitro proliferation analyses, Lkb1-null/shChek1-4 tumors grew significantly slower than Lkb1-wt/shChek1-4 tumors (Fig. 2C).
To determine whether overexpression of Chek1R, a shChek1-4 resistant cDNA allele of Chek1, could rescue the Chek1 knockdown phenotype, t4 Lkb1-null cells were first transduced with pCDH-Chek1R co-expressing GFP and Chek1R. The resulting t4-Chek1R cells were sorted by FACS and then transduced again with shChek1-4 or shGFP. Proliferation assays showed that growth of t4-Chek1R cells upon shChek1-4 transduction was significantly restored as compared to t4/shChek1-4 cells (Fig. 2D), but did not reach the level of t4/shGFP positive control cells (Fig. 2D). Further FACS analysis of the t4-Chek1R cells used in the rescue assays revealed that only 55% were GFP (and thus Chek1R)-positive (Supplementary Fig. S2), providing one explanation for the significant, although incomplete, rescue. Depletion of endogenous Chk1 and overexpression of exogenous resistant Chk1R in the rescue assay were confirmed by Western blotting (Fig. 2D). Collectively, these data confirm that Chek1 is a selective synthetic lethal gene in Lkb1-null cells.
Kras/p53/Lkb1 tumors are sensitive to Chk1 inhibitor AZD7762
We showed in our previous study that Chk1 inhibitors AZD7762 and CHIR124 preferentially inhibit growth of Lkb1-deficient murine and human NSCLC cell lines in vitro (14). In the current study, we chose AZD7762, a Chk1 inhibitor being used in clinical trials (32,33), to determine its effectiveness on Lkb1-deficient lung tumors in vivo. We first examined a short-term treatment response using 18F-FDG-PET/CT (34,35). Six mice (3 Kras/p53 and 3 Kras/p53/Lkb1) with lung cancer were imaged before treatment, and imaging showed at least one hypermetabolic tumor nodule per mouse (Fig. 3A, arrowheads). After receiving two doses of AZD7622, mice were imaged again, revealing notable, genotype-specific differences in 18F-FDG uptake in tumors. Specifically, two doses of AZD7622 treatment effectively reduced 18F-FDG uptake in Kras/p53/Lkb1 tumors while no response was observed in Kras/p53 tumors (Fig. 3A and 3B). Thus, only triple-mutant tumors showed an overall decrease in hypermetabolic activity upon treatment. These results are consistent with our in vitro data that cell lines derived from Kras/p53/Lkb1 tumors are more responsive to AZD7622 treatment than Kras/p53 cell lines.
Figure 3. Lkb1-null tumors are sensitive to AZD7762.
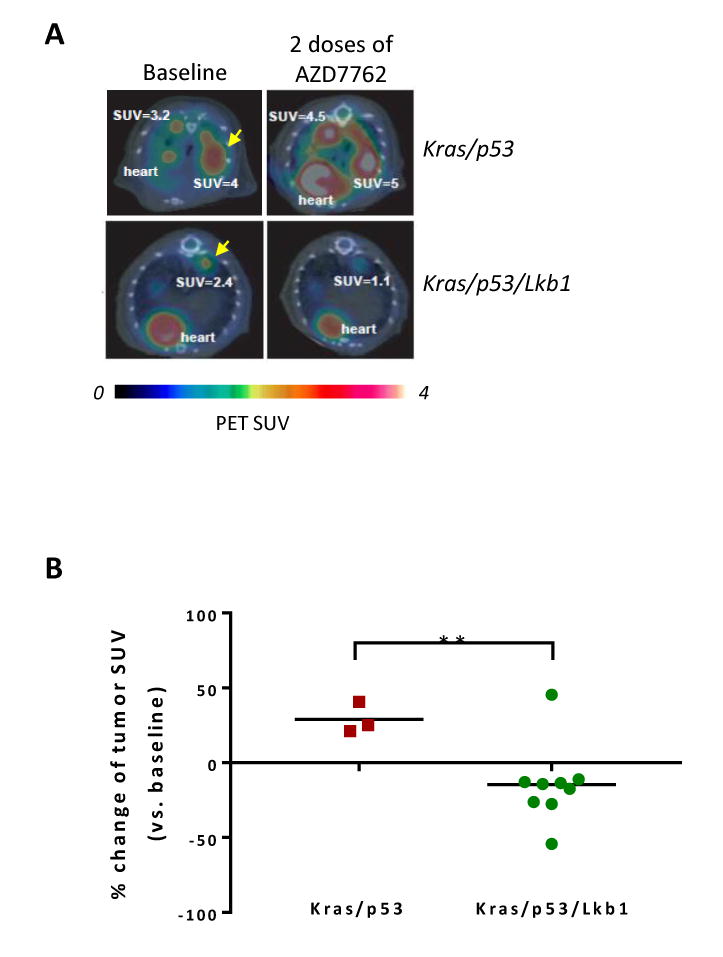
A, representative 18F-FDG PET/CT images of mice from 2 different genotypes at baseline (left) and two days after initiation of treatment with AZD7762 (right). Images shown are trans-axial slices containing FDG-avid tumors, with CT (gray scale) providing anatomic references and PET (pseudo-color scale) showing location and intensity of high tumor glucose utilization at SUVmax (e.g., SUV=3.2, etc.).
B, percent change of 18F-FDG PET signal intensity (SUVmax) in Kras/p53 and Kras/p53/Lkb1 mutant tumors after two treatments with AZD7762. **, p value ≤ 0.01.
Gemcitabine synergizes Chk1 inhibitor AZD7762 in Lkb1-null cell lines
Our results suggest that Lkb1-null cell lines and tumors are sensitive to Chk1 inhibitor AZD7762 in vitro (14) ) and in vivo (Fig. 3). However, MRI analysis of Kras/p53/Lkb1 tumors from mice treated with AZD7762 for 1-2 weeks did not reveal tumor size reductions (Supplementary Fig. S3). Longer treatment of mice carrying triple-mutant tumors with AZD7762 was not feasible because most triple-mutant mice died approximately two weeks after starting treatment. We therefore investigated the effects of combining AZD7762 with several other drugs that target specific signaling pathways in cancer therapy, including AZD6244 (MEK inhibitor), BEZ235 (PI3K/mTOR/ATM/ATR inhibitor), WYN125132 (mTOR inhibitor), Taxotere (mitotic inhibitor), and gemcitabine (DNA synthesis inhibitor) (Supplementary Fig. S4A, S4B, and S4C). Among the five drugs tested, only gemcitabine co-treatment with AZD7762 significantly reduced the IC50 of AZD7762 (Fig. 4A and B). In addition, the combination index (CI) value of 0.1-0.3 further indicated a strong synergistic effect when treatments combined AZD7762 and gemcitabine (Fig. 4C) (36).
Figure 4. Synergistic toxic effect of AZD7762 and gemcitabine on Lkb1-null cells.

Lkb1-null t2, t4, and t5 cells were treated with AZD7762 (0-500 nM) alone or in combination with gemcitabine at the indicated concentration for 4 days and then cell viability was determined using CellTiter-Glo Assays.
A, plot of relative cell viability (%) versus AZD7762 at gradient constant and gemcitabine (Gemc) at constant concentration. Significance of AZD7762 alone versus combined AZD7762 and gemcitabine was calculated by two-way ANOVA. ****, p value ≤ 0.0001.
B, bar graph showing IC50 of AZD7762 alone or in combination with gemcitabine (Gemc) on Lkb1-null cell lines as calculated by GraphPad.
C, CI values calculated using CalcuSyn software. A CI of 0.1-0.3 indicates a strong synergy effect, and a CI of 0.3-0.7 indicates a synergy effect.
AZD7762 and gemcitabine co-treatment reduces tumor size
To determine the combination effect of AZD7762 and gemcitabine in vivo, mice carrying xenograft tumors of murine Lkb1-null t2, t4, and t5, as well as human LKB1-deficient NSCLC A549 and H2122 were treated with AZD7762 at 25 mg/kg daily and/or gemcitabine at 20 mg/kg twice a week for two weeks. As expected, treatment with either drug alone moderately affected tumor growth as compared to vehicle control, whereas combination treatment much more effectively reduced tumor volume (Fig. 5A).
Figure 5. In vivo treatment studies.
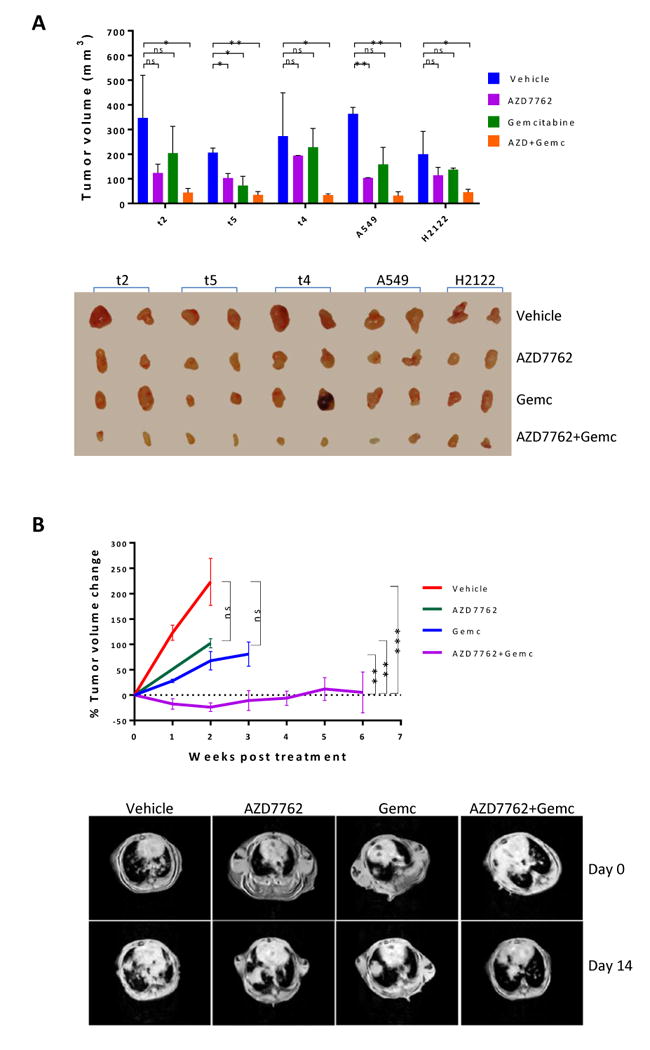
A, one million Lkb1-null (t2, t4, and t5) or LKB1-deficient NSCLC A549 and H2122 cells were implanted subcutaneously into athymic nude mice. When tumor xenografts grew to 3 mm in diameter, the mice were treated with AZD7762 and/or gemcitabine for 2-weeks. Tumor volume (mm3) was calculated as (length × width2)/2. Data represent mean ± SD for 2 mice. Lkb1-null (t2, t4, and t5) and NSCLC A549 and H2122 tumor xenografts are shown.
B, Kras/p53/Lkb1 mice with tumor burdens of approximately 200-400 mm3 were treated with the indicated drugs and tumor volume was monitored by MRI. Data points represent percent change in tumor volume (relative to the start of drug treatment) for all available data at the indicated time point. Representative MRI images from Kras/p53/Lkb1 mice treated with the indicated drugs are shown.
Next, genetically engineered Kras/p53/Lkb1 mice carrying lung tumors were treated with AZD7762 and/or gemcitabine under the same dosing regimen. Consistently, single drug treatment with AZD7762 or gemcitabine moderately reduced tumor sizes, whereas the combination treatment with AZD7762 and gemcitabine not only significantly reduced tumor sizes, but also greatly prolonged lifespans as compared to mice treated with vehicle control or AZD7762 alone (Fig. 5B).
To confirm that the combination therapy increased apoptosis, Kras/p53/Lkb1 lung tumors treated with AZD7762 and/or gemcitabine for 10 days were immunostained for cleaved caspase-3. As expected, AZD7762 monotherapy did not alter and gemcitabine monotherapy moderately increased the numbers of cleaved caspase 3-positive cells. AZD7762 plus gemcitabine combination therapy, however, significantly increased the numbers of cleaved caspase 3-positive cells as compared to vehicle control (Fig. 6A and B), confirming induction of apoptosis.
Figure 6. IHC staining of cleaved caspase-3.
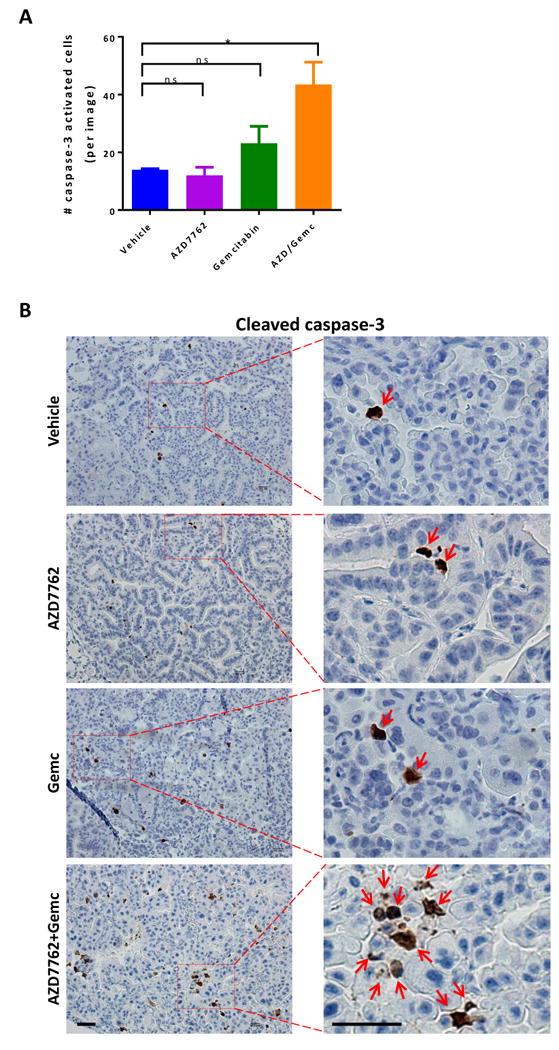
A, tumor-bearing Kras/p53/Lkb1 mice were treated with AZD7762 and/or gemcitabine for 10 days and then sacrificed for IHC staining of cleaved caspase-3 on FFPE slides. Each treatment group contains 5 mice and 10-20 images were taken per mouse lung. The column represents the mean number of cleaved caspase-3 positive cells in each treatment group. Data represent the mean ± SD for 5 replicates.
B, representative IHC images of cleaved caspase-3 in lung tumor nodules of Kras/p53/Lkb1 mice treated with the indicated drugs. Red arrowheads indicate positive signals. Scale bar, 500 μm.
Discussion
Multiple distinct strategies for targeting LKB1-loss lung cancer have shown some efficacy in preclinical models. For example, Kim et al. reported that targeting Na+/K+-ATPase with cardiac glycosides is synthetic lethal with LKB1 loss in a xenograft model of lung cancer (37); Inge et al. reported that Kras/Lkb1-deficient transgenic mice are sensitive to 2-deoxy-D-glucose because of aggravated endoplasmic reticulum stress (38); and Svensson et al. reported inhibition of de novo fatty acid synthesis with ND-646 impedes tumor growth in Kras/Lkb1-deficient transgenic mice (39). We previously reported that Kras/p53/Lkb1 tumors carry a much higher DNA damage rate, leading to increased dependence on Chk1 function (14). Herein, we expand the previous discoveries to a therapeutic investigation in mouse models.
Chek1 was a top hit in our previous synthetic lethal genetic screen using Lkb1-null lung cancer cell lines (14). The high-throughput small molecule kinase inhibitor synthetic lethal screen described in this report used the same set of Lkb1-null cell lines and again identified Chk1 as a top hit (Fig. 1). Lkb1-null cell lines carry markedly lower deoxythymidylate kinase expression (14), potentially creating a cellular state favorable for dUTP misincorporation. As a result, cells are more dependent on Chk1 function. Accordingly, both Lkb1-null cell lines and tumors show a higher DNA damage rate, and Lkb1-null cell lines are more sensitive to Chk1 inhibitors (14). Treatment of Lkb1-null and Lkb1-wt cell lines with DNA damage agents such as 5-FU or Pemetrexed did not detectably alter growth rate between these two (Supplementary Fig. S5A and S5B), suggesting that simply introducing more DNA damage into Lkb1-null cells does not contribute to the synthetic lethality. Collectively, these data demonstrate that Lkb1-null cells are subjected to more DNA damage and are more dependent on Chk1 function.
In the current study, we took advantage of the increased dependence of cells with LKB1-deficiency on Chk1 by using Chk1 inhibition to treat Lkb1-deficient lung tumors. Short-term treatment with Chk1 inhibitor AZD7762 decreased glucose uptake in Lkb1-null lung tumors, indicating a reduction in metabolic rate in the tumors. However, this treatment did not significantly reduce tumor size. Strikingly, combination therapy with Chk1 inhibitor AZD7762 plus DNA synthesis inhibitor gemcitabine (at a low-dose) significantly reduced Lkb1-null tumor volume. Moreover, LKB1-deficient NSCLC A549 and H2122 xenograft tumors grew more slowly when mice were treated with a combination of AZD7762 and gemcitabine than those in mice treated with either drug alone or with vehicle. Our discovery is highly relevant for clinical considerations as LKB1 loss is associated with elevated Chk1 levels in KRAS-mutant NSCLC patients (14).
To identify a new drug partner for combination therapy with Chk1 inhibitor AZD7762, we tested several drugs used in chemotherapy and targeted therapy to determine if they strengthened the effect of Chk1 inhibition in Lkb1-null cells in vitro and in vivo. Among the drugs tested, gemcitabine displayed the most effective synergistic interaction with AZD7762, although Taxotere also moderately synergized with AZD7762 in vitro and in vivo. Recently, Kaufman et al. reported that NSCLC cell lines with LKB1 loss are more sensitive to MEK inhibition (40); however, our in vivo pilot treatment study in Kras/p53/Lkb1 mice treated with Chk1 inhibitor AZD7762 plus MEK inhibitor AZD6642 for 9 days did not reduce lung tumor size (Supplementary Fig. S6A and S6B).
Chk1 inhibitors have long been used for anticancer therapy as chemotherapeutic agents, either alone or together with DNA damaging agents (28,41). Thus, for many other cancer types, a Chk1 inhibitor in combination with a DNA damaging agent has been used as a first- or second-line chemotherapy. In a departure from traditional chemotherapeutic approaches, we demonstrate that AZD7762 in combination with gemcitabine, at a low dose, may serve as a genotype-directed targeted therapy for treatment of lung cancer resulting from Kras-driven LKB1 loss.
Supplementary Material
Acknowledgments
We thank Dr. Yuchuan Wang for 18F-FDG-PET/CT image study.
Grant Support: This work was supported by the National Cancer Institute R01 CA195740 (K.K. Wong), CA163896 (K.K. Wong), CA166480 (K.K. Wong), CA122794 (K.K. Wong), and CA140594 (K.K. Wong); and the Stand Up to Cancer Lung Cancer Dream Team Award (K.K. Wong).
Abbreviations list
- GEMM
genetically engineered mouse model
Footnotes
Conflict of Interest: Kwok-Kin Wong is an equity holder in G1 Therapeutics and a consultant for G1 Therapeutics, AstraZeneca, Janssen and Array Pharmaceuticals.
References
- 1.Shackelford DB, Abt E, Gerken L, Vasquez DS, Seki A, Leblanc M, et al. LKB1 inactivation dictates therapeutic response of non-small cell lung cancer to the metabolism drug phenformin. Cancer Cell. 2013;23:143–58. doi: 10.1016/j.ccr.2012.12.008. [DOI] [PMC free article] [PubMed] [Google Scholar]
- 2.Beroukhim R, Mermel CH, Porter D, Wei G, Raychaudhuri S, Donovan J, et al. The landscape of somatic copy-number alteration across human cancers. Nature. 2010;463:899–905. doi: 10.1038/nature08822. [DOI] [PMC free article] [PubMed] [Google Scholar]
- 3.Ding L, Getz G, Wheeler DA, Mardis ER, McLellan MD, Cibulskis K, et al. Somatic mutations affect key pathways in lung adenocarcinoma. Nature. 2008;455:1069–75. doi: 10.1038/nature07423. [DOI] [PMC free article] [PubMed] [Google Scholar]
- 4.Matsumoto S, Iwakawa R, Takahashi K, Kohno T, Nakanishi Y, Matsuno Y, et al. Prevalence and specificity of LKB1 genetic alterations in lung cancers. Oncogene. 2007;26:5911–8. doi: 10.1038/sj.onc.1210418. [DOI] [PMC free article] [PubMed] [Google Scholar]
- 5.Sanchez-Cespedes M, Parrella P, Esteller M, Nomoto S, Trink B, Engles JM, et al. Inactivation of LKB1/STK11 is a common event in adenocarcinomas of the lung. Cancer Res. 2002;62:3659–62. [PubMed] [Google Scholar]
- 6.Kaufman JM, Amann JM, Park K, Arasada RR, Li H, Shyr Y, et al. LKB1 Loss induces characteristic patterns of gene expression in human tumors associated with NRF2 activation and attenuation of PI3K-AKT. J Thorac Oncol. 2014;9:794–804. doi: 10.1097/JTO.0000000000000173. [DOI] [PMC free article] [PubMed] [Google Scholar]
- 7.Egan DF, Shackelford DB, Mihaylova MM, Gelino S, Kohnz RA, Mair W, et al. Phosphorylation of ULK1 (hATG1) by AMP-activated protein kinase connects energy sensing to mitophagy. Science. 2011;331:456–61. doi: 10.1126/science.1196371. [DOI] [PMC free article] [PubMed] [Google Scholar]
- 8.Gwinn DM, Shackelford DB, Egan DF, Mihaylova MM, Mery A, Vasquez DS, et al. AMPK phosphorylation of raptor mediates a metabolic checkpoint. Mol Cell. 2008;30:214–26. doi: 10.1016/j.molcel.2008.03.003. [DOI] [PMC free article] [PubMed] [Google Scholar]
- 9.Hardie DG, Ross FA, Hawley SA. AMPK: a nutrient and energy sensor that maintains energy homeostasis. Nat Rev Mol Cell Biol. 2012;13:251–62. doi: 10.1038/nrm3311. [DOI] [PMC free article] [PubMed] [Google Scholar]
- 10.Inoki K, Zhu T, Guan KL. TSC2 mediates cellular energy response to control cell growth and survival. Cell. 2003;115:577–90. doi: 10.1016/s0092-8674(03)00929-2. [DOI] [PubMed] [Google Scholar]
- 11.Jeon SM, Chandel NS, Hay N. AMPK regulates NADPH homeostasis to promote tumour cell survival during energy stress. Nature. 2012;485:661–5. doi: 10.1038/nature11066. [DOI] [PMC free article] [PubMed] [Google Scholar]
- 12.Mihaylova MM, Shaw RJ. The AMPK signalling pathway coordinates cell growth, autophagy and metabolism. Nat Cell Biol. 2011;13:1016–23. doi: 10.1038/ncb2329. [DOI] [PMC free article] [PubMed] [Google Scholar]
- 13.Faubert B, Vincent EE, Griss T, Samborska B, Izreig S, Svensson RU, et al. Loss of the tumor suppressor LKB1 promotes metabolic reprogramming of cancer cells via HIF-1alpha. Proc Natl Acad Sci U S A. 2014;111:2554–9. doi: 10.1073/pnas.1312570111. [DOI] [PMC free article] [PubMed] [Google Scholar]
- 14.Liu Y, Marks K, Cowley GS, Carretero J, Liu Q, Nieland TJ, et al. Metabolic and Functional Genomic Studies Identify Deoxythymidylate Kinase as a Target in LKB1-Mutant Lung Cancer. Cancer Discov. 2013;3:870–9. doi: 10.1158/2159-8290.CD-13-0015. [DOI] [PMC free article] [PubMed] [Google Scholar]
- 15.Shackelford DB, Vasquez DS, Corbeil J, Wu S, Leblanc M, Wu CL, et al. mTOR and HIF-1alpha-mediated tumor metabolism in an LKB1 mouse model of Peutz-Jeghers syndrome. Proc Natl Acad Sci U S A. 2009;106:11137–42. doi: 10.1073/pnas.0900465106. [DOI] [PMC free article] [PubMed] [Google Scholar]
- 16.Imielinski M, Berger AH, Hammerman PS, Hernandez B, Pugh TJ, Hodis E, et al. Mapping the hallmarks of lung adenocarcinoma with massively parallel sequencing. Cell. 2012;150:1107–20. doi: 10.1016/j.cell.2012.08.029. [DOI] [PMC free article] [PubMed] [Google Scholar]
- 17.Ji H, Ramsey MR, Hayes DN, Fan C, McNamara K, Kozlowski P, et al. LKB1 modulates lung cancer differentiation and metastasis. Nature. 2007;448:807–10. doi: 10.1038/nature06030. [DOI] [PubMed] [Google Scholar]
- 18.Liu W, Monahan KB, Pfefferle AD, Shimamura T, Sorrentino J, Chan KT, et al. LKB1/STK11 inactivation leads to expansion of a prometastatic tumor subpopulation in melanoma. Cancer Cell. 2012;21:751–64. doi: 10.1016/j.ccr.2012.03.048. [DOI] [PMC free article] [PubMed] [Google Scholar]
- 19.Wingo SN, Gallardo TD, Akbay EA, Liang MC, Contreras CM, Boren T, et al. Somatic LKB1 mutations promote cervical cancer progression. PLoS One. 2009;4:e5137. doi: 10.1371/journal.pone.0005137. [DOI] [PMC free article] [PubMed] [Google Scholar]
- 20.Cross DA, Ashton SE, Ghiorghiu S, Eberlein C, Nebhan CA, Spitzler PJ, et al. AZD9291, an irreversible EGFR TKI, overcomes T790M-mediated resistance to EGFR inhibitors in lung cancer. Cancer Discov. 2014;4:1046–61. doi: 10.1158/2159-8290.CD-14-0337. [DOI] [PMC free article] [PubMed] [Google Scholar]
- 21.Oxnard GR, Thress KS, Alden RS, Lawrance R, Paweletz CP, Cantarini M, et al. Association Between Plasma Genotyping and Outcomes of Treatment With Osimertinib (AZD9291) in Advanced Non-Small-Cell Lung Cancer. J Clin Oncol. 2016;34:3375–82. doi: 10.1200/JCO.2016.66.7162. [DOI] [PMC free article] [PubMed] [Google Scholar]
- 22.Neal JW, Sequist LV. Exciting new targets in lung cancer therapy: ALK, IGF-1R, HDAC, and Hh. Curr Treat Options Oncol. 2010;11:36–44. doi: 10.1007/s11864-010-0120-6. [DOI] [PubMed] [Google Scholar]
- 23.Sullivan I, Planchard D. ALK inhibitors in non-small cell lung cancer: the latest evidence and developments. Ther Adv Med Oncol. 2016;8:32–47. doi: 10.1177/1758834015617355. [DOI] [PMC free article] [PubMed] [Google Scholar]
- 24.de Sousa Cavalcante L, Monteiro G. Gemcitabine: metabolism and molecular mechanisms of action, sensitivity and chemoresistance in pancreatic cancer. Eur J Pharmacol. 2014;741:8–16. doi: 10.1016/j.ejphar.2014.07.041. [DOI] [PubMed] [Google Scholar]
- 25.Hayashi H, Kurata T, Nakagawa K. Gemcitabine: efficacy in the treatment of advanced stage nonsquamous non-small cell lung cancer. Clin Med Insights Oncol. 2011;5:177–84. doi: 10.4137/CMO.S6252. [DOI] [PMC free article] [PubMed] [Google Scholar]
- 26.Mini E, Nobili S, Caciagli B, Landini I, Mazzei T. Cellular pharmacology of gemcitabine. Ann Oncol. 2006;17(Suppl 5):v7–12. doi: 10.1093/annonc/mdj941. [DOI] [PubMed] [Google Scholar]
- 27.Roos WP, Kaina B. DNA damage-induced cell death by apoptosis. Trends Mol Med. 2006;12:440–50. doi: 10.1016/j.molmed.2006.07.007. [DOI] [PubMed] [Google Scholar]
- 28.Thompson R, Eastman A. The cancer therapeutic potential of Chk1 inhibitors: how mechanistic studies impact on clinical trial design. Br J Clin Pharmacol. 2013;76:358–69. doi: 10.1111/bcp.12139. [DOI] [PMC free article] [PubMed] [Google Scholar]
- 29.Garrett MD, Collins I. Anticancer therapy with checkpoint inhibitors: what, where and when? Trends Pharmacol Sci. 2011;32:308–16. doi: 10.1016/j.tips.2011.02.014. [DOI] [PubMed] [Google Scholar]
- 30.Chou TC, Talalay P. Quantitative analysis of dose-effect relationships: the combined effects of multiple drugs or enzyme inhibitors. Adv Enzyme Regul. 1984;22:27–55. doi: 10.1016/0065-2571(84)90007-4. [DOI] [PubMed] [Google Scholar]
- 31.Wang Y, Kung AL. 18F-FDG-PET/CT imaging of drug-induced metabolic changes in genetically engineered mouse lung cancer models. Cold Spring Harb Protoc. 2015;2015:176–9. doi: 10.1101/pdb.prot078246. [DOI] [PubMed] [Google Scholar]
- 32.Sausville E, Lorusso P, Carducci M, Carter J, Quinn MF, Malburg L, et al. Phase I dose-escalation study of AZD7762, a checkpoint kinase inhibitor, in combination with gemcitabine in US patients with advanced solid tumors. Cancer Chemother Pharmacol. 2014;73:539–49. doi: 10.1007/s00280-014-2380-5. [DOI] [PMC free article] [PubMed] [Google Scholar]
- 33.Seto T, Esaki T, Hirai F, Arita S, Nosaki K, Makiyama A, et al. Phase I, dose-escalation study of AZD7762 alone and in combination with gemcitabine in Japanese patients with advanced solid tumours. Cancer Chemother Pharmacol. 2013;72:619–27. doi: 10.1007/s00280-013-2234-6. [DOI] [PubMed] [Google Scholar]
- 34.Vansteenkiste JF, Stroobants SG, Dupont PJ, De Leyn PR, Verbeken EK, Deneffe GJ, et al. Prognostic importance of the standardized uptake value on (18)F-fluoro-2-deoxy-glucose-positron emission tomography scan in non-small-cell lung cancer: An analysis of 125 cases. Leuven Lung Cancer Group Journal of clinical oncology : official journal of the American Society of Clinical Oncology. 1999;17:3201–6. doi: 10.1200/JCO.1999.17.10.3201. [DOI] [PubMed] [Google Scholar]
- 35.Chen Z, Cheng K, Walton Z, Wang Y, Ebi H, Shimamura T, et al. A murine lung cancer co-clinical trial identifies genetic modifiers of therapeutic response. Nature. 2012;483:613–7. doi: 10.1038/nature10937. [DOI] [PMC free article] [PubMed] [Google Scholar]
- 36.Bijnsdorp IV, Giovannetti E, Peters GJ. Analysis of drug interactions. Methods Mol Biol. 2011;731:421–34. doi: 10.1007/978-1-61779-080-5_34. [DOI] [PubMed] [Google Scholar]
- 37.Kim N, Yim HY, He N, Lee CJ, Kim JH, Choi JS, et al. Cardiac glycosides display selective efficacy for STK11 mutant lung cancer. Sci Rep. 2016;6:29721. doi: 10.1038/srep29721. [DOI] [PMC free article] [PubMed] [Google Scholar]
- 38.Inge LJ, Friel JM, Richer AL, Fowler AJ, Whitsett T, Smith MA, et al. LKB1 inactivation sensitizes non-small cell lung cancer to pharmacological aggravation of ER stress. Cancer Lett. 2014;352:187–95. doi: 10.1016/j.canlet.2014.06.011. [DOI] [PubMed] [Google Scholar]
- 39.Svensson RU, Parker SJ, Eichner LJ, Kolar MJ, Wallace M, Brun SN, et al. Inhibition of acetyl-CoA carboxylase suppresses fatty acid synthesis and tumor growth of non-small-cell lung cancer in preclinical models. Nat Med. 2016;22:1108–19. doi: 10.1038/nm.4181. [DOI] [PMC free article] [PubMed] [Google Scholar]
- 40.Kaufman JM, Yamada T, Park K, Timmers CD, Amann JM, Carbone DP. A transcriptional signature identifies LKB1 functional status as a novel determinant of MEK sensitivity in lung adenocarcinoma. Cancer Res. 2016 doi: 10.1158/0008-5472.CAN-16-1639. [DOI] [PMC free article] [PubMed] [Google Scholar]
- 41.Puigvert JC, Sanjiv K, Helleday T. Targeting DNA repair, DNA metabolism and replication stress as anti-cancer strategies. FEBS J. 2016;283:232–45. doi: 10.1111/febs.13574. [DOI] [PubMed] [Google Scholar]
Associated Data
This section collects any data citations, data availability statements, or supplementary materials included in this article.