

Abstract
OCT has revolutionized the practice of ophthalmology over the past 10 to 20 years. Advances in OCT technology have allowed for the creation of novel OCT-based methods. OCT-Angiography (OCTA) is one such method that has rapidly gained clinical acceptance since it was approved by the FDA in late 2016. OCTA images are based on the variable backscattering of light from the vascular and neurosensory tissue in the retina. Since the intensity and phase of backscattered light from retinal tissue varies based on the intrinsic movement of the tissue (e.g. red blood cells are moving, but neurosensory tissue is static), OCTA images are essentially motion-contrast images. This motion-contrast imaging provides reliable, high resolution, and non-invasive images of the retinal vasculature in an efficient manner. In many cases, these images are approaching histology level resolution. This unprecedented resolution coupled with the simple, fast and non-invasive imaging platform have allowed a host of basic and clinical research applications. OCTA has been shown to demonstrate many important clinical findings including areas of macular telangiectasia, impaired perfusion, microaneurysms, capillary remodeling, some types of intraretinal fluid, and neovascularization among many others. More importantly, OCTA provides depth-resolved information that has never before been available. Correspondingly, OCTA has been used to evaluate a spectrum of retinal vascular diseases including diabetic retinopathy (DR), retinal venous occlusion (RVO), uveitis, retinal arterial occlusion, and age-related macular degeneration among others. In this review, we will discuss the methods used to create OCTA images, the practical applications of OCTA in light of invasive dye-imaging studies (e.g. fluorescein angiography) and review clinical studies demonstrating the utility of OCTA for research and clinical practice.
Keywords: Optical coherence tomography angiography, retina, glaucoma, physiology, vascular disease, macular degeneration
1. Introduction
Optical Coherence Tomography (OCT) is a non-invasive, interferometric imaging modality that enables in vivo imaging of the retina in cross-section (Drexler and Fujimoto 2008). Since its original introduction in 1991 (Huang, Swanson et al. 1991), OCT has been used to quantitatively evaluate retinal thickness and assess qualitative anatomic changes such as the presence or absence of many pathologic features, including intraretinal and subretinal fluid. The original implementation of OCT used time-domain technology (TD-OCT) that required a moving reference mirror. Therefore, TD-OCT only allowed ~400 A-scans per second and was commonly used to evaluate only 6 evenly spaced radial line scans that intersected at the fovea. The resolution of TD-OCT was also limited to 10–15 microns under the most ideal circumstances. The overall acceptance and clinical utility of TD-OCT was limited until the implementation of broad-band spectral domain technology (SD-OCT), a Fourier domain (FD-OCT) methodology, allowed 20,000–40,000 A-scans per second. This significantly improved the field-of-view and image resolution (~3–5 microns) and decreased motion artifact. Subsequent advances such as swept-source OCT (SS-OCT) incorporate a long wavelength and narrow-bandwidth source that is swept through a broad range of optical frequencies allowing very high spatial resolution and improved tissue penetration. The high cost of SS-OCT technology has limited wide-spread commercial and clinical acceptance of this method to date. Many additional improvements in OCT methods such as phase-sensitive OCT (Schwartz, Fingler et al. 2014, Wang, Kirkpatrick et al. April 2007, Wang, Ma et al. October 2006), polarization-sensitive OCT (Pircher, Hitzenberger et al. 2011), spectroscopic OCT (Kim, Brown et al. 2015), and OCT Angiography (OCTA) (Ferrara, Waheed et al. 2016) have been developed in recent years. These methods hold the promise of combining structural information with information about the function of the retinal tissue, and possibly of assessing tissue metabolism as well. A detailed review of each of the many OCT methods is beyond the scope of this review article, but the brief history of OCT provided above describes the overall context in which OCT angiographic methods have been developed.
The purpose of this article will be to review the recent developments in the use of OCT technology for non-invasive assessment of the retinal vasculature in health and disease with a particular emphasis on OCTA, whose role in the field of ophthalmology is only beginning to be defined. We will begin with a technical discussion of the various methods employed for OCTA, in order to lay the foundation for understanding its strengths and limitations. To understand the best applications of this method, we further compare and contrast it with current standard-of-care methods, including fluorescein angiography (FA) and indocyanine green angiography (ICG). The review concludes with a discussion of published articles in disease-specific categories that illustrate the strengths and limitations of OCTA, as well as highlight some of the novel findings OCTA has enabled.
2. Principles of Optical Coherence Tomography Angiography
Since OCTA is a technique that is based on OCT, a brief review of current OCT methodology is necessary as a prelude to the discussion of OCTA methods. OCT obtains depth-resolved tissue reflectivity characteristics by detecting the interference signal formed between the light reflected from the reference mirror and light backscattered from the biological sample. By changing the position of the reference mirror, the intensity of backscattered light from tissue can be detected from different depths in the tissue sample. A sequence of echoes originated from various depths form an intensity profile in the axial direction (A-scan), and optical cross-sections (B-scans) are assembled by scanning the OCT beam in the transverse direction. Since time-encoded signals are obtained in this manner, this approach is referred to as time-domain OCT (TD-OCT) (Marschall, Sander et al. 2011).
With hardware advancements and technical developments, later OCT devices detect the backscattered signals from biological tissues in the frequency domain with either a broad-bandwidth light source, a charge-coupled device (CCD) camera, and a spectrometer (spectral-domain OCT or SD-OCT), or by sweeping through a range of optical frequencies (swept-source OCT or SS-OCT) (Wojtkowski, Leitgeb et al. 2002, Choma, Sarunic et al. 2003, de Boer, Cense et al. 2003, Leitgeb, Hitzenberger et al. 2003, Cense, Nassif et al. 2004, Nassif, Cense et al. 2004, Wojtkowski, Srinivasan et al. 2004). SD-OCT typically uses an 800 to 900-nm wavelength source, and its scan speed ranges from 40 to 100-kHz. SD-OCT has increased sensitivity roll-off with depth as compared to SS-OCT (Miller, Roisman et al. 2017, Zhang, Chen et al. 2017). Also, shorter wavelengths are more prone to scattering and attenuation; thus, they penetrate into tissue less than the longer wavelengths used in the SS-OCT devices. SS-OCT devices typically use wavelengths above 1000-nm and operate at speeds equal to or greater than 100-kHz (Drexler and Fujimoto 2008, Ploner, Moult et al. 2016).
For both SD- and SS-OCT enabled devices, frequency information of interference signal from all depths at a given spatial position in the tissue can be acquired without a need for physically moving the reference mirror. This information can then be converted into an intensity profile by Fourier-transform, which represents the tissue depth reflectivity profile. Fourier-domain algorithms are applicable to both SD- and SS-OCT enabled devices. The implementation of a light source with a broader bandwidth enhances the axial resolution from 10μm to 2μm, and the introduction of the spectrometer or sweeping frequencies improves the image acquisition speed (from 400 A-scans/s to between 26,000 and 100,000 A-scans/s) (Drexler and Fujimoto 2008, Gabriele, Wollstein et al. 2010, Grulkowski, Liu et al. 2012, Leung 2014). With the improvements of scanning speed and resolution in FD-OCT, collecting 3D scans of biological tissues has become more feasible. More information from biological tissues can be acquired in a relatively shorter amount of time, allowing for more detailed visualization of biological structures. With all of its advantages, OCT has emerged as an important tool in both the quantitative and qualitative assessment of tissue structure. Clinically, it has become indispensable in the routine diagnosis and management of disease, especially as it pertains to ophthalmology (Drexler and Fujimoto 2008).
OCTA is a new imaging technique based on OCT which allows for the visualization of functional blood vessels in the eye. The principle of OCTA is to use the variation in OCT signal caused by moving particles, such as red blood cells (RBC), as the contrast mechanism for imaging blood flow (Wang, Jacques et al. 2007, Zhang, Zhang et al. 2015, Chen and Wang 2017). In order to conceptualize this, imagine two OCT signals, one is backscattered from static structural tissue and the other is backscattered from the moving RBCs in vessels (Figure 1). The signal from the structural tissue remains steady, while the signal from the flowing blood changes over time due to the constant motion of the RBCs. To differentiate the moving particles from static tissue, repeated scans are performed at the same location. Temporal changes of the OCT signal in subsequent scans caused by the moving particles generate the angiographic contrast, providing the opportunity to visualize the microvasculature. Notably, any moving particle may generate a motion contrast signal; however, the predominant movement in retinal tissue is from the RBCs. For example, lipid particulates in solution generate OCTA signals as a result of Brownian-like motion (Fingler, Schwartz et al. 2007). After Fourier transform, the OCT signal contains amplitude (intensity) and phase information, and so several algorithms have been developed for OCTA technique in order to utilize different components of the OCT signal. They can be separated into three categories: (1) phase-signal-based OCTA, (2) intensity-signal-based OCTA, and (3) complex-signal-based OCTA.
Figure 1.

Illustration of OCTA scanning methodology and signal processing scheme. This figure illustrates the theoretical difference in the behavior of OCT beams that interact with retinal tissue depending whether the beams strike blood vessels or neurosensory retinal tissue. At time T1, two OCT beams are incident on the retinal tissue. Beam A1 (red) strikes a retinal artery while beam A2 (blue) strikes adjacent neurosensory retinal tissue that is static. Each beam is back-scattered and generates an A-scan signal shown in the middle. Similarly, at time T2 another scan is performed and illustrated. The interaction of the incident light from beam A1 with moving red blood cells causes more variability in the OCT signal from beam A1 as illustrated in the A-scan signal traces. These signals are then “averaged” as shown by the black arrows to generate a composite OCTA signal that is illustrated in the far right of the panel. The increased variability of the OCT signal from beam A1 is illustrated and is localized to the regions where red blood cell movement occurred. A sample B-scan is illustrated in the lower right of the panel.
2.1 Phase-signal-based OCTA Techniques
2.1.1 Doppler OCT
Following the invention of OCT, the notion of utilizing OCT techniques to measure blood flow velocities noninvasively emerged in the mid-1990s. Based on TD-OCT, Chen et al. developed an optical technique for noninvasive imaging of in vivo blood flow dynamics and tissue structures by combining Doppler velocimetry with OCT (Chen, Milner et al. 1997). In the same year, Izatt et al. demonstrated a bidirectional color Doppler imaging technique for visualizing flow in biological tissues by employing coherent signal-acquisition electronics and joint time-frequency analysis algorithms to perform flow imaging simultaneous with conventional OCT images (Izatt, Kulkarni et al. 1997). The central hypothesis for Doppler OCT is that if a sample interface moves axially at a constant speed vs, the backscattered OCT signal experiences a frequency or phase shift, fD, called the Doppler shift, and that phase shift is additive to the carrier/heterodyne interference frequency associated with the reference arm (Leitgeb, Werkmeister et al. 2014, Zhang, Zhang et al. 2015).
To detect the Doppler shift in a TD-OCT signal, a short-time Fourier-transform algorithm is applied to extract the phase information, and a small window sliding across an A-scan is used to acquire the local frequency shifts at various depths. However, this approach is computationally expensive and reduces the axial resolution for imaging flow. Therefore, it cannot be applied for in vivo real-time flow measurements (Proskurin, He et al. 2003, Leitgeb, Werkmeister et al. 2014).
The introduction of Fourier-domain based OCT systems brought a dramatic change in Doppler OCT development. The significantly increased scanning speed of FD-OCT enables higher in vivo flow detection sensitivity, without compromising image quality (Leitgeb, Schmetterer et al. 2003). In 2002, Leitgeb et al. demonstrated the first functional extension of FD-OCT for measuring blood flow and showed the high phase sensitivity of the method (Leitgeb, Schmetterer et al. 2002). With FD-OCT, the blood flow information can be easily acquired by calculating the changes in the phase signals between adjacent A-scans.
Although Fourier-domain based Doppler OCT significantly improved the sensitivity, image quality, and scanning speed, there were still some drawbacks associated with it. First, it cannot detect flow if the vessels are perpendicular to the incident OCT beam. Second, the Doppler shift is vulnerable to the movement of the sample. In order to obtain precise phase differences for accurate measurements of blood flow velocity, it is important to minimize the phase differences caused by the bulk motion of the sample. Oftentimes, this is difficult to achieve because unavoidable sample movements occur during in vivo imaging (Makita, Hong et al. 2006).
Despite this limitation, in 2006, Makita et al. reported a noninvasive retinal angiography imaging technique based on Doppler OCT, called optical coherence angiography. Two mechanisms were proposed to minimize the sample movement in the axial direction: (1) compensation of the axial shift between adjacent A-scans within one B-scan using histogram-based bulk motion Doppler shift compensation, and (2) compensation of the motion between adjacent B-scans using the cross-correlation of particular A-scans of interest. After tissue motion compensation, the angiography was obtained as the average of Doppler OCT and power Doppler, which was defined as the power of the phase difference between adjacent A-scans (Makita, Hong et al. 2006). Their approach is regarded as the first phase-signal-based OCTA technique.
Doppler OCT is insensitive to microcirculation, and visualization has typically been limited to major veins and arteries (Leitgeb, Schmetterer et al. 2003, Makita, Hong et al. 2006, An and Wang 2008, Szkulmowska, Szkulmowski et al. 2009, Tao, Kennedy et al. 2009). A dual-beam scanning strategy was proposed to improve the sensitivity in measuring the blood flow for Doppler OCT (Makita, Jaillon et al. 2011, Zotter, Pircher et al. 2011). The use of two individual sample arm beams relaxed the constraint of requiring dense A-scans, which widened the time separation between two A-scans as well as the velocity measurement range.
2.1.2 Phase-Variance OCT
Doppler OCT and optical coherence angiography demonstrate the original paradigm of OCT-based angiography. Based on a similar idea, Fingler et al. developed a motion contrast technique based on FD-OCT to visualize the vasculature in zebrafish (Fingler, Schwartz et al. 2007), and subsequently in the retina and choroid of the mouse (Fingler, Readhead et al. 2008). They then adapted the technique for human retinal imaging (Fingler, Zawadzki et al. 2009). By measuring the phase variance between adjacent B-scans, the motion-contrast technique, called phase-variance OCT, is capable of visualizing a wider range of velocities and flow orientations than Doppler OCT (Fingler, Zawadzki et al. 2009). The flow signal in phase-variance OCT is calculated based on the following equation:
where N represents the repetition number of B-scans at the same location, Φi(x, z, t) and ΔΦi(x, z, t) indicate the phase value and phase difference in the i-th B-scans at lateral location x, depth position z, and time t, T is the time interval between two consecutive B-scans, and i is the index of the i-th B-scan. With a proper choice of the repeated scanning along the B-scan, e.g. B-M scan, the time interval between two A-scans that are used for phase measurement is significantly increased. As a consequence, the sensitivity to slower flow and microcirculation is dramatically increased, even though the velocity information of the flow is lost. By using phase-variance, instead of phase-resolved difference, the detected vasculatures have less dependence on vessel orientation and flow velocity (Zhang, Zhang et al. 2015). Kim et al. (Kim, Fingler et al. 2011) reported a faster phase-variance OCT system that had an image acquisition A-scan rate of 125 kHz and a larger field of view for human retinal circulation imaging. Schwartz and his colleagues later demonstrated the angiogram from phase-variance OCT obtained from patients with dry age-related macular degeneration (AMD), exudative AMD, and nonproliferative diabetic retinopathy (NPDR) (Schwartz, Fingler et al. 2014). By correcting the lateral and axial motion of the eyes, the phase noise was significantly reduced. High-resolution volumetric images of the retina and choroid were presented. Areas of geographic atrophy and choroidal neovascularization (CNV), imaged by FA, as well as regions of capillary nonperfusion from DR were also depicted by phase-variance OCT (Schwartz, Fingler et al. 2014). Kurokawa et al. further proposed using Doppler power imaging with adaptive optics. In their methods, the flow signal intensity was determined by the squared power of the Doppler shift. With the use of adaptive optics, the sensitivity to flow signal remained similar, while an increased lateral resolution for vascular imaging was observed (Kurokawa, Sasaki et al. 2012).
2.2 Intensity-signal-based OCTA Techniques
2.2.1 Speckle-Variance OCT
Doppler OCT initiated the functional extension of the OCT technique. However, the technique suffered from an angular dependence of the measured blood flow and it was insensitive to the flow perpendicular to the scanning beam (Barton and Stromski 2005, Enfield, Jonathan et al. 2011). In order to resolve this issue, Barton and Stromski developed an alternative method to extracting flow information (Barton and Stromski 2005). Based on a TD-OCT system with Doppler capability, their method measured the speckle change in the OCT signal (Barton and Stromski 2005). It has been shown that the speckles in OCT signals play a dual role; both as a source of noise and as a carrier of information about tissue microstructure and flow (Schmitt, Xiang et al. 1999). Adopting the idea from laser speckle technique, Barton and Stromski hypothesized that the flow measurement techniques developed for laser speckle could be adapted to flow measurements in OCT (Barton and Stromski 2005). By measuring the speckle variance within the adjacent 4-pixel region using only the amplitude information in the OCT signal, the authors were able to successfully visualize the flow image in an in vitro tube phantom and in in vivo hamster skin. This was the first time speckle analysis was applied to OCT images in order to determine depth-resolved flow (Barton and Stromski 2005). Later, Mariampillai et al. used a similar speckle variance concept based on FD-OCT to image the microcirculation, demonstrating that speckle variance OCT could detect vessel size-dependent vascular shutdown and transient vessel occlusion during photodynamic therapy (Mariampillai, Standish et al. 2008). By imaging the same transverse location several times, the inter-frame speckle variance signal can be acquired using the following equation:
where N represents the repetition number of B-scans at the same location, Ii(x, z) indicates the intensity value in i-th B-scans at lateral location x, depth position z, and is the average of the intensity values over the same set of pixels. The proposed method was further optimized in the separation interval (by adjusting number of repetition or field of view) to improve the image contrast and signal-to-noise ratio for visualizing microcirculation in tissues with both low and high bulk motion (Mariampillai, Leung et al. 2010).
Recently, Xu et al. developed a hardware-accelerated speckle variance OCT for visualizing blood flow in the human retina (Xu, Han et al. 2015). The proposed speckle variance OCT was based on a custom-built SS-OCT system, which operated at an A-line rate of 100-kHz. With the help of graphics processing units, the reported system allowed for the visualization of blood flow in the human retinal capillary network in real-time. Comparing it with FA, the capillary density detected in speckle variance OCT appeared greater than FA. In addition, speckle variance OCT was able to identify the terminal capillaries around the foveal avascular zone (FAZ) with greater precision. Mammo et al. (Mammo, Balaratnasingam et al. 2015) later investigated the utility of speckle variance OCT by comparing the retinal capillary network around the FAZ in normal human eyes and donor eyes using FA and confocal scanning laser microscopy. Yu et al. (Yu, Balaratnasingam et al. 2015) focused on the radial peripapillary capillaries in the peripheral region around the disc. The results demonstrated that speckle variance OCT was able to stratify the foveal circulation into inner and deep capillary plexuses as well as reliably and reproducibly quantify and assess the morphometric dimensions of the human FAZ (Mammo, Balaratnasingam et al. 2015, Yu, Balaratnasingam et al. 2015). The morphological characteristics of RPE on speckle variance OCT were comparable to histological images (Mammo, Balaratnasingam et al. 2015, Yu, Balaratnasingam et al. 2015). These further highlighted the utility of speckle variance OCT for human retina imaging.
2.2.2 Correlation-Mapping OCT
Another intensity-signal-based OCTA method was introduced by Jonathan et al. (Jonathan, Enfield et al. 2011) and Enfield et al. (Enfield, Jonathan et al. 2011) in 2011. By taking advantage of the time-varying speckle effect and after observing the phenomenon that vascular regions and their immediate vicinities show stronger speckle signals as compared to the non-flow regions (static tissue), Jonathan et al. proposed a simpler method to detecting the flow signal (Jonathan, Enfield et al. 2011). They calculated the correlation of OCT signals between adjacent scans; therefore, the method was named correlation mapping (Jonathan, Enfield et al. 2011). Since flow regions showed lower correlation coefficient values and static tissues showed higher correlation magnitudes, it is possible to distinguish micro-vasculatures from static tissues by estimating its correlation with a set threshold. Multiple B-scans were captured at the same transverse location (Jonathan et al. acquired 8 B-scans for mouse brain in vivo through a cranial window, while Enfield et al. adjusted to 2 B-scans for human volar forearm). The flow signal was further acquired by cross-correlating a grid from frame A (IA) to the same grid from frame B (IB) using the following equation: (Enfield, Jonathan et al. 2011)
where M and N indicate the grid size and Ī is the mean intensity value within the grid. The same notation as we showed before, Ii(x, z), indicates the intensity value in i-th B-scans at the lateral location x and depth position z. The grid is then shifted across the entire B-scan and a two-dimensional (2D) map is generated. The correlation values ranged from −1 to 1, where 0 indicated weak correlation and −1 and 1 indicated strong inverse correlation and strong correlation, respectively. The grid size used in the study was arbitrarily chosen for optimal image quality. Larger grid sizes lead to higher signal-to-noise ratios, but may also result in longer processing times, blurring effects, and loss of smaller vessels. In their first demonstration, correlation mapping successfully showed the capillary pattern in a multi-layered capillary tube phantom as well as in the capillary networks of mice brains and human volar forearms. Later, McNamara et al. (McNamara, Subhash et al. 2013) employed the same correlation mapping technique to full-field OCT to perform non-scanning en face flow imaging from pairs of en face images. In contrast with most OCT approaches, full-field OCT directly takes 2D en face images with megapixel cameras (Dubois, Vabre et al. 2002). Since the large depth-of-field information is omitted, full-field OCT is able to provide 2D or 3D images with a resolution of 1μm, at least matching the cellular resolution in skin tissue (Dalimier and Salomon 2012). The study demonstrated the first application of correlation mapping to full-field OCT to provide in vivo functional imaging of blood vessels (McNamara, Subhash et al. 2013).
2.2.3 Split-Spectrum Amplitude-Decorrelation Angiography (SSADA) Algorithm
Based on the same time-varying speckle effect concept, Jia et al. (Jia, Tan et al. 2012) improved the correlation mapping method by proposing a split-spectrum amplitude-decorrelation angiography (SSADA) algorithm to extract the flow signal and to distinguish vessels from static tissues in 2012. In contrast to correlation mapping, the amplitude decorrelation algorithm generates the flow signal by measuring the decorrelation between two consecutive B-scans. In order to reduce the noise caused by tissue bulk motion, they further employed split-spectrum algorithm to diminish the sensitivity in the axial direction to pulsatile bulk motion (Zhang, Zhang et al. 2015) and combined split-spectrum with amplitude decorrelation to improve the signal-to-noise ratio. With SSADA, the full OCT spectrum was split into several narrower bands, the inter-B-scan decorrelation was computed for each sub-band, and it was subsequently averaged to get the final flow signal, as shown in the following equation:
where M is the number of split-spectrums, N indicates the repetition number of B-scans at the same location, and Iim(x, z) indicates the intensity value in i-th B-scans of m-th split-spectrum at lateral location x and depth position z. By increasing the number of split-spectrums, the decorrelation signal-to-noise ratio can be improved without increasing the scan acquisition time. The optimized number for split-spectrum was later discovered to be 9 (Gao, Liu et al. 2015, Gao, Liu et al. 2016). Due to the spectrum splitting for contrasting blood flow, the axial resolution of SSADA method is reduced to typically three times lower resolution than that of conventional OCT images. For example, if the OCT system used for angiographic imaging is designed with an axial resolution of 5μm microns, then SSADA algorithm results in ~ 15μm axial resolution for flow imaging.
It has been demonstrated that the SSADA algorithm is able to detect retinal vessels and capillary networks in the macular and optic disc regions of the human retina, and it can be used to differentiate diseased eyes from normal controls for glaucoma and retinal diseases including AMD (Jia, Bailey et al. 2014, Jia, Wei et al. 2014, Hwang, Jia et al. 2015, Jia, Bailey et al. 2015, Liu, Jia et al. 2015, Spaide 2015, Spaide, Klancnik et al. 2015, Chalam and Sambhav 2016).
2.3 Complex-signal-based OCTA Techniques
2.3.1 Optical Microangiography (OMAG)
The third category utilizes both the intensity and phase information of the OCT signal, i.e. coherent information, in order to calculate the flow signal. The representative of complex-signal-based OCTA technique is optical microangiography, proposed first by Wang et al. in 2007 (Wang, Jacques et al. 2007) and later refined into its current implementation in 2010 (Wang 2010, Wang, An et al. 2010). Even though using the phase change, caused by moving particles, to calculate the flow signal is vulnerable to bulk motion and may easily be affected by the Doppler angle, measuring the flow signal only based on intensity information may decrease the sensitivity of flow detection if the induced change only happens in the phase signal. Therefore, Wang et al. included both the phase and intensity components of the OCT signal in the flow signal calculation in order to increase its sensitivity. With the help of phase compensation methods, the phase variation induced by pulsatile bulk motion can be reduced (Huang, Zhang et al. 2014, Thorell, Zhang et al. 2014). After phase compensation, the flow signal based on the OMAG algorithm is calculated by subtracting consecutive complex signals, as shown in the following equation:
where N indicates the repetition number of B-scans at the same location, and Ci(x, z) indicates the complex signal (having both intensity and phase values) in i-th B-scans at lateral location x and depth position z. As indicated in the equation, the final flow intensity is obtained by calculating the average of the absolute values of the complex signal differences in each B-scan pair, i.e. the coherent averaging. With the use of the Hilbert transformation, OMAG is also able to discriminate the directions of the moving blood cells relative to the incident OCT beam direction (Wang 2010), and therefore, OMAG can provide the flow image either with or without directional information.
Considering the trade-off between the scanning time and the number of B-scan repetitions (more repetitions can provide a higher signal-to-noise ratio), they achieved high flow image quality with 4 B-scan repetitions at the same location in its first demonstration. It was later reported that 2 B-scans at the same location would also be able to detect the capillary network with good image quality (Wang, Zhang et al. 2016).
Optical microangiography has been used to illustrate the microcirculation in mice brains (Wang 2010), human skin tissue beds (An, Qin et al. 2010), and human retina (Wang, An et al. 2010, Wang, An et al. 2010, An, Shen et al. 2011). With its high sensitivity in detecting retinal capillaries, choroiocapillaris, and radial retinal capillaries, it was later demonstrated to be capable of differentiating diseased eyes from normal eyes (Thorell, Zhang et al. 2014, Zhang, Wang et al. 2015, Bojikian, Chen et al. 2016, Chen, Zhang et al. 2016, Roisman, Zhang et al. 2016, Zhang, Lee et al. 2016). Thus, it may add insightful information to disease developments.
2.3.2 Multiple Signal Classification OMAG
In addition to OMAG, Yousefi et al. (Yousefi and Wang 2014) proposed a multiple signal classification OMAG method, which is a super-resolution spectral estimation method based on the principle of orthogonality, to detect the flow signal. The proposed method modeled the OCT signal at each voxel as a superposition of three independent components: tissue signal (stationary and slowly moving tissue structures), hemodynamic signal (mostly comes from moving red blood cells), and noise (system noise and shot noise). By applying eigen-decomposition (Yousefi, Zhi et al. 2011), the multiple signal classification OMAG method is capable of decomposing the backscattered OCT signal into orthogonal basis functions and distinguishing the flow signal caused by moving RBCs from static tissue and noise. The flow signal obtained using this approach enabled the visualization of functional microvascular networks within skin tissue in vivo, and it was shown to be correlated with the product of the concentration and flow velocity of blood (Zhang, Zhang et al. 2015). The more important feature of this method is its adaptive nature: it rejects the static tissue signal in order to contrast the blood flow signal. This is achieved because it suppresses the static tissue signal according to the Eigen components in the ensemble signal composition. Therefore, unlike conventional OMAG, the multiple signal classification OMAG method does not require phase-compensation due to bulk tissue movement in order to achieve OCT angiograms of scanned tissue volume.
2.3.3 Imaginary Part-based Correlation Mapping OCT
To solve the blurry side effect that is introduced after the correlation window size is increased for a higher signal-to-noise ratio in correlation mapping of OCT images, Chen et al. (Chen, Shi et al. 2015) proposed an imaginary part-based correlation mapping OCT to reconstruct microcirculation maps with higher flow image quality and smaller vessel detection sensitivity. In their method, a complex analytic signal in the spatial domain was obtained by performing Fourier transform in the wavenumber domain. The extracted imaginary part of an OCT signal, i.e. the complex OCT signal, was later correlated between consecutive B-scans to get the flow information. In order to suppress the false flow signal caused by tissue motion, an intensity OCT signal-based sub-pixel cross-correlation registration and the Kasai estimator were applied to register between two B-scans before the correlation calculation, similar to phase compensation of bulk tissue motion. The imaginary part-based correlation was then calculated using the following equation:
where M and N indicate the grid size, and C̄ is the mean complex value within the grid. The same notation as we showed before, Ci(x, z) indicates the intensity value in i-th B-scans at the lateral location x and depth position z. The same as what is done in intensity-based correlation mapping OCT, the grid was shifted across the entire image to obtain a 2D correlation map. The correlation values range from −1 to 1, with the value of 0 indicating a weak correlation, and the values of −1 and 1 indicating a strong inverse-correlation and a strong correlation, respectively. Similar to the concept of OMAG, since complex signals contain both intensity and phase information, the phase changes caused by the displacements of curve form of RBCs, which does not change the intensity, is able to be detected. Therefore, imaginary part-based correlation mapping OCT is more sensitive to motion, and it can provide improved sensitivity for extracting blood flow information in small vessels. The proposed method was tested with an in vitro phantom and an in vivo mouse ear. Compared with intensity-based correlation mapping OCT, their results showed small blood vessels, which were missed by the conventional correlation mapping OCT method. This is the first study that introduced phase information into conventional intensity-based correlation mapping in order to increase the sensitivity for small vessels and signal-to-noise without increasing the grid size.
2.4 Imaging Artifacts in OCTA
Image artifacts in OCTA are in many ways similar to, and derived from, artifacts that occur in OCT. In general, image artifacts in OCTA occur as a result of one or more of the following: (1) the scanning methodology used to generate the motion contrast signal, (2) data processing, (3) movement of the eye, and (4) the intrinsic properties of the eye and pathology. An extensive discussion of these artifacts is already available (Spaide, Fujimoto et al. 2015) and a more synthesized review is presented below with particular emphasis on projection artifacts.
OCTA images are generally made by repeating B-scans over the same tissue location 2 or more times. Therefore OCTA images require either more time to scan the same area of retina as a standard SD-OCT or a smaller field-of-view. In either case, the need for repeating B-scans in the exact same location makes OCTA imaging much more sensitive to both axial and transverse motion artifact from microsaccades, breathing, and cardiac cycle pulsations. Commercial systems compensate for these artifacts by implementing motion-tracking technology and post-processing image registration software. In addition, some OCTA image processing methods, such as SSADA, use reduced axial resolution with averaging to minimize the appearance and effect of these movement artifacts as discussed below (Jia, Tan et al. 2012). The adoption of faster OCT systems, such as SS-OCT, will also minimize the effect of increased scan times and motion artifact.
Another major source of artifacts in OCTA images is derived from the combination of the structure of retinal vessels and the source of OCTA signal. The flow signals detected by OCTA techniques are based on differentiating the backscattered OCT signals from the tissue and vessels. When the incident OCT beam hits a blood vessel, the light beam can be reflected, refracted, absorbed, or passed through the vessel. The light passing through moving blood can further encounter tissues below the vessels. When the underlying tissue is hypereflective, such as the retinal pigment epithelium, light will be backscattered again, which inevitably generates false or ghost blood flow signals (Spaide, Fujimoto et al. 2015). On the other hand, it may be more difficult to detect blood flow in the regions surrounding and under hyporeflective lesions (such as intraretinal fluid pockets or floaters). Given the 3D nature of OCT, the fluctuating shadows from flowing blood cells in the superficial vessels will also cast extra flow signals to the deeper vascular networks, generating false vessel networks when producing the en face flow images of deeper retinal tissue. This effect is called an OCTA projection artifact (Zhang, Zhang et al. 2015, Zhang, Hwang et al. 2016). These artifacts are observed in structures that are located below the vasculature, and may either limit our ability to visualize true retinal vessels in the same region or may erroneously suggest there is a vessel where in fact there is none. This is particularly problematic in the detection and measurement of choroidal neovascularization as well as the implementation of quantitative metrics, which we discuss in detail below.
To minimize the projection artifacts in the outer retinal avascular space (defined as the space between the outer plexiform layer to Bruch’s membrane), Zhang et al. (Zhang, Zhang et al. 2015) proposed a model to mimic the angiogram. The hypothesis was that the projection artifacts appearing in the en face flow images of the outer retinal avascular space came from the blood vessels in the retina. Thus, the detected flow signals in the outer retinal avascular space were a combination of the actual flow signal and the projection artifacts from the superficial retinal vasculature, which can be represented as the following equation:
where AORAS(x, y) indicates the en face flow image of detected flow signal in the outer retinal avascular space, AT(x, y) indicates the true flow signal in the ORAS, ARetina(x, y) indicates the flow signal in the retina, and α represents a scaling factor to properly scale the level of retinal flow signals. With a logarithmic operation, the equation can be rewritten as:
Therefore, the true flow signals in the outer retinal avascular space can be acquired by subtracting the retinal flow signals, with proper scaling, from the detected flow signals in the outer retinal avascular space. Due to the hyper-reflection signal observed from the RPE, the performance of the artifact removal algorithm can be substantially improved if the structural signal of the outer retinal avascular space is considered into the formulation of the algorithm (Zhang, Zhang et al. 2015). This has been particularly useful in the visualization of choroidal neovascular lesions. The proposed method successfully removed the projection artifacts in the outer retinal avascular space, demonstrated the avascular layer in a normal eye, and revealed the outer retinal neovascularization in an eye with Type 1 CNV. With a similar concept, Liu et al (Liu, Gao et al. 2015) removed the projection artifacts in the deeper retinal layer by subtracting the inner retinal angiogram (retina slab from inner limiting membrane to the outer plexiform layer) from the outer retinal avascular layer. Afterwards, a saliency algorithm was applied to detect the choroidal neovascularization region for area measurements.
Contrary to the slab-subtraction methods, Zhang et al. proposed a project-resolved algorithm to remove the projection artifacts in OCTA (Zhang, Hwang et al. 2016). The authors observed that the intensity of projected or false flow signals from individual A-scans are almost always weaker than the actual flow signals. Based on this observation, they designed a method to search for successive higher peaks in the normalized decorrelation value, from the end of each peak towards the deep tissue along each A-scan. The highest peak then effectively identifies the real vessels and allows for the removal of the projection artifacts. The authors concluded that unlike the slab-subtraction methods (Liu, Gao et al. 2015, Zhang, Zhang et al. 2015) the projection-resolved algorithm eliminated the projected signals in the cross-sectional images, preserved vessels hidden under large retinal vessels, and did not need the information of pre-defined superficial retinal layer (SRL) boundaries. The result of this algorithm was called projection-resolved OCTA. Projection-resolved OCTA may be able to preserve the continuity of vessel networks and capillary plexuses after saliency algorithm processing, and it provides more information than the standard OCTA.
2.5. Ability to Quantify Blood Flow versus Capillary Anatomy
The ability to noninvasively visualize microvascular flow in vivo and to display pathologic changes related to disease progression using OCTA has been well established. However, the quantitative relationship between the flow signal and the flow volume or “blood flow” information is still not clear. To investigate the relationship between the OMAG signal and flow information, Choi et al (Choi, Qin et al. 2016) developed a simplified analytic model and tested it with simulation and in vitro microfluidic flow phantom by varying preset flow parameters. In this model, the intralipid concentration varied from 1% to 4% with velocity ranging from 1-mm/s to 4-mm/s (with 1-mm/s increments). In the proposed analytic model, the difference of complex OCT signals could be viewed as the product of concentration (i.e. how many particles within one scanning voxel) and flow velocity (from amplitude decorrelation), representing the concept of flux (i.e. the number of particles passing through a unit cross-section within a unit of time). The results from the simulation and the in vitro microfluidic phantom supported each other, and indicated that (1) the OMAG signal intensity had a linear relationship with flow velocity within a certain velocity range that is dependent on the OCT B-scan rate. When the time interval between successive B-scans is 50-μs, the OMAG signal is approximately linear to flow velocity (ranging from 0.3 to 5-mm/s), and (2) the OMAG signal intensity is linearly proportional to the intralipid concentration. However, in the current commercial OMAG protocol parameters, the separation time between two consecutive B-scans is about 3.4-ms. At this time scale, the saturation velocity is lower than 0.3-mm/s for a spectral-domain OCT with a center wavelength of 840-nm (that is commercially used for SD-OCTA devices). It has been observed that the velocity of RBCs in normal human retinal capillaries ranges from 0.3 to 3.3-mm/s (Bedggood and Metha 2012), and therefore, the OMAG signal may be saturated and only related to information regarding the red blood cell concentration.
On the other hand, Tokayer et al (Tokayer, Jia et al. 2013) tested the relationship between SSADA signal and blood flow velocity using an in vitro phantom experiment with whole blood to mimic in vivo retinal imaging. They found that the decorrelation signal and the flow velocity had a linear relationship when the time interval between two consecutive A-scans ranged approximately from 56 to 280-μs. When the flow speed reached 2-mm/s, the SSADA decorrelation signal reached saturation, i.e. the SSADA decorrelation value would be independent of the velocity change, with an A-scan time interval around 500-μs. Their results also indicate that with the clinical SD-OCTA imaging protocol, where the time interval between two consecutive B-scans is around 2 to 3-ms, it is difficult to absolutely quantify flow using OCTA images at present. The easily saturated relationship of OCTA flow signal may be improved with current OCT devices by using an M-mode scan protocol or by using an ultrafast OCT system that provides a shorter inter-frame time interval. In contrast to an A-scan, an M-mode scan, repeatedly captures multiple A-scans at the same point in a short amount of time before moving on to the next sampling location.
Although the time interval of millisecond scale between consecutive B-scans reached the plateau of the relationship curve between the OCTA signal and blood flow velocity, Choi et al (Choi, Moult et al. 2015) noticed that increasing the time interval between adjacent B-scans increases the sensitivity of flow detection. Choi and colleagues used their custom-built ultrahigh-speed SS-OCT system to acquire OCTA images in 3×3-mm2 and 6×6-mm2 areas centered at the foveola. At each transverse location, 5 repeated B-scans were acquired to assess the difference in OCT signal over time. A variable interscan time analysis (VISTA) method was proposed to investigate the effect of different interscan times on vascular changes in the choriocapillaris of patients with nonexudative AMD and geographic atrophy. The VISTA method calculated the flow signals between sequential OCT B-scans (1 and 2, 2 and 3, 3 and 4, and 4 and 5, where interscan time was approximately 1.5-ms) and between every two B-scans (1 and 3, 2 and 4, and 3 and 5, where interscan time was approximately 3-ms) respectively (Ploner, Moult et al. 2016). Their results demonstrated that VISTA was able to shift the range of the detectable flow speeds. In addition, areas showing low decorrelation flow signal had an increased decorrelation signal when the interscan time increased, especially around the margins of geographic atrophy. Therefore, it further enabled the visualization of varying degrees of choriocapillaris. However, this method still only provides a relative blood flow measurement, and is only applicable to much slower flows, typically < 300-μm/s.
3. Two Dimensional versus Three Dimension OCT Angiography
Color coding and volume rendering are common ways to visualize 3D OCT and OCTA data. The 3D data in an OCTA is typically projected as an en face image of each tissue layer coded with a different color (Figure 2). En face images are comparable to the vantage point of fluorescein angiograms with which clinicians are familiar. The color-coded composite OCTA images provide the additional depth information from the OCTA in a visually appealing manner. Quantitative analysis of blood flow or circulation is performed by measuring 2D metrics, such as skeleton density, vessel density, fractal dimension, vessel diameter index, flow index, and neovascularization area from the en face image of each slab. The 2D en face representation reduces noise and allows clinicians to easily read and analyze OCTA images. However, it requires accurate segmentation of tissue slabs of interest, and may mask underlying capillaries due to projection artifacts. The 2D quantitative metrics derived from en face projection artifacts of the 3D OCTA data inevitably obscure the geometric and topological information in the original 3D vasculature networks.
Figure 2.

Demonstration of various field-of-views in OCTA. (A) 3×3mm2 (B) 6×6mm2 and (C) 8×8mm2 field-of-view pseudocolored OCTA of a normal subject. Red represents superficial retinal layer. Green represents deep retinal layer. Yellow represents regions of overlay. Images are from an AngioPlex™ device (Carl Zeiss Meditec).
Instead of the 2D projection approach, volume rendering has been used to visualize the full 3D information present in the OCTA of human retinal vessels (Makita, Hong et al. 2006, Spaide, Klancnik et al. 2015). Recently, Spaide et al. used volume rendering of OCTA to evaluate the vascular abnormalities associated with macular telangiectasia type 2 (Spaide, Klancnik et al. 2015) and diabetic macular edema (Spaide 2015). This method provides a unique perspective on the relationship between pathologic elements (e.g. intraretinal cystoid spaces) and retinal vessels. However, this method does not allow quantitative analysis of the 3D volume data. Generally, interactive rendering of the large OCTA volume is computationally expensive. In addition, the opacity and color functions in a rendering tool need to be adjusted separately for every dataset and are not easy to optimize, especially for OCTA data which has a considerable amount of noise.
To robustly compute quantitative 3D metrics for the automated analysis of OCTA data in large-scale eye studies, there is a need for 3D algorithms that will reduce motion, projection, and shadow artifacts (Spaide, Fujimoto et al. 2015, Gao, Jia et al. 2016), as well as noise from the OCTA that significantly interferes with interpretation of quantitative results. As discussed above, projection and shadow artifacts produced by superficial vessels are always observed in OCTA, and result in an elongation of the superficial vessels relative to the deeper layers. As discussed in the section on projection artifacts, algorithms have been developed to minimize these artifacts in the deeper retinal layers (Zhang, Zhang et al. 2015, Zhang, Zhang et al. 2015, Zhang, Hwang et al. 2016). Further validation of these methods on larger data sets is warranted before determining its clinical utility. One potential limitation of these methods is that they may not recover small capillaries located underneath larger superficial vessels.
Another challenge to recovery of the small capillaries from OCTA data is the noise present within the original OCTA data. Conventional filtering methods tend to obscure small vessels when they try to suppress the noise in 3D OCTA data. However, there has been little attempt to develop a 3D algorithm that reduces the noise and enhances the small vessels from OCTA. A Hessian-based filter has been used to improve the vasculature visualization, but it has only been applied to 2D en face data (Camino, Zhang et al. 2016). Recently, a model-based filtering approach, using the 3D curvelet transform, was proposed (Shi, Gahm et al. 2017). The key idea is that the curvelet basis functions provide a multi-scale representation of edges and singularities along curve-like structures in 3D images. This matches well with the geometry of retinal vasculature in OCTA images. This approach has been introduced as shown in Figure 3, but its validation with a variety of OCTA data is needed. The curvelet transform has been applied to structural OCT data to reduce the speckle noise (Jian, Yu et al. 2010), but it may be more appropriate when applied to vessel enhancement in OCTA.
Figure 3.

Curvelet-based denoising of OCTA from a normal control (the first row, A–C) and from a patient with diabetic retinopathy (the second row, D–F). The color-coded en face maximum intensity projection of the superficial layer are shown to demonstrate the 3D depth of the retinal vasculature for the original (the first column, A and C) and denoised (the second column, B and E) OCTA. Non-color coded, volume rendered and denoised OCTA using 3D Slicer are shown in the third column (C,F). Color coding in first two columns represents the depth of retinal vessels within the displayed data set for the superficial retinal layer. (Red represents the most superficial, green deeper and blue the deepest capillaries within the superifical retinal layer that is shown). Note that only the superficial retinal layer is shown in this data set so the color coding does not correspond to that in other figures.
4. Commercially Available and Research Based OCTA Devices
There are currently several OCTA devices that are available throughout the world for research use. In the United States and Europe, both Carl Zeiss Meditec (AngioPlex™) and Optovue (AngioVue™) have Food and Drug Administration and Conformite Europeene approvals for clinical use of SD-OCT technology. In addition, Zeiss has an SS-OCTA device (PlexElite™) that is available for sale in the United States and Europe, but this device is limited to research use with IRB approval. Topcon Medical Systems has a SS-OCT device (Triton™ DRI SS-OCT) that is commercially available in Japan, Brazil and England. Most other major OCT manufacturers including Heidelberg, Optopol and Nidek have demonstrated OCTA platforms at major meetings and have these devices available for research use only at specific sites. In the next few years, it is very likely that most manufacturers will have some OCTA enabled platform.
5. Normal Retinal Vascular Anatomy and Physiology
OCTA has been very useful for understanding normative human vascular anatomy and physiology in a way that has not been possible before, due to the invasive nature of FA and the fixation artifacts in post-mortem tissue. In addition, OCTA is not subject to the artifacts of fixation and sectioning that occur in histologic sections. Just as the OCT helped us understand the normal variation in human retinal thickness (Kashani, Zimmer-Galler et al. 2010, Chalam, Bressler et al. 2012), OCTA is helping define the normal variation in retinal vascular anatomy. This understanding is important for interpreting OCTA images with pathology. In this section, we will review several studies that have used OCTA in human subjects for understanding normal human retinal anatomy and physiology. In general, these studies demonstrate that OCTA-based assessment of capillary density and morphology are very similar to histology-based studies, while also providing a wealth of new information. For example, OCTA has enabled several novel studies that assess the correlation of FAZ with foveal pit morphology. As we discuss below, OCTA has also enabled studies of the vascular response to retinal stimulation that were much more technically challenging in the past.
5.1 Normative Retinal Capillary Size, Distribution and Density
A number of pioneering anatomic studies have defined the distribution and the characteristics of retinal capillaries. As mentioned above, Weinhaus et al. did a comparative study of FA and anatomic drawings of retinal vessels from retinal whole mounts of primate retina (Weinhaus, Burke et al. 1995). That study showed that capillary visibility on FA decreased significantly from the edge of the FAZ and reached a low of 40% beyond 900-μm from the foveal center. Interestingly, all of the widest capillary segments, with diameters ranging from 6.1 to 7.0-μm, were visible on FA, but only 43% of capillaries, with diameters ranging from 4.1 to 4.5-μm, were visible on FA. Among capillaries between 4 and 5-μm in diameter, the visibility on FA decreased linearly with increasing depth in the retina. They concluded that capillary visibility on FA is a function of both capillary size and retinal depth (Weinhaus, Burke et al. 1995).
In another study conducted by Snodderly et al, the detailed orientation, size, and distribution of retinal capillaries were described in relation to the neurosensory retinal tissue in whole mounts from macaque retina (Snodderly, Weinhaus et al. 1992). In this study, the retinal capillary circulation was noted to have 4 layers, and it was divided into the superficial or inner “vitread” network and the deep or outer “sclerad” network. The inner network consisted of retinal capillaries that surround and nourish the nerve fiber layer and ganglion cell layers, whereas the deeper retinal capillaries surround the inner nuclear layer. Median capillary diameters are greater in the deeper retinal layers (~5.0-μm) than in the inner retinal layers (~4.5-μm). The thickness of the inner retinal circulation was significantly greater near the optic nerve head than other regions of the retina owing to the increased thickness of the nerve fiber layer. In addition, the authors noted that the capillaries in the nerve fiber layer were oriented parallel to the course of the nerve fibers, whereas the capillaries in the other layers were less regular in their orientation. The excellent spatial resolution and depth-resolved capability of OCTA is demonstrated by the reliable and accurate visualization of these peripapillary vessels as well as the deeper capillaries in living human subjects (Matsunaga, Yi et al. 2014, Spaide, Klancnik Jr et al. 2015, Campbell, Zhang et al. 2017).
Tan et al. demonstrated a correlation of histological measurements from 12 human donor cadaver eyes and speckle variance OCTA (svOCTA) from 14 healthy human eyes. Morphologic features of svOCTA were very similar to histology. Capillary density measures were significantly larger in the svOCTA, except for in the retinal ganglion cell capillaries. Mean age of the control histology group was 39.7±3.6 years, and the mean age of the svOCTA group was 45.6±5.3 years. The mean capillary diameters for all of the capillaries measured were 8.26±0.03μm and 8.8±0.04μm in histology and svOCTA data, respectively. Comparison of individual capillary diameters within individual retinal layers demonstrated that only the capillary diameter of the retinal ganglion cell layer on svOCTA was significantly larger than on histology. In contrast, capillary density was greater on svOCTA than histology for all layers except the retinal ganglion cell layer. For example, the nerve fiber layer mean capillary density, as measured by manual tracing, was 10.2±0.02% in histology and 16.97±0.02% on svOCTA (p=0.044). The inner nuclear layer-outer plexiform capillary density was 16.04±0.01% on histology and 25.61±0.01% on svOCTA (p=0.006) (Tan, Balaratnasingam et al. 2015). The higher density measures on svOCTA in this study may be reflective of projection artifacts that were not accounted for. Nevertheless, similar findings have been reported by Matsunaga et al. using a different intensity-based OCTA algorithm and different segmentation parameters, suggesting that OCTA is generally reliable, but may overestimate capillary density due to imaging artifacts (Matsunaga, Yi et al. 2014). Another OCTA study of 113 eyes of 70 subjects demonstrates that mean capillary density in the superficial and deep capillary layers decreases with age and FAZ area increases with age (Iafe, Phasukkijwatana et al. 2016). In the latter study, the capillary density is reported as the number of capillaries per millimeter, so a direct comparison with percentage measurements from other studies is not possible.
In general, measurements of retinal capillary density ranging from ~30 to 60% have been demonstrated with several different OCTA devices and methods (Matsunaga, Yi et al. 2014, Tan, Balaratnasingam et al. 2015, Lupidi, Coscas et al. 2016). These measurements are in very good agreement with histology-based measures from previous studies (Weinhaus, Burke et al. 1995, Mendis, Balaratnasingam et al. 2010). Higher capillary densities are generally associated with younger age (Wang, Chan et al. 2016). One of the main limitations in these measurements is the un-standardized segmentation and layer definitions, which are used among studies.
5.2 Foveal Pit Morphology and Foveal Avascular Zone (FAZ) Size
The role of the foveal pit and FAZ in vision has been studied extensively. ETDRS Report 11 (1991) demonstrated that intergrader agreement for qualitatively defining FAZ size, shape, and capillary loss within the central 1000-μm was only good on FA (weighted kappa 0.46 to 0.58). The report states that the border of the FAZ typically falls along the boundary of the central circle on the ETDRS grid, suggesting that the average radius is 300-μm. This corresponds to an area of 0.28-mm2 (1991). OCT and OCTA have provided a novel tool for revisiting the changes in the FAZ in health and disease. Previous studies have shown that subjects without a foveal pit can have normal vision, cone density, and multifocal ERG measurements; therefore, the exact role of a foveal pit is still controversial (Marmor, Choi et al. 2008). An OCT-based study of 110 eyes of 57 healthy adults showed a wide variation in the size, depth, and shape of the foveal pit. A limited number of subjects had an incidental FA in the normal contralateral eye, which showed that the edge of the FAZ seemed to correlate to the inner edge of the ganglion cell layer. Lastly, the size of the FAZ was inversely correlated with the central foveal thickness (Tick, Rossant et al. 2011).
An adaptive optics scanning laser ophthalmoscope (AOSLO) study of FAZ size and foveal pit morphology shows an average foveal pit volume of 0.081-mm3 (range 0.022 to 0.190-mm3) and FAZ area ranging from 0.05 to 1.05-mm2 with an average of 0.43±0.25-mm2. There was significant variability in foveal pit morphology among subjects. FAZ area was significantly correlated with foveal pit area (ρ2=0.33, p<0.0001), depth (ρ2=0.29, p<0.0002), and volume (ρ2=0.46, p<0.0001). In general, deeper and larger pits were associated with larger FAZs (Dubis, Hansen et al. 2012). Studies in healthy subjects with FA show mean FAZ ranging from 0.15 to 0.405-mm2 (Mansour, Schachat et al. 1993, Arend, Wolf et al. 1995, Conrath, Giorgi et al. 2005, Samara, Say et al. 2015).
Several studies have utilized OCTA to demonstrate similar or complementary findings. OCTA of 105 healthy Chinese volunteers showed a mean FAZ of 0.35± 0.12-mm2 (Wang, Chan et al. 2016). Studies in healthy subjects with OCTA show FAZ values ranging from 0.25 to 0.30-mm2 in the SRL and up to 0.495-mm2 in the deep retinal layer (DRL) (Kuehlewein, Tepelus et al. 2015, Carpineto, Mastropasqua et al. 2016). In another study, a custom built FD-OCT was used to perform phase variance OCTA on several normal and diabetic subjects. The range of FAZ was from 0.162-mm2 to 0.581-mm2 in the whole population (Kim, Fingler et al. 2012).
Another prospective study of 117 healthy volunteers (234 eyes; mean age 22.5) with 3×3-mm OCTA scans, manually graded for the size of superficial and deep FAZs, showed that the mean superficial FAZ area was 0.24-mm2 (range 0.04 to 0.48-mm2) and that the mean deep FAZ area was 0.38-mm2 (range 0.10 to 0.70-mm2) (Tan, Lim et al. 2016). The average deep FAZ was significantly larger than the mean superficial FAZ by 0.13-mm2 (P<0.001). The mean FAZ measurements between the two eyes of an individual were highly correlated, with mean differences of 0.004 to 0.005-mm2. Full thickness FAZ measurements correlated highly with superficial FAZ measurements, and both shared the same mean of 0.24-mm2. Multivariable linear regression analysis showed that females had larger superficial (0.28-mm2 vs 0.21-mm2; P<0.001) and deep FAZ (0.42 vs 0.35mm2; P<0.001) areas than males. In addition, multivariable analysis showed that superficial and deep FAZ varied with central retinal thickness.
Among subjects with high myopia, both superficial and deep FAZs varied significantly with central retinal thickness, gender, and choroidal thickness (Tan, Lim et al. 2016). Measurements of FAZ area showed excellent intergrader and intragrader reliability at this reading center based study (ICC>0.99 for both). This study shows that there is an inverse correlation between central subfield thickness and FAZ size in any layer and in the full thickness slab. Therefore, a thicker retina corresponds to a smaller FAZ (Tan, Lim et al. 2016). OCTA of subjects with persistent macular-foveal capillaries (anomalous small FAZ) showed that the severity of the abnormally small FAZ anomaly did not correlate with BCVA (Cicinelli, Carnevali et al. 2016).
Another OCTA study of 64 healthy Chinese subjects (121 eyes; mean age 38) was performed to assess the correlation of retinal thickness and retinal perfusion (Yu, Gu et al. 2016). A linear-mixed model corrected for age, spherical error, heart rate, ocular perfusion pressure, and intraocular pressure. This analysis showed that vessel area density correlated with inner retinal thickness (P<0.05) but not full retinal thickness. Also, the area of the manually measured FAZ was negatively correlated with the inner and full retinal thickness (P<0.001). The FAZ was also positively correlated with age (P<0.05). The peripapillary vessel area density was positively correlated with retinal nerve fiber layer thickness (P<0.001). The results show that for each 1 standard deviation decrease in inner retinal thickness, there is a 1.3 to 1.6% decrease in the vessel area density of the corresponding area (Yu, Gu et al. 2016). Interestingly, previous studies either showed a lack of correlation between retinal blood flow velocity and retinal thickness (Burgansky-Eliash, Lowenstein et al. 2013) or a strong correlation (Landa, Jangi et al. 2012). Previous investigators have shown that for each 1 standard deviation decrease in retinal nerve fiber layer thickness, there is a 2.1 to 2.6% decrease in vascular caliber of both retinal arteries and veins (Cheung, Huynh et al. 2008).
Another retrospective OCTA study of 47 eyes from 47 healthy subjects, using the Heidelberg prototype SD-OCTA, found the FAZ area in the superficial and deep capillary plexus to be 0.28±0.11-mm2 and 0.30±0.1-mm2, respectively (Lupidi, Coscas et al. 2016). There was a strong negative correlation between the FAZ area and the central retinal thickness and central retinal volume, in both the superficial capillary plexus (r=0.7, P<0.001) and deep capillary plexus (r=069, P<0.001). There was no statistically significant difference between measures derived from the OCTA scans from the three separate visits. Interestingly, the authors note that in at least 27% of cases, segmentation of the foveal region was not consistent, thus highlighting the importance of reliable segmentation methods. Nevertheless, manual correction of this error resulted in no significant difference between the FAZ of the different capillary plexi (Lupidi, Coscas et al. 2016).
Despite these interesting results, it is worth noting that the FAZ is the result of anatomical fusion of all the capillary layers within the inner retina. Therefore, any segmentation of the foveal and perifoveal capillaries may be largely an artifact of current segmentation algorithms which were not designed with detailed foveal anatomy in mind. For example, one could hypothesize that since Henle’s nerve fiber layer is by definition a prominent component of the foveal photoreceptors and not elsewhere, it is displacing the deep capillary plexus away from the foveal center. This would explain why the FAZ has consistently larger size in the deep retinal plexus. As we learn more about the foveal microcirculation with OCTA, it may be useful to develop a novel segmentation scheme for the FAZ that appropriately accounts for the unique anatomy of its neurosensory and vascular tissue.
5.3 Refractive Error
The impact of refractive error and optical aberration on OCT measurements is well-known and similar aberrations are likely to impact OCTA measurements (Bennett, Rudnicka et al. 1994, Moghimi, Hosseini et al. 2012). This is particularly important to consider in subjects with high myopia. In an OCTA-based study, FAZ area measurements in high myopes (0.28±12-mm2), with spherical equivalent <-5D and without pathologic changes, was not significantly different from controls (0.28±13-mm2), with spherical equivalent >-3D. Retinal vascular density was approximately 3% lower (p<0.05) in myopia than in controls, as measured in concentric annuli around the fovea. Retinal vascular density as measured by fractal analysis negatively correlated with axial length and refractive error. There was no correlation between blood flow velocity and either axial length or refraction. There was also no correlation between vessel density and blood flow velocity. Importantly, this paper corrects for the refractive error influence on the size of retinal features (Li, Yang et al. 2017).
5.4 Radial Peripapillary Capillaries and Retinal Nerve Fiber Layer
One particularly important use of OCTA is to assess the peripapillary radial capillary network that is not visualized on FA at all (Matsunaga, Yi et al. 2014, Spaide, Klancnik Jr et al. 2015). The original description of peripapillary radial capillaries in humans, monkeys, pigs, and cats used India Ink (Henkind 1967) and was also confirmed by histology (Weinhaus, Burke et al. 1995). These lie in a 2D network in the nerve fiber layer and are superficial to the 3D network of capillaries within the inner retina. In humans, these capillaries arise from unique arterioles around the disc and not from vessels within the disc. In general, retinal peripapillary capillaries rarely anastomose (in contrast to other intraretinal capillaries) and are limited in scope to the posterior pole. (Henkind 1967) Elevated intraocular pressure (IOP) decreases or eliminates India Ink filling of peripapillary capillaries in cats in 10/10 animals. This suggests that these capillaries are susceptible to IOP fluctuations (Alterman and Henkind 1968). Comparison of in vivo AOSLO-FA measurements of peripapillary retinal capillaries, retinal nerve fiber layer thickness, and ex vivo measurements in monkey eyes using confocal microscopy and histological sections show that the retinal nerve fiber layer is thicker than the retinal peripapillary capillary layer at all locations measured. The area deep to the retinal nerve fiber layer showed a similar network of capillaries as reported in the macula. In vivo AOSLO-FA and ex vivo confocal measurements agreed well (Scoles, Gray et al. 2009).
Several OCTA studies have revisited imaging the peripapillary plexus because direct visualization of this layer in human subjects could have an impact on the diagnosis and management of diseases, such as glaucoma which primarily affect the retinal nerve fiber layer. In one OCTA study, a montage of 3×3-mm2 OCTA images of 20 eyes from 20 healthy subjects was performed to assess the peripapillary capillary density and its correlation with retinal nerve fiber layer thickness. It was noted that the resolution from 6×6-mm2 and 8×8-mm2 scans was insufficient to visualize retinal peripapillary capillaries. Manual segmentation was used to define the radial peripapillary capillary plexus to the temporal macula. The study noted that segmentation depth of the retinal peripapillary plexus decreased with increasing distance from optic disc edge (range 78±8-μm next to disc to ~36±3-μm in superior or inferior macula). Radial peripapillary capillary plexus density measurements were made in 0.5×0.5-mm2 sample regions from binarized and skeletonized manually segmented images. The retinal peripapillary capillary density was 13.6±0.8, 11.9±0.9, 10.4±0.0 per mm2 at 0.5, 2.5 and 5-mm2 from the optic disc edge, respectively. The density significantly decreased with increasing eccentricity from the disc (P<0.0001). The capillary density was also significantly and proportionally correlated with retinal nerve fiber layer thickness (r=0.64, P<0.0001) (Mase, Ishibazawa et al. 2016).
5.5 Retinal Blood Flow and Velocity
As mentioned in the section above, OCTA is based on the motion of particulate material within the retina. In most cases, the particulate material consists of RBCs within the retinal vessels. However, the presence of leukocytes and RBC aggregates may also contribute to the signal. Previous studies have suggested that the velocity of RBCs and leukocytes may vary, but it is not clear if the difference is truly physiological or merely an artifact of the measurement methods (Arend, Harris et al. 1995). OCTA provides a direct measure of particulate movement and provides a promising method for assessing retinal blood movement. However, technical challenges still remain in understanding the actual basis of the OCTA signal. As a result, current commercial OCTA devices do not provide any validated quantitative information about blood flow. Rather, OCTA images are used as a static map of the vascular network with the understanding that any regions with flow above or below the threshold sensitivity may be undetected. In most cases, the clinical significance of this is relevant at very slow flow rates, which may lead to erroneous appearance of regions with “nonperfusion”.
In order to understand the limitations of OCTA in detecting flow, a few simple calculations can be made. Capillary blood flow is on the order of 1.5 to 3-mm per second, so a RBC will move about 1500 to 3000μm in 1-second. Most commercial OCT devices scan between 50 to 100-kHz. Assuming a 70-kHz scan rate, a 3×3-mm2 size field, 300 A-scans per B-scan, and 300 B-scans per image the following calculation apply. Each A-scan and B-scan is 0.010-mms (10μm) apart. At 70-kHz, it takes 0.005-seconds to acquire one B-scan. Each B-scan needs to be repeated at least twice, so at least 0.010-seconds is needed at each position. Theoretically, this complete scan will take between 3 to 4-seconds. The fastest that a RBC can move and still be detected by this OCTA scan is 300-mm/s. This upper limit of detection is not likely a problem in detecting high flow rates because capillary blood does not move this fast. However, the slowest a RBC can move and still be detected is limited by the background noise. In addition, the average length of the cardiac cycle, assuming a heart rate of 75-bpm, is ~0.8-seconds. Approximately 0.25-seconds is occupied in systole and 0.55-seconds is occupied in diastole. Consequently, the likelihood of scanning two times during diastole is much higher than once in systole and once in diastole. Therefore, gating the OCTA to heart beat may be necessary in future studies to ensure accurate measurements. However, the impact of the cardiac cycle may be minimized by the fact that capillary flow is fairly constant.
Nevertheless, custom OCTA algorithms and devices have been used to examine the blood flow changes in retinal layers during flicker stimulation. These studies show preferential changes in the plexiform layers presumably due to the increased metabolic demand from synaptic activity (Son, Wang et al. 2016). With an experimental OCTA-based parafoveal flow index and a SS-OCTA device, flicker stimulation of the retina seems to increase the parafoveal blood flow by a modest, but significant amount (~6%) (Wei, Jia et al. 2013). Hyperoxia seems to decrease blood flow and vessel density on OCTA by a modest amount (~9% and ~3% respectively) in human subjects as well (Pechauer, Huang et al. 2015). This is consistent with other studies showing OCTA of 10 eyes from 10 healthy Chinese subjects with autoregulatory response to hyperoxia. In this study, after breathing 80% oxygen for 5-minutes, the perfused vessel densities in the perifoveal, parafoveal, and peripapillary regions decreased significantly by 15.17%, 13.66%, and 9.52%, respectively. The decrease in the peripapillary region was significantly different from the decrease in the other regions (P<0.05 for both). The decrease in perfusion density was reversible after breathing room-air for 5-minutes (Xu, Deng et al. 2016). Similar findings have been described by laser Doppler velocimetry (Riva, Grunwald et al. 1983, Tomic, Bjärnhall et al. 2005).
As we mention above, the fastest that a RBC can move and still be detected by this OCTA scan is 300-mm/s. This upper limit of detection is not likely a problem in detecting flow rates in retinal capillaries but it may be a problem in detecting flow in the choroid and choriocapillaris. Choroidal blood flow velocity has been characterized in a relative manner by previous studies using laser Doppler and laser speckle flowgraphy methods but absolute measurements are lacking (Riva CE, Cranston SD et al., IOVS 1994; Hirooka K, Saito W et al., BMC Ophthalmol 2014). Due to the high reflectance and scattering properties of the RPE it is very challenging to reliably image the choroidal and choriocapillaris circulation in general. Therefore, accurate measurements of flow velocity are likely not feasible with current devices. Adoption of swept-source instruments with longer wavelength may allow advances in this area.
6. Segmentation Methods and Retinal Layer Designation
One of the key variables in the analysis of OCTA images is the method by which the layers are segmented and how predefined retinal layers are assigned to the “superficial” and “deep” retinal slabs. As we emphasized in several sections above, the segmentation methods are not standardized among studies and commercial devices, and even the same segmentation method can be prone to unpredictable errors in the setting of normal anatomic variation or pathologic changes. Standardization of segmentation methods would significantly improve the clinical applications of OCTA and a few studies have attempted to develop a general segmentation scheme. For example, Campbell et al recently described a detailed segmentation scheme with 2–4 distinct vascular plexi depending on the region of retina being studied (Campbell, Zhang et al. 2017). In any case, it is important to understand the differences in the segmentation methods between any two OCTA studies and a brief discussion of this is provided below before further continuing the discussion of clinical studies.
In most cases, commercial software has been designed to separate the retinal vasculature into a “superficial” and “deep” slab. The software predefines the retinal layers that are included in these retinal slabs and that are used for the output images. The user has little input in this decision and re-segmenting the retinal layers is a laborious and often impossible task without custom analysis software. The segmentation scheme in any study can vary from another and users should be aware that even the commercial systems have significant differences from one another that may or may not be clinically significant. Below, we review the segmentation schemes used by the two SD-OCTA systems commercially available in the United States. In many studies, investigators may have redefined these boundaries; therefore, particular attention should be directed towards the detailed methods of all studies to understand how the segmentation scheme impacts the results. Constant software upgrades also may change these definitions since the writing of this review.
In general, the studies that use the OptoVue AngioVue™ systems designate the vasculature as either superficial or deep plexus depending on the layer boundaries. The superficial slab or “plexus” is located between the inner limiting membrane (ILM) and the posterior boundary of the inner plexiform layer (IPL). The deep “plexus” is defined by the capillaries between the posterior boundary of the IPL and the posterior boundary of the outer plexiform layer (OPL). Similarly the choriocapillaris is defined as a layer of capillaries in a 30-μm thick section located immediately posterior to the RPE (Agemy, Scripsema et al. 2015).
The segmentation scheme on the Zeiss AngioPlex™ system defines three retinal slabs corresponding to the superficial, deep, and avascular retinal slabs. The superficial slab consists of 60% of the retinal depth from the ILM to 110-μm above the RPE. This junction is approximately at the anterior boundary of the IPL. The deep retinal slab consists of the remaining 40% of the retinal depth, which is approximately the posterior IPL boundary to the anterior edge of the ONL. The avascular layer extends from 110-μm above the RPE to the external limiting membrane (ELM) (Kim, Chu et al. 2016, Kim, Rodger et al. 2016).
The definition of retinal layers changes slightly when looking at the peripapillary retina. OptoVue AngioVue™ systems provide various definitions of the peripapillary superficial retinal slab: the slab extending 52-μm from the ILM, or the slab between ILM and the outer boundary of retinal nerve fiber layer (the RNFL slab, software version 2015.1.0.90) (Yarmohammadi, Zangwill et al. 2016). The segmentation scheme for peripapillary retina remains similar on the Zeiss AngioPlex™ system. With self-developed automatic, semi-, or manual segmentation software, it is possible to precisely segment out the RNFL or the retinal layer containing the small branches of the retinal arterioles and venules to investigate the radial peripapillary capillaries (Chen, Zhang et al. 2016, Mase, Ishibazawa et al. 2016).
Although no systematic studies comparing different segmentation strategies have been performed, the difference between these two segmentation schemes (and others) is not likely to be significant when retinal anatomy is normal. However, there can be significant differences in abnormal cases where macular edema or inner retinal atrophy are present. The exact nature of the differences has not been studied, and since the details of the segmentation algorithms are proprietary, it is not possible to speculate on how each may respond to different pathologic cases.
7. OCTA, Fluorescein Angiography (FA) and Indocyanine Green Angiography (ICG) in the Clinical Management of Retinal Vascular Disease
One of the most commonly asked questions after the FDA approval of OCTA has been, “When is it appropriate to use FA or ICG and when is appropriate to use OCTA?” In order to address this question, we need to revisit the fundamental basis of FA, ICG, and OCTA imaging methods as well as the strengths and limitations of each method. We will then consider the current role of OCTA keeping in mind that this role is rapidly evolving as we learn more and as it is steadily improved by software and hardware modifications.
7.1 Fluorescein Angiography (FA)
Since Novotny and Alvis first described intravenous injection of fluorescein dye in a human and simultaneous fundus imaging with custom filters in 1961, it has become the mainstay of assessment for retinal vascular health and disease (NOVOTNY and ALVIS 1961). FA has been used extensively to identify normal flow patterns as well as to demonstrate abnormal vessels such as choroidal and retinal neovascularization. FA has also been used to measure blood flow in a quantitative way using video rate imaging methods (Bursell, Clermont et al. 1996). There is no doubt that FA has been an indispensable tool for diagnosis of retinal vascular changes and disease. Nevertheless, the limitations of FA are that it requires an invasive dye injection with a limited “transit window”, which can make imaging challenging and suboptimal in subsequent frames. More importantly, recent evidence has clearly demonstrated that even under ideal circumstances FA has limited resolution compared to histology and may be significantly underestimating vascular features of the retina. One estimate suggests that FA assessment of capillary density is ~50% less than histology-based assessments (Mendis, Balaratnasingam et al. 2010). Matsunaga et al. (Matsunaga, Yi et al. 2014) and Spaide et al. (Spaide, Klancnik Jr et al. 2015) have shown that OCTA clearly and reliably demonstrates the radial peripapillary plexus, whereas Spaide et al. and others have shown that FA does not (Spaide, Klancnik Jr et al. 2015).
A study conducted by Weinhaus et al. in primates showed that while FA can delineate the FAZ very well, less than 40% of the retinal vasculature, beyond 900μm from the foveal center, is visualized on FA as compared to histology of the same animal post-mortem (Weinhaus, Burke et al. 1995). These studies strongly suggest that the appearance of “nonperfusion” or impaired capillary perfusion in humans is a relatively late finding on FA. It is very likely that a significant amount of impaired perfusion is not detectable on FA. This may underlie the reason why there is a long period of subclinical DR that is essentially without clinical or angiographic findings in DR. Similarly, the sensitivity of FA for choroidal neovascularization is not nearly perfect compared to ICG (Pece, Sannace et al. 2005). We will discuss ICG in further detail below.
A notable strength and limitation of FA is that fluorescein dye leaks out of retinal vessels. This helps identify abnormal vessels but also increases the background signal in later frames and obscures other potentially relevant details. Nevertheless, leakage helps identify very important details such as neovascularization, edema, and otherwise abnormal vessels. This has been a unique and useful feature of FA, even in the era of OCT. Although OCT does not demonstrate leakage, it should be noted that qualitative OCT findings of retinal edema correlate reasonably well with FA leakage in DR (Danis, Scott et al. 2010) and AMD. For example, a retrospective study comparing SD-OCT and FA images from 93 eyes of 93 patients with history of neovascular AMD and anti-VEGF treatment showed significant correlation between SD-OCT findings of retinal edema and FA leakage. Specifically, there was a statistically significant association between SD-OCT findings of any retinal edema, neurosensory detachment, intraretinal flecks, and low reflectivity from subretinal material and FA leakage. There was not a significant association with pigment epithelial detachment or intraretinal fluid. SD-OCT findings of any fluid was 94% sensitive and 24% specific for FA leakage from CNV (Giani, Luiselli et al. 2011).
In diabetic subjects, the presence of cystoid spaces on OCT is highly predictive of fluorescein staining. There also appears to be some relationship between the reflectivity of the cystoid spaces on OCT and the severity of fluorescein pooling, although this is still a subjective measurement (Horii T, Murakami T et al., Ophthalmology 2012). The severity of retinal edema on OCT correlates with the severity of leakage on FA in diabetic macular edema. Importantly, loss of inner retinal layers on OCT correlates with capillary nonperfusion on FA (Yeung, Lima et al. 2009).
Perhaps, the most important limitation of FA is the possibility of minor and severe adverse reactions. Side effects are reported in ~5% of cases with intravenous sodium fluorescein administration. Most side-effects are mild, including nausea, vomiting, sneezing, and pruritis. In more rare cases, side-effects can include severe reactions, such as syncope, local tissue necrosis, thrombophlebitis and local skin eruptions at the injections site (Kwiterovich, Maguire et al. 1991). The mortality rate for FA has been estimated at 1 in 220000 due to causes, such as cardiovascular shock, myocardial infarction, laryngeal edema, and bronchospasm (Yannuzzi, Rohrer et al. 1986). Skin testing suggests some or many of these reactions may be IgE mediated mechanism (López-Sáez, Ordoqui et al. 1998).
Oral use of FA (10-ml of sodium fluorescein with 4-grams of sugar) has been shown to be another possible, although inferior, method of visualizing the retinal vasculature. In many cases, this method takes over 1-hour, and still has the potential of eliciting mild to severe systemic side-effects. In one study, investigators systematically used hypodermic injections of 2-ml of 0.5% dexamethasone sodium phosphate and 2-ml of 0.5% metoclopramide 15-minutes before the sodium fluorescein ingestion to mitigate against side-effects. In ~3% of all cases, usable images were not obtained (Gómez-Ulla, Gutiérrez et al. 1991, Hara and Inami 1998). Nevertheless, oral FA administration with use of confocal laser scanning ophthalmoscope demonstrate quality similar to conventional intravenous angiogram in 47% of cases with visualization of the FAZ (Garcia, Rivero et al. 1999).
7.2 Indocyanine Green Angiography (ICG)
Originally described by Yannuzzi et al. (Yannuzzi, Slakter et al. 1992), ICG aided in visualizing lesions with recurrent choroidal neovascularization (Reichel, Pollock et al. 1995), occult choroidal neovascularization (Guyer, Yannuzzi et al. 1994), and choroidal neovascularization complicated with subretinal hemorrhage (Reichel, Duker et al. 1995). In many ways, the strengths and limitations of ICG, as they relate to OCTA, are similar to FA, with the notable exceptions that ICG has a longer emission wavelength, and it is ~98% bound to albumin (Hope-Ross, Yannuzzi et al. 1994). The longer emission wavelength allows improved visualization of deeper structures. The higher fraction of albumin-bound dye decreases the “leakage” of the ICG dye and improves the signal-to-noise ratio. Both of these features make it more amenable to imaging the choroidal vasculature and choroidal neovascularization. Nevertheless, at least 11% of subjects with occult CNV demonstrate intraretinal leakage of ICG dye that may obscure CNV features or retinal features. For example, the presence of subretinal fluid, subretinal hemorrhage, subretinal lipid, and retinal pigment epithelial detachment are associated with ICG leakage into the retina in subjects with occult choroidal neovascularization (Ho, Yannuzzi et al. 1994). Severe adverse reactions to ICG have also been documented, especially for those with Iodine allergies (Benya, Quintana et al. 1989, Hope-Ross, Yannuzzi et al. 1994). A recent and detailed review of ICG angiography is available for readers with further interest in this subject (Yannuzzi 2011).
7.3 Practical Applications of OCTA Today
Above, we highlighted the strengths and limitations of FA and ICG, and these observations help define situations where the use of OCTA is clearly warranted and those in which it is optional. First, any individual with a known allergy to fluorescein sodium dye or indocyanine green dye would clearly benefit from OCTA imaging, rather than not being imaged at all. In addition, subjects with relative contraindications to FA or ICG would benefit from OCTA as well including: (1) pregnant subjects, (2) breast-feeding subjects, (3) subjects with severe kidney disease, and (4) subjects with poor or impossible intravenous access. In all of these cases, the physician should keep in mind that OCTA is limited to imaging the vasculature of the macula and peripheral pathology needs to be assessed clinically. In some cases, directed OCTA of peripheral pathology is possible and useful as well (Lang, Cakir et al. 2016). Nevertheless, in most cases clinicians and researchers are still learning how and when to apply OCTA to clinical situations, so a conservative approach to the use of OCTA is warranted when making treatment decisions.
We also suggest that OCTA is useful and practical in regular assessment of macular complications of retinal vascular disease that do not warrant FA or ICG, or for which frequent FA or ICG exams are not practical. In diseases such as DR, AMD, and retinal vein occlusion (RVO) the need for monthly examinations and treatment is critical, but FA and ICG are impractical at that frequency. In most cases, the accepted standard-of-care in the management of those diseases is to “interpolate” the status of the retinal vasculature between semiannual or annual FA or ICG examinations. In many cases, FA and ICG are not performed to confirm the presence or absence of neovascularization and the activity of the disease is inferred by secondary findings, such as intraretinal fluid or subretinal fluid. While this strategy works well for many cases, it is suboptimal because the actual cause of the disease process is not directly visualized or quantified.
In contrast to FA and ICG, OCTA can be performed as regularly as OCT and can provide frequency of information that was not available in the past. For example, one practical application of OCTA is to assess the real-time changes in retinal capillary perfusion or choroidal neovascularization during anti-VEGF treatment. A few notable studies have suggested that capillary reperfusion occurs in subjects with DR (Campochiaro, Wykoff et al. 2014) and RVO (Sophie, Hafiz et al. 2013), who are undergoing anti-VEGF treatment. Regression of choroidal neovascularization in real-time with anti-VEGF treatment has also been documented (Huang, Jia et al. 0002). OCTA presents a safe, powerful, and feasible method of assessing these phenomena in more detail and with less risk than either FA or ICG. It should be emphasized again that clinicians are still learning how and when to use OCTA in clinical settings so a conservative approach to using OCTA for treatment decisions is warranted.
When considering whether to use OCTA, FA, or ICG it is important to keep in mind that OCTA measures different biologic phenomena than FA or ICG. As discussed in detail above, OCTA is based on light scattering from RBCs and particulate debris; therefore, there is no “leakage” of dye on OCTA. In contrast, FA and ICG are based on the tissue distribution and fluorescence of molecules that are not strictly confined to vessels, even in normal subjects. Thus, as far as we know, OCTA cannot identify abnormal vascular permeability like FA. One clear manifestation of this difference is revealed in how microaneurysms appear on FA and OCTA. Matsunaga et al. and others have shown that microaneurysms are not detected as frequently on OCTA as on FA (Matsunaga, Yi et al. 2015). The likely reason for this is that some microaneurysms may be sclerosed or clotted without blood flow, while others are patent. Since OCTA only detects movement of RBCs, sclerosed or clotted microaneurysms will not appear on OCTA, but may still stain with dye. Even though OCTA cannot detect leakage, it can detect some instances of macular edema that we describe further below.
In contrast to FA, the ability of OCTA to reliably resolve capillary level detail with unprecedented depth resolution has been demonstrated in humans (Matsunaga, Yi et al. 2014, Spaide, Klancnik Jr et al. 2015, Hwang, Zhang et al. 2016). OCTA images demonstrate capillary detail that approaches the resolution of histological studies on human cadaver eyes (Mendis, Balaratnasingam et al. 2010, Matsunaga, Yi et al. 2014, Spaide, Klancnik Jr et al. 2015, Tan, Balaratnasingam et al. 2015). As a result, numerous studies have suggested that OCTA images are at least equal to FA for detecting macular complications of retinal vascular diseases, including DR (Ishibazawa, Nagaoka et al. 2015, Matsunaga, Yi et al. 2015, Hwang, Zhang et al. 2016), RVO (Kashani, Lee et al. 2015, Casselholmde Salles, Kvanta et al. 2016), AMD (Coscas, Lupidi et al. 0002, Moult, Choi et al. 2014, PhD, Md et al. 2014), and macular telangiectasia (Thorell, Zhang et al. 2014) among others. It is well established that OCTA can detect areas of impaired perfusion (a.k.a. “nonperfusion”) in both the superficial and deep capillary plexi, whereas FA cannot resolve the deep capillary plexus at all (Figure 4) (Weinhaus, Burke et al. 1995, Spaide, Klancnik Jr et al. 2015). Therefore, OCTA provides a whole new dimension of depth information regarding the severity of impaired perfusion that we did not have with the FA. The clinical relevance of this additional information remains to be determined, but at the least OCTA will allow us to assess the severity of ischemia with much more precision. For example, OCTA has already been used to study diseases that are thought to primarily affect the DRL, such as paracentral acute maculopathy (Nemiroff, Kuehlewein et al. 2016) and DR (Kim, Chu et al. 2016).
Figure 4.

Fluorescein angiogram and corresponding OCT and OCTA images of subject with mild-moderate nonproliferative diabetic retinopathy on clinical exam. (A) Fluorescein angiogram in the late phase shows an area of hypofluorescence that is consistent with impaired perfusion. The white dotted lines represent the area of the FA shown in the OCTA image in the last panel. (B1) An B-scan from the OCTA dataset through the superior macula showing a small area of intraretinal fluid. (B2) An B-scan through the fovea. (C) OCTA corresponding to the area of the white-dotted box in panel (A). There are clear areas of impaired perfusion on the OCTA. The dotted lines represent the location of the B-scans in panel B.
OCTA can also detect intraretinal (intraretinal microvascular anomalies, IRMA) and extraretinal neovascularization (neovascularization of the disc or elsewhere, NVD or NVE) with excellent reliability as long as the pathology is within the field-of-view (Figure 5) (Ishibazawa, Nagaoka et al. 2015, Matsunaga, Yi et al. 2015, de Carlo, Bonini Filho et al. 2016). Accordingly, one of the main limitations of OCTA is the field-of-view, though this is rapidly improving. Commercially available devices have several field-of-view options, including 3×3-mm2, 6×6-mm2, and 8×8-mm2 (Figure 2). It is very likely that larger fields will be available shortly. In most cases, as the field-of-view increases in size, the resolution of the scan decreases because the same number of A-scans are being used to scan a larger area. Nevertheless, the standard scan patterns on current SD-OCT devices are sufficient to detect clinically relevant pathologic changes in DR and RVO (Hwang, Jia et al. 2015, Kashani, Lee et al. 2015, Matsunaga, Yi et al. 2015, Kim, Chu et al. 2016). The bottom line is that physicians still need to perform wide-field FA to detect extramacular lesions, including neovascularization and peripheral nonperfusion in DR. Follow-up examinations for assessing macular ischemia can be done with OCTA.
Figure 5.
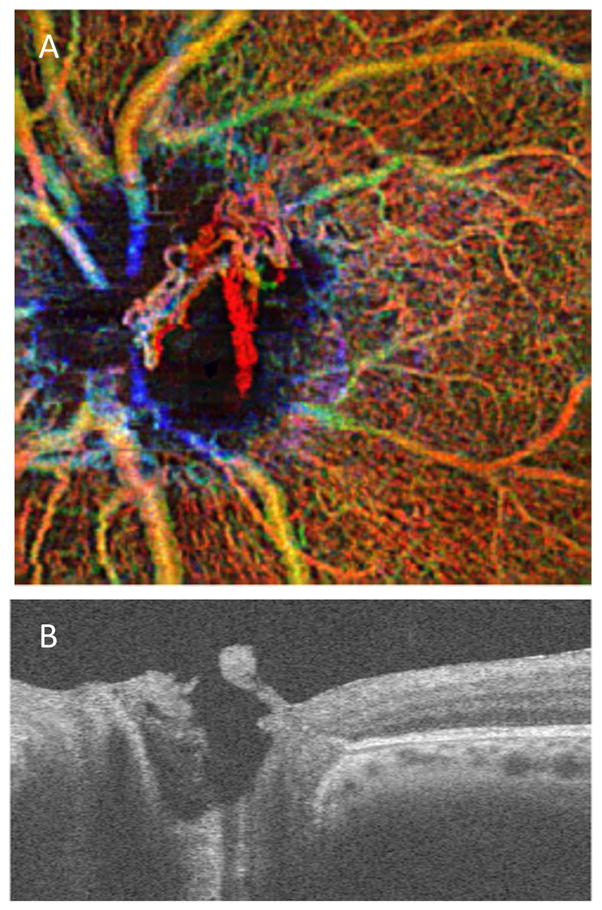
OCTA of subject with proliferative diabetic retinopathy and neovascularization of the disc. (A) Depth encoded OCTA of optic nerve head demonstrates a significant area of superifical (red) OCTA signal corresponding to the neovascularziation above the disc on the (B) B-scan. Red represents superficial retinal layer. In this case the neovascularization is red because it is in the vitreous and above the superficial retinal layer. Green represents DRL. Yellow represents regions of overlay.
OCTA can demonstrate novel pathologic features that do not correlate with features on FA or OCT. For example, certain types of intraretinal edema are detected very well on OCTA, but these regions do not correlate with typical intraretinal fluid pockets on OCT or late staining regions on fluorescein angiograms (Figure 6) (Kashani, Lee et al. 2015, Matsunaga, Yi et al. 2015). This finding has been demonstrated by our group in both DR (Matsunaga, Yi et al. 2015) and RVO (Kashani, Lee et al. 2015), and it is the subject of current ongoing studies. It has been postulated that this finding occurs because even trace amounts of small light-scattering particles (lipid and extracellular protein deposits such as hard exudates) within retinal tissue can generate an OCTA signal from Brownian-like motion. This finding is appropriately called small light-scattering particles in motion or SPPiM. We demonstrate SPPiM findings in DR (Figure 6) and AMD (Figure 10). The clinical significance of SPPiM is not yet clear, but this is the subject of ongoing investigation.
Figure 6.

Images from a subject with severe nonproliferative diabetic retinopathy and macular edema. (A) Color fundus image shows diffuse areas of hard exudate and intraretinal hemorrhage. (B) Fluorescein angiogram shows numerous microaneurysms but no clear leakage or diabetic macular edema in mid to late frames. (C) OCTA of the central 3×3mm2 shows irregularities in the capillary network and foveal avascular zone as well as an area of increased OCTA signal covering the majority of the fovea (red). This area corresponds to the area of hyperreflective cystoid change seen in (D) B-scan cross section through the fovea. Note the hard exudates on the OCT B-scan. The appearance of the OCTA hyperreflectivity is subjectively correlated with presence of hard exudates in at least some cases and referred to as small scattering particles in motion or SPPiM
Figure 10.

OCTA of subjects with various types of choroidal neovascularization (CNV). (A1–4) Type 1 macular neovascularization. (A1) The CNV is shown by the en face OCTA slab with the inner boundary as the retinal pigment epithelium (RPE) line and the outer boundary as the RPE-fit line (Bruch’s membrane). (A2) The en face structural image shows intensity variations within the slab. (A3–4) Corresponding B-scans with the slab segmentations lines, with and without the flow signal. Note that the lesion is located below the RPE and above Bruch’s membrane. (B1–4) Type 2 macular neovascularization. (B1) The CNV is shown by the en face OCTA slab with the inner boundary defined by from the outer plexiform layer and the outer boundary located at 37 μm under Bruch’s membrane. (B2) The en face structural image shows intensity variations within the slab. (B3–4) Corresponding B-scans with the slab segmentations lines, with and without the flow signal. Note that the lesion is located above the RPE. (C1–4) Type 3 macular neovascularization (retinal angiomatous proliferation). (C1) Depth encoded en face OCTA slab shows a bright green focal lesion just superior to the fovea. There are focal areas with a poorly defined flow signal that represent suspended scattering particles in motion (SSPiM) associated with cystic intraretinal cavities (arrow). (C2) The en face structural image demonstrates hyporeflective cystic spaces consistent with the intraretinal fluid. (C3–4) Corresponding B-scans with the slab segmentations lines, with and without the flow signal. Note that the neovascular flow lesion is located within the retina along with areas of SSPIM.
Another novel finding on OCTA is sub-clinical vascular changes that are noted in subjects with minimal DR (Figure 7). We have observed many subjects with excellent vision and sub-clinical variations in the appearance of macular capillaries (unpublished observations). The clinical significance of these variations is not known, but it is possible that OCTA is detecting vascular changes before a clinically detectable disease has occurred. If this were shown to be the case, then OCTA could be a very powerful tool for detecting DR before clinically evident changes occur.
Figure 7.

Images from an asymptomatic subject with minimal nonproliferative diabetic retinopathy and 20/20 vision. (A) Color fundus photograph, (B) Depth-encoded OCTA shows an irregular foveal avascular zone and some pockets of mild impaired capillary perfusion in the periphery of the images. These findings were not visible on clinical exam or other imaging modalities. (C) B-scan through the fovea shows no intraretinal fluid.
As mentioned previously, microaneurysms have been demonstrated on OCTA, but are not identified as frequently as in FA (Ishibazawa, Nagaoka et al. 2015, Matsunaga, Yi et al. 2015). It is possible that this is because microaneurysms have a life-cycle. In addition, histology studies have shown that microaneurysms can be patent, clotted, or sclerosed. Therefore, any microaneurysm that doesn’t have blood flow (e.g. sclerosed) is unlikely to show up on an OCTA scan, but will still stain with fluorescein dye. Also, the flow rate of blood in microaneurysms can vary and may be below the threshold of detection for current OCTA devices. In general, users should be aware that regions that lack OCTA signal may have blood flow that is too slow for the OCTA to detect. Currently, it is not known what the threshold flow rate for detection of blood flow is using SD-OCTA. OCTA may allow us to revisit the relevance of microaneurysms in diabetic macular edema with additional studies, but it is likely that additional improvements on OCTA hardware and software will be necessary for this. For example, using variable interscan intervals (VISTA) during the acquisition for OCTA images allows measurement of a relative blood flow in DR (Ploner, Moult et al. 2016) and AMD (Choi, Moult et al. 2015). At this time, VISTA is only possible with the very high scan speeds (400-KHz) of a prototype SS-OCT instrument using a vertical cavity surface emitting laser (VCSEL). These studies utilizing VISTA do show modest differences in the apparent blood flow of pathologic regions, such as microaneurysms and choriocapillaris surrounding geographic atrophy.
OCTA images generally do not show hyporeflective intraretinal fluid pockets that are typically seen in diseases with macular edema. However, since OCTA images are always accompanied by structural OCT scans this is not an issue. Physicians can use OCTA in conjunction with structural OCT to detect intraretinal fluid (just as they do with standard OCT scans). In some cases, OCTA can detect hyperreflective fluid pockets, and as we mentioned above, this is an area of ongoing study. The additional time it takes to perform an OCTA scan is negligible and viewing the OCT concurrently with the OCTA also takes marginally more effort than viewing the OCT by itself. In some cases, OCTA images are not necessarily easy to interpret and are also not currently reimbursed. The lack of reimbursement is certainly a problem that needs to be addressed in the medium- or long-term, but the growing capabilities of OCTA will probably encourage its adoption for clinical efficiency (OCTA is faster than an FA all other factors being equal) rather than as a new source of revenue in the short-term.
Some of the key differences between FA-based retinal angiography and OCTA have been well illustrated in a study comparing adaptive optics scanning laser ophthalmoscopy-based FA (AOSLO-FA) and OCTA. In a study of 11 vasculopathic patients and 4 healthy controls, the authors compared the images generated by the high-resolution AOSLO-FA system with those generated by the OCTA from the same retinal regions. Mean foveal avascular zone area on AOSLO-FA and OCTA were similar at 0.378±0.245-mm2 and 0.384±0.249-mm2, respectively, but were statistically different (P=0.004). It is unlikely that the small magnitude of this difference has any clinical relevance. Mean vessel density on AOSLO-FA and OCTA, within the 300-micron region of interest, were not found to be significantly different. This reinforces the earlier observations that OCTA seems to provide very accurate, high-resolution images of the retinal capillaries, with near histology-level resolution and without the need for dye injection.
However, there were some key differences between the AOSLO-FA and OCTA, which highlight the strengths and weaknesses of OCTA. Capillary lumen diameters were significantly larger on OCTA than on AOSLO-FA (14.2±6.3-μm vs 19.9±5.9-μm respectively; P<0.001). This was attributed to the lower lateral resolution of OCTA. Also, OCTA images did not demonstrate vessel segments in some cases where AOSLO-FA clearly did show vessel segments. As mentioned above, this was probably attributed to the fact that OCTA has a threshold sensitivity to flow ~0.3-mm/sec, below which flow is not detected (Tokayer, Jia et al. 2013). In addition, microaneurysms either appeared very differently or, as evident in many cases, were completely missing on OCTA as compared to AOSLO-FA, likely due to the same reason (Mo, Krawitz et al. 2016). Matsunaga et al. also noted that microaneurysms that do appear on OCTA are often not the same shape or size as those on FA (Matsunaga, Yi et al. 2015). This could be explained by the fact that the region of a microaneurysm which has RBC flow may only be a small portion of the whole microaneurysm. Histology of cadaver eyes show that microaneurysms can have recanalized segments, which support RBC flow even though the majority of any given microaneurysm is sclerosed (Stitt, Gardiner et al. 1995).
OCTA is more useful than FA or ICG in evaluating subretinal hypereflective material (SHRM) for neovascular activity. SHRM is a generic term applied to material in the subretinal space that includes Type 2 choroidal neovascularization, fibrosis, exudation, vitelliform material, and hemorrhage. In some cases, SHRM regresses with anti-VEGF therapy, and in others, it does not (Willoughby, Ying et al. 2015). Distinguishing between the vascular and avascular components of SHRM is difficult on structural OCT. In most cases, FA and ICG tend to demonstrate non-specific diffuse staining patterns and are often considered to be not helpful. The utility of OCTA in assessing SHRM was explored in 33 eyes of 25 subjects with mean age of 76 years and a range of retinal diagnoses (Dansingani, Tan et al. 2016). This qualitative study showed that it was possible to use OCTA to detect neovascularization within SHRM lesions. However, this required a significant amount of manual segmentation and reading effort. The authors also suggest that SHRM lesions vary in their optical properties and are differentially susceptible to projection artifacts. For example, the authors show that smooth surfaces and hypereflective SHRM lesions are more prone to projection artifacts than irregular contours and hyporeflective lesions. The application of OCTA in clinical cases that include neovascular, myopic choroidal neovascularization, and vitelliform lesions demonstrates the novel practical applications of OCTA that were either not possible with FA and ICG or are now significantly better with OCTA (Dansingani, Tan et al. 2016). While these OCTA applications are currently labor-intensive, it is likely that rapid advancements in OCTA technology will overcome most of these problems and allow for clinical adoption.
There is mounting evidence that one of the most important applications of OCTA will be detecting subclinical changes or, more accurately, quantifying milder stages of DR, where FA is absolutely not indicated or useful (de Carlo, Chin et al. 2015). For example, in subjects with mild NPDR and no macular edema, a FA is not indicated. However, it is clear from epidemiologic, pathologic, and clinical studies that microvascular changes are present at that stage of disease beyond what is detected on clinical examination (de Carlo, Chin et al. 2015). The non-invasive nature of OCTA makes it possible to image patients without posing a significant risk. Our group and others have observed that subtle, sub-clinical OCTA changes in this patient population are not uncommon (Kashani AH unpublished observations). Comprehensive quantitative metrics will be needed to objectively capture these subtle changes and provide evidence of DR severity. Several studies show that OCTA-based metrics of capillary density, branching complexity, and capillary diameter correlate well with the clinical severity of DR (Agemy, Scripsema et al. 0002, Kim, Chu et al. 2016), RVO (Koulisis, Kim et al. 2016), and some of the clinical features of uveitis (Kim, Rodger et al. 2016). Larger scale studies are underway. These studies are aimed at determining whether OCTA can in fact detect sub-clinical DR changes that would pave the way for earlier intervention and prevention of vision loss, rather than treatment of vision loss.
8. Review of Clinical Studies Utilizing OCTA
8.1 Diabetic Retinopathy (DR)
DR remains a leading cause of visual impairment and blindness in the world. An estimated 285 million people world-wide are estimated to have diabetes mellitus. Approximately 33% have signs of any DR and ~11% have vision-threatening DR (Lee, Wong et al. 2015). One of the major challenges in the diagnosis and management of DR is that the clinical presentation of the disease occurs 10 to 20-years after the diagnosis of diabetes mellitus type II or 5 to 10 years after the diagnosis of type I diabetes mellitus (Klein 2007). Histologic studies on human cadaver eyes and animal models have suggested that the onset of pathologic changes occurs many years before the clinical presentation (Campochiaro 2015, Stitt, Curtis et al. 2016). Therefore, it is very likely that clinical grading of NPDR detects the disease at a relatively advanced stage of microscopic vascular changes that are not otherwise clinically or angiographically detectable.
OCTA is a novel modality that safely, quickly, and noninvasively demonstrates the retinal microvasculature with resolution that exceeds FA and approaches histologic accuracy. Therefore, OCTA presents an opportunity for clinicians to detect the ongoing subclinical changes that are occurring in DR, during the long period before the onset of clinical signs and symptoms. It has already been demonstrated that OCTA can successfully reveal almost all of the clinically relevant findings in the macula of diabetic subjects (Hwang, Jia et al. 2015, Ishibazawa, Nagaoka et al. 2015, Jia, Bailey et al. 2015, Matsunaga, Yi et al. 2015, de Carlo, Bonini Filho et al. 2016). In addition to these qualitative findings, OCTA offers a significant advantage for quantitative and objective assessments. Here, we will review several additional studies that demonstrate the application of OCTA in assessing DR.
Recent OCTA studies have demonstrated qualitative assessments of retinal vascular changes in subjects with DR, including impaired capillary perfusion, intraretinal microvascular anomalies, neovascularization, as well as some types of microaneurysms (Hwang, Jia et al. 2015, Ishibazawa, Nagaoka et al. 2015, Jia, Bailey et al. 2015, Matsunaga, Yi et al. 2015, de Carlo, Bonini Filho et al. 2016). Matsunaga et al. have also demonstrated that some types of intraretinal edema can be visualized on OCTA images (Matsunaga, Yi et al. 2015). These qualitative findings are sufficient in most cases for the diagnosis and management of macular complications of DR with a few caveats. The earliest and most straight-forward use of OCTA is for the assessment of areas with impaired capillary perfusion (otherwise known as “nonperfusion”). We prefer to avoid the term “nonperfusion” because even in cases where OCTA signal is absent it is still possible that there is blood flow below the threshold of detection for OCTA (or even FA). The most widely recognized use of this OCTA capability has been to assess the shape and size of FAZ among diabetics of varying severity and normal subjects. For example, OCTA of 63 eyes of 63 patients showed significant enlargement of FAZ from 0.25-mm2 in controls to 0.37-mm2 in diabetic eyes without DR and to 0.38-mm2 in eyes with DR (Takase, Nozaki et al. 2015). In a separate study, quantitative assessment of FAZ area in 110 high quality FA of diabetic subjects and 31 healthy controls showed that FAZ surface area ranged from mean of 0.15±0.09-mm2 in controls, 0.30±0.19-mm2 in baseline DR, 0.42±0.25-mm2 in NPDR, and 0.61±0.41-mm2 in PDR subjects. The increase was statistically significant between all stages. Interestingly, the study showed that ETDRS qualitative criteria correlated significantly with FAZ area measurements for all grades, except for the two mildest (Conrath, Giorgi et al. 2005). Other OCTA studies of diabetic subjects without DR also showed an enlargement of the FAZ (de Carlo, Chin et al. 2015). In addition, OCTA of 13 healthy subjects and 13 subjects with mild NPDR showed that the NPDR group has larger avascular areas as compared to controls, using an automated algorithm (0.85±0.47-mm2 versus 0.46±0.29-mm2; p=0.017) (Zhang, Hwang et al. 2016). Although previous investigators have demonstrated similar findings using FA (Bresnick, Condit et al. 1984, Mansour, Schachat et al. 1993), this has not been widely adopted in clinical practice due to the invasive nature of FA. OCTA provides a practical and clinically available method of assessing FAZ in diabetic subjects who would otherwise not have FA but the clinical significance and reliability of these OCTA results is still a subject of ongoing research.
Several groups have performed larger studies to demonstrate whether more formal quantitative metrics of capillary density correlate with DR severity. For example, OCTA of 56 eyes of 34 subjects with DR and 12 age-matched control eyes of 12 subjects showed a significant decrease in the skeletonized capillary density of all eyes with DR as compared to the control eyes (Agemy, Scripsema et al. 2015). Statistical comparisons among all groups (normals and all stages of DR) showed significant differences between normal and all DR stages, mild and severe NPDR, and mild NPDR and proliferative DR (PDR), as well as all NPDR and PDR for 3×3-mm2 images. Interestingly, there were no significant differences found among varying stages of DR with 6×6-mm2 images in this study. The trend towards decreasing capillary density was significant in both 3×3 and 6×6-mm2 images in the DRL for only two comparisons (mild NPDR with PDR and all NPDR with PDR). Therefore, OCTA is at least capable of distinguishing between large changes in DR severity in all layers. It is interesting that this study showed the most significant changes in the DRL, but it is now known that this layer is the most likely to be confounded by projection artifacts and segmentation error. Overall, this is the first study to suggest that quantitative OCTA of DR can be useful in stratifying disease severity, although it did not demonstrate that OCTA can actually distinguish between each of the clinical stages of DR in a reliable fashion. It is unclear why even in the more severe cases of DR there are no differences in the SRL comparisons among DR levels (Agemy, Scripsema et al. 2015).
Another retrospective OCTA study of 13 eyes with DR without macular edema and 56 control eyes showed that the mean fractal dimension in the DR group was significantly less than the control for both SCL and DCL (P<0.005 for each; (Zahid, Dolz-Marco et al. 2016)). In the control group, the mean vessel density in the SCL and DCL was 55.6±1.7% and 60.6±1.5%, respectively. In the diabetic group, the mean vessel density in the SCL and DCL was 48.2±4.6% and 53.6±3.2%, respectively, which was consistent with the previous results. One weakness of this study was the very small sample size of diabetic subjects (only 13 diabetic eyes). Another weakness was that the diabetic group was significantly older than the control group, and it is widely known that capillary density decreases with age. The mean age of the control group and diabetic group was 32±7 and 57±13-years, respectively. Nevertheless, the study showed a significantly lower capillary density and fractal dimension in both SCL and DCL of diabetic subjects compared with controls. However, there was no difference in the comparison among different severity levels of DR, possibly due to the small sample size and lack of age-matching (Zahid, Dolz-Marco et al. 2016).
In another OCTA study of 209 eyes of 122 Type 2 DR subjects and 60 eyes of 31 normal Indian subjects, FAZ area and vessel density measurements were assessed. Patients with macular edema, renal disease, and history of intravitreal injection were excluded, which heavily biases this group towards healthier subjects with DR, and also minimizes the likelihood of segmentation errors. Systemic variables, including finger stick blood glucose, post-prandial blood sugar, blood pressure, body mass index, hemoglobin, hemoglobin A1c, low density lipoprotein, and high density lipoprotein were measured. In this study, normal eyes had significantly higher vessel density and smaller FAZ area than all DR subjects combined. However, the results of this study are somewhat unusual in that the size of the FAZ and average vessel density did not significantly change with increasing DR severity. This may be attributable to differences in segmentation and layer definitions among studies. Overall, the findings in the DRL were less robust than those in the SRL in keeping up with most OCTA studies of DR (Bhanushali, Anegondi et al. 2016).
As the above studies illustrate, one pitfall in current OCTA studies is that layer segmentation methods and definitions are not standardized and may account for some of the discrepancies between studies. Although commercial OCTA devices are capable of motion correction and eye tracking, movement artifacts can still significantly impact data availability and quality. Abnormal retinal pathology may also limit reliable segmentation. For example, in an OCTA study of 94 eyes, 61 eyes were excluded due to inadequate image quality (Hasegawa, Nozaki et al. 2016). Ultimately, only 33 eyes from 27 subjects were used to examine the correlation between the location of the microaneurysms and the macular edema in 6×6-mm2 OCTA images. The study reports that 77% of all observed microaneurysms on OCTA were found in the deep capillary layer. However, within areas of diabetic macular edema, 91% of all microaneurysms were found in the DRL. There was a significant positive correlation between increasing retinal volume and the number of microaneurysms. While the results of this study are interesting and largely consistent with previous non-OCTA studies, it is possible that the retinal distortion caused by macular edema confounded the segmentation and localization of microaneurysms. Also, the use of OCTA alone for detection of microaneurysms likely resulted in an underestimation of the total number of microaneurysms, since several studies have demonstrated that not all microaneurysms appear on OCTA as they do on FA. For example, in one study, only 62% of microaneurysms detected by FA were found on OCTA (Couturier, Mane et al. 2015). Similar findings regarding microaneurysms have been noted by other studies (Matsunaga, Yi et al. 2015, Hasegawa, Nozaki et al. 2016). Despite these limitations of OCTA as a new methodology, the results of these studies agree with former histopathology and OCT studies that show microaneurysms are preferentially located in the inner nuclear layer (Moore, Bagley et al. 1999, Horii, Murakami et al. 2015).
Several studies using SS-OCTA have also been performed in assessing DR. One OCTA study of 28 eyes from 18 subjects with DR and 40 eyes from 22 healthy subjects showed that the mean FAZ area in the SRL was 0.52-mm2 and 0.34-mm in the DR and control groups, respectively. Mean FAZ area in the DRL was 0.62-mm and 0.36-mm in the DR and control groups, respectively. In this study, SS-OCTA had a central wavelength of 1050-nm and 100-kHz acquisition speed (Topcon Triton™ DRI; Topcon Corp, Tokyo, Japan) and 3×3-mm2 scans centered on the macula were used. Automated layer segmentation was used and defined as SRL (ILM to inner border of INL) and DRL (inner border of INL to outer border of INL). FAZ was measured manually with GIMP™ software. Vessel density was measured as percent of surface area covered by vessels in binarized images. Despite the use of SS-OCTA, in this case, there were no significant differences in the FAZ area in the SRL of mild or moderate NPDR as compared to control groups. However, there was a significant difference in FAZ area in the DRL for all subgroups. Agreement for the FAZ area between graders was excellent (ICC > 0.99). Mean vessel density was significantly lower in the SRL of DR subjects as compared to controls. Mean vessel density was also significantly lower in the DRL of DR subjects as compared to controls. Interestingly, there was a significantly lower vessel density among subjects with diabetic macular edema than those without diabetic macular edema (Al-Sheikh, Akil et al. 2016).
Another interesting application of OCTA is to better understand the impact of laser treatments and anti-VEGF therapy on retinal tissue in DR subjects. For example, a study was performed using 6×6-mm2 OCTA in 8 subjects with diabetic macular edema and a history of focal laser. This study showed changes in the choriocapillaris on manually segmented images, but, in most cases, there were no changes in the superficial or deep retinal vasculature in the region of focal laser. In some cases, there were changes in the outer plexiform layer on OCT structural scans (Cole, Novais et al. 2016). OCT-based studies have also suggested that focal laser does not significantly alter the anatomy of the inner retina (Bolz, Kriechbaum et al. 2010), but histologic studies performed on monkey models of focal laser injury to the retina (Wilson, Finkelstein et al. 1988) demonstrate decreased capillary density in the region of focal laser. Additional studies are needed to understand this discrepancy, but OCTA now provides a powerful tool for assessing vascular changes in vivo.
The above studies highlight the salient findings in OCTA studies of DR as well as the associated limitations. One of the main limitations is that it is very difficult to compare quantitative metrics across studies, since segmentation methods are not standardized and quality-controlled. In addition, the details of the metric calculations vary from study-to-study. Lastly, most studies have not compared comprehensive capillary density and morphology measures simultaneously on the same data set. It is very likely that both morphologic changes in capillaries (e.g. branching pattern and capillary diameter) as well as capillary density measures (e.g. vessel density versus skeleton density) will be important in characterizing vascular changes in DR. Each of these parameters will need to be validated and tested for reliability and reproducibility. In addition, each have strengths as well as weaknesses that need to be systematically tested. In the near future, a potentially high impact role of OCTA would be the assessment of retinal capillary reperfusion in subjects with DR and anti-VEGF therapy. FA-based studies have demonstrated that sustained anti-VEGF therapy in subjects with DR slows or even reverses retinal non-perfusion (Campochiaro, Wykoff et al. 2014). However, Falavarjani et al. recently showed that there is no difference in retinal capillary density or FAZ area in subjects with DR or RVO, before and after a single intravitreal injection of anti-VEGF agents for macular edema (Ghasemi Falavarjani, Iafe et al. 2017). It is likely that one month is not a sufficient duration of treatment to observe any changes in perfusion, and future studies are needed to address this.
A few studies have begun to address the challenge of using both morphology and density parameters in a systematic way in DR (Kim, Chu et al. 2016) as well as for other retinal vascular diseases (Kim, Rodger et al. 2016, Koulisis, Kim et al. 2016). Kim et al. performed a retrospective, cross-sectional study of 84 eyes with DR and 14 healthy eyes (Kim, Chu et al. 2016). This study demonstrated that several capillary density and morphology parameters correlate with the severity of DR in a single cohort. Capillary density was assessed as a simple percentage of the area covered by vessels in both binarized OCTA images (Vessel Density) as well as skeletonized images (Skeleton Density). This is important in that the simple vessel density measure can overestimate the diameter of retinal capillaries, and therefore overestimate capillary density. Skeleton density measures the “length” of vessels in the OCTA images and removes the potential confounding influence of vessel diameter from the density metric. Therefore, skeleton density may be a more sensitive measure of impaired capillary perfusion; though, this has yet to be determined.
The Kim et al. study shows that both vessel density and skeleton density demonstrate a negative and significant correlation with clinical severity of DR (Kim, Chu et al. 2016). Interestingly, skeleton density changes were larger in magnitude for each step change in clinical severity of DR. Kim et al. also looked at two measures of capillary morphology—fractal dimension and vessel diameter index. Fractal dimension was assessed by a modification of the box counting method and provides a measure of the capillary branching complexity. The clinical severity of DR was positively and significantly correlated with fractal dimension. In this study, the vessel diameter index provides a unit less measure of the capillary diameter. As expected, clinical severity of DR was inversely proportional to vessel diameter. In almost all cases, the magnitude and significance of the changes was greatest in the SRL. This is likely because the DRL measurements are confounded by projection artifacts, which are very hard to compensate for with current methods. In addition, it is interesting and encouraging that in all parameters, except for vessel diameter index, there was a significant difference between normal controls and mild NPDR. Therefore, this is the first study to show that early changes in DR can be detected by OCTA metrics. However, the most reliable and reproducible metrics have yet to be identified and it may be worthwhile to revisit these metrics when more sophisticated methods of projection artifact removal are available (Zhang, Hwang et al. 2016) (Liu, Gao et al. 2015, Zhang, Zhang et al. 2015). These same metrics have been applied to subjects with RVO (Koulisis, Kim et al. 2016) as well as subjects with quiescent, but chronic uveitis (discussed below; (Kim, Rodger et al. 2016)). As described below, the same trends seem to hold in those studies suggesting that a comprehensive analysis of OCTA-based metrics for density and morphology may play a broader role in the assessment of retinal vascular changes.
8.2 Retinal Venous Occlusion (RVO)
Capillary level changes have long been demonstrated in subjects with RVO. Clinical findings include areas of impaired perfusion, vascular dilation, tortuosity and shunting, cotton-wool spots, and retinal hemorrhages, among others (Ryan, Schachat et al. 2013). Kashani et al. showed that all of the clinically relevant macular findings of RVO can be identified on OCTA images in a pilot study of 25 subjects with varying severity of RVO and controls (Kashani, Lee et al. 2015). This study also suggested that the findings in the DRL were more profound than those in the SRL in RVO subjects. Several other studies have also confirmed those findings (Rispoli, Savastano et al. 2015, Adhi, Filho et al. 2016) and are reviewed below. Interestingly, Kashani et al. also demonstrated that some regions of intraretinal fluid could be visualized on OCTA in analogy to what Matsunaga et al. showed for intraretinal fluid in DR (Kashani, Lee et al. 2015). Therefore, there is sufficient evidence to suggest that OCTA of the macula is equally effective for management of the macular complications of RVO as FA. Many studies in the past have explored the quantification of retinal vascular changes in RVO similar to those described above for DR. A growing area of current interest is to validate OCTA measurements with these and to expand on them.
Before the era of OCTA, FA and histology were used in several studies to quantify changes in the retinal vasculature in RVO subjects. Remky et al. demonstrated significant changes in the mean perifoveal intercapillary area (a proxy for focal capillary density), size of the FAZ, and capillary blood flow in subjects with central RVO (CRVO) compared to controls on FA (Remky, Wolf et al. 1997). FAZ size increased from 0.218±0.074-mm2 to 0.317±0.166-mm2 in controls and subjects with CRVO, respectively. Mean capillary blood flow using digital high-speed FA decreased from 2.886±0.406-mm/sec in controls to 1.626±0.219-mm/sec in CRVO subjects (Remky, Wolf et al. 1997). Lastly, mean perifoveal intercapillary area increased from 3872±529-μm2 to 5548±1151-μm2 in control and CRVO subjects, respectively. Notably, only mean capillary blood flow had any significant correlation with visual acuity. In another study, subjects with branch RVO (BRVO) had similar changes in FAZ size using FA, but there was a significant correlation with visual acuity and FAZ size (Parodi, Visintin et al. 1995). Similarly, BRVO subjects had significant changes in blood velocity and blood flow using laser Doppler flowmetry (Avila, Bartsch et al. 1998); however, there is some debate regarding the accuracy of this method (Squirrell, Watts et al. 2001). Despite these findings, clinical adoption of FA for assessment of FAZ size and blood flow have not been adopted due to the invasive nature of FA and relatively labor-intensive image analysis that is required to generate the blood flow data.
Due to the non-invasive nature of OCTA, several studies have taken advantage of OCTA to assess FAZ size and shape in subjects with RVOs. These studies have confirmed the above findings and provided novel information about the layer specific nature of impaired perfusion in RVO subjects. For example, several studies of RVO show a decrease in both superficial and deep capillary plexus density, FAZ enlargement, and microvascular abnormalities (Rispoli, Savastano et al. 2015, Coscas, Glacet-Bernard et al. 2016). One such OCTA study of 54 subjects with RVO (29 CRVO and 25 BRVO) attempted to characterize qualitative OCTA features, such as disruption of the perifoveolar capillary arcade, capillary abnormalities, central cysts, non-perfusion “greyish” areas, and deep capillary plexus (Coscas, Glacet-Bernard et al. 2016). The study included subjects with macular edema. This study showed disruption of perifoveal capillary arcade in 92% of eyes on OCTA and 72% on FA. Perifoveal capillary arcade changes in the superficial capillary layer and network disruption in the deep capillary layer were significantly correlated with peripheral retinal ischemia, as defined by a region of 10-disc diameters or more on FA. However, peripheral ischemia by FA was only noted in 63% of eyes with perifoveal capillary disruption on OCTA. Intraretinal cystoid spaces were noted in 68% of eyes on FA, 75% on OCT, and 90% on OCTA. Nonperfusion “greyish” areas were significantly more frequent in the deep capillary plexus than in the superficial capillary plexus. Intra- and interobserver agreement for OCTA parameters was between 0.61 and 0.82. The authors conclude that OCTA can assess both perfusion and macular edema. There was no correlation between OCTA parameters and BCVA on ETDRS charts. FAZ was not specifically measured (Coscas, Glacet-Bernard et al. 2016).
In the above studies, it is unclear how segmentation variability due to macular edema and retinal atrophy were addressed, but the results confirm the importance of density and morphology assessments in this disease. Another prospective OCTA study of 24 subjects with CRVO and without macular edema was performed to measure FAZ and correlation with ETDRS best corrected visual acuity. In this study, all subjects were treated with anti-VEGF agents to resolve edema before OCTA. Therefore, the confounding effect of macular edema on segmentation should be minimal. Mean superficial FAZ area was 0.76-mm2 and mean deep FAZ area was 1.12-mm2. A multivariable regression analysis showed a significant negative correlation between the BCVA and the superficial FAZ area, but not the deep FAZ area. Disruption of the ellipsoid zone was significantly correlated with poorer vision and larger superficial FAZ. Six subjects had enlargement of the DRL beyond the 3×3-mm2 field, thus precluding accurate measurement. The authors conclude that the DRL in CRVO is more susceptible to capillary loss (Casselholmde Salles, Kvanta et al. 2016).
As we have mentioned throughout this paper, the field-of-view is one of the main limitations of current OCTA devices. Most studies use 3×3-mm2 macular fields as a proxy of capillary changes throughout the retina. However, due to recent improvements in the field-of-view of commercial devices, some investigators have begun to take advantage of this feature. For example, one OCTA study of 23 subjects with RVO (15 CRVO and 8 BRVO) and 8 eyes of 8 age-matched controls were assessed for FAZ size and perifoveal capillary network. Although both 3×3 and 6×6-mm2 images were assessed, only 3×3-mm2 images are illustrated. Mean FAZ in 3×3-mm2 scans was larger in RVO eyes than both fellow eyes (1.13±0.25-mm2 vs 0.58±0.28-mm2; P<0.007) and control eyes (0.30±0.09mm2; P<0.0001). Mean FAZ was also larger in fellow eyes of RVO subjects compared to controls (0.58±0.28mm2 vs 0.30±0.09mm2; P=0.01). Approximately 60% of the group had a history of anti-VEGF injections, suggesting that macular edema may still be a confounder in the segmentation of these images. In order to avoid segmentation as a possible confounder, the authors only performed a qualitative analysis of OCTA images in subjects that did not have cystoid macular edema. This suggested a decrease in perfusion in the DRL in all RVO eyes without CME and in 53% of fellow eyes. It is not clear what the corresponding measure is for superficial layer or for subjects with macular edema. Vascular tortuosity and collaterals were also subjectively noted in RVO subject eyes. The results of this paper seem to generalize to both 3×3 and 6×6-mm2 fields, but a specific comparison of the two field sizes is lacking in the paper (Adhi, Filho et al. 2016).
Another OCTA study of 81 eyes from 76 subjects with RVO (49% CRVO, 42% BRVO, 9% HRVO) compared fundus photos, FA, and OCTA findings for 3×3 and 8×8-mm2 images. Notably, out of this group, only 21 eyes had gradable 3×3-mm2 and 8×8-mm2 images. This represents one of the fundamental problems with OCTA imaging, since subjects with poorer fixation generally are harder to scan. Despite this, OCTA imaging provides the best method for safely visualizing retinal capillaries because it is non-invasive. In this study, there was good agreement between OCTA and FA for the area of impaired perfusion (ICC 0.825 for 3×3mm scan and 0.891 for 8×8mm2 scan). This study also demonstrated that 46% of eyes had areas of impaired perfusion and 32% had retinal neovascularization outside the 8×8-mm2 scan area. Approximately 18% only had neovascularization outside the 8×8-mm2 scan area. Therefore, even though the field-of-view is constantly improving, clinicians and investigators should be conscientious of potential findings outside the OCTA field (Cardoso, Keane et al. 2016).
The findings from the above studies and others suggest that OCTA is useful for diagnosis and management of retinal vascular complications of RVO in the macula. Similar to the discussion above for DR, a systematic and quantitative description of the changes in capillary density and morphology in RVO has been lacking and would be very helpful in research studies, and even clinical management, if it were shown to be reliable and reproducible. In an OCTA study of RVO subjects, Koulisis et al. has taken a step in this direction using several quantitative OCTA metrics. Koulisis et al. show that a combination of OCTA metrics describing retinal capillary density and morphology correlates well with the clinical severity of RVO (Koulisis, Kim et al. 2016). In that study of 58 eyes with RVO and 26 control eyes, both non-segmented (full thickness) retinal capillary measurements and segmented (superficial and deep capillary layer) capillary measurements showed significantly lower fractal dimension and skeletal density compared to controls. Fractal dimensions, vessel densities, and skeletal densities were also significantly lower in the RVO eyes than in the contralateral eyes of RVO subjects. Most interesting, all of these parameters progressively decreased as the clinical severity of RVO increased (BRVO versus CRVO). Similar to Kim et al.’s study of OCTA-based metrics in DR discussed above, the findings in Koulisis et al. suggest that OCTA-based metrics of morphology and density can be useful in quantifying RVO severity. At this point, since RVO severity is essentially a binary classification (BRVO vs CRVO), an objective and quantitative classification system would be very useful in clinical trials and clinical management. For example, recent studies have shown that anti-VEGF treatment in RVO subjects can stabilize or even reverse nonperfusion on FA (Sophie, Hafiz et al. 2013). However, Falavarjani et al. recently showed that there is no difference in retinal capillary density or FAZ area in subjects with RVO after a single intravitreal injection of anti-VEGF agents for macular edema (Ghasemi Falavarjani, Iafe et al. 2017). Just as in DR, it is likely that long-term studies are necessary to show any significant changes. In addition, the segmentation and layer classifications will need to be standardized and revisited in these studies to ensure that the best metrics are being used to detect what are likely to be subtle changes.
8.3 Retinal Arterial Occlusion (RAO)
Similar to RVO, OCTA may have an important role to play in the diagnosis and management of RAO. There are very few studies that have applied OCTA imaging to RAO perhaps because of the low incidence and prevalence of this retinal vascular disease compared to others. However, at least one study has demonstrated that OCTA can demonstrate the impaired perfusion in RAO effectively and may even demonstrate remodeling of the capillary layers over time (Bonini Filho, Adhi et al. 2015). We have one example of a subject with a chronic branch RAO who presented with minimal symptoms and excellent vision. The clinical examination of this subject was almost unremarkable, except for a slightly atrophic appearance of some regions of the superior macula and retina. The subject refused FA, but OCTA clearly shows the extent of capillary and neurosensory loss in the superior macula (Figure 8).
Figure 8.

OCTA of a 36 year old female with a chronic (>1 year) retinal vascular occlusion and inner retinal atrophy involving the superior macula but sparing the fovea. (A) Depth encoded pseudocolored map of the superficial and mid-retinal vasculature. Red = superficial vasculature. Green = middle retinal vasculature. Yellow = red/green overlay. (B) Raw OCTA intensity image of superficial layer demonstrates lack of superficial blood flow in most of the superior half of the macula and apparent decreased vascular density in most of superior retina. (C) Raw OCTA intensity image of mid-retinal vasculature demonstrates similar extensive loss of blood flow characteristic of the mid-retinal layer in superior macula. The OCTA signal from the larger retinal vessels in the superior macula are not characteristic of the mid-retinal layer and appear here because of the atrophy of the inner retina and displacement of the larger retinal vessels deeper into the retina as shown in the B-scans below. (E–H) Segmentation of corresponding layers shown in the B-scan at the level of the fine blue line in above images.
8.4 Glaucomatous Optic Neuropathy
OCTA studies of glaucoma have demonstrated reduced perfusion in the optic nerve head, peripapillary retina, and even macula, and support the promise of OCTA as an additional modality to aid clinicians in the early detection and monitoring of glaucoma. Figure 9 illustrates a prominent defect in the peripapillary capillary plexus of a subject with glaucoma compared to a normal subject. While the association between reduced perfusion and glaucomatous damage has been established in recent OCTA studies, we still do not know whether reduced perfusion merely results from loss of retinal ganglion cells and their axons or whether microcirculation changes can predict and help contribute to subsequent retinal ganglion cell loss. Current cross-sectional studies lay the framework for OCTA’s future potential to elucidate the vascular component of the pathophysiology underlying certain types of glaucoma.
Figure 9.

En face SD-OCTA images of the superficial retinal slab from (A) normal subject and (B) patient’s left eye demonstrates an inferotemporal perfusion defect consistent with inferotemporal glaucomatous damage.
An et al. and Jia et al. were the first to describe OCTA imaging of the human optic disc microvasculature in 2012 (An, Johnstone et al. 2012, Jia, Morrison et al. 2012). An et al. used the optical microangiography technique of OCTA to demonstrate the high-resolution relationship of optic disc microvasculature with its laminar structure (An, Johnstone et al. 2012). Jia et al. used the SSADA algorithm with SS-OCTA and demonstrated, in a small pilot study, the reduced optic nerve head perfusion in early preperimetric glaucoma eyes as compared to normal eyes (Jia, Morrison et al. 2012).
Several studies have since used OCTA to quantify perfusion differences of the full thickness optic nerve head between glaucoma and normal eyes. Jia et al. introduced a new disc flow index (which is defined as the average decorrelation value within the disc) and demonstrated that their glaucoma patients experienced a 25% reduction in disc flow index compared to normals. The disc flow index correlated significantly with visual field pattern standard deviation, but did not show significant correlation to average retinal nerve fiber layer (RNFL) thickness nor average rim area (Jia, Wei et al. 2014). In a larger study, Wang et al. evaluated both disc flow index and vessel densities of the entire optic disc in open angle glaucoma patients and demonstrated a diagnostic accuracy of 0.82 for disc flow index and 0.80 for vessel density. They also reported a correlation between these perfusion parameters and glaucoma stage severity, RNFL thickness, ganglion cell complex thickness, and visual field mean deviation among open angle glaucoma patients (Wang, Jiang et al. 2015). Leveque et al. evaluated vessel density of the entire optic nerve head as well as the temporal disc (in order to avoid contributions from large vessels) and reported a significant reduction in both parameters in glaucoma patients as compared to normal. Additionally, they demonstrated significant correlations between temporal and total optic nerve head vessel density with RNFL, ganglion cell complex, visual field mean deviation, and visual field index (Leveque, Zeboulon et al. 2016).
Rather than using the full thickness optic nerve head slab, Chen et al. isolated the pre-laminar layer to report perfusion differences between glaucoma and normal eyes, with good repeatability and reproducibility (Chen C 2016, Chen C 2016). In addition, Chen et al. introduced two new indices, termed flux and normalized flux, and demonstrated good repeatability and reproducibility. Flux was defined as the mean flow signal intensity over the entire optic nerve head (ONH) area. Normalized flux, with the intent of avoiding bias from reduced vessel area in glaucomatous eyes, was the flux normalized by the vessel area. In this study, they reported a significant reduction of flux, vessel area density, and normalized flux in glaucoma eyes. In addition, they reported a significant correlation to be present between these parameters and visual field mean deviation, pattern standard deviation, RNFL, and rim area (Chen C 2016). Bojikian et al. also compared ONH perfusion between normal tension glaucoma eyes and primary open angle glaucoma eyes (with higher baseline intraocular pressures). While they reported reduced flux, vessel area density, and normalized flux in glaucomatous eyes compared to normals, they did not identify a difference between normal tension glaucoma and primary open angle glaucoma eyes. Additional longitudinal studies on these comparisons will be useful in the future to validate these findings (Bojikian, Chen et al. 2016).
Much of the subsequent work on OCTA in glaucoma has been focused on the peripapillary microcirculation, which has the benefit of fewer artifacts from large blood vessels and from disc anatomy variation, such as tilted discs, making it more difficult to segment particular layers. By using full-thickness retinal angiograms, Liu et al. were the first to demonstrate significantly reduced peripapillary flow index and peripapillary vessel density in glaucomatous eyes compared to normal eyes, with strong diagnostic accuracy (0.892 and 0.938, respectively), repeatability, and reproducibility. There was also a strong correlation with visual field pattern standard deviation and glaucoma stage, but not with average RNFL thickness (Liu, Jia et al. 2015). Yarmahammadi et al. measured whole image vessel density and circumpapillary vessel density of the RNFL layer of open angle glaucoma, glaucoma suspect, and normal eyes and demonstrated strong diagnostic accuracies for differentiating glaucoma and healthy eyes (0.94 for whole image vessel density and 0.83 for circumpapillary vessel density compared to 0.92 for RNFL thickness) (Yarmohammadi, Zangwill et al. 2016). Scripsema et al. evaluated peripapillary capillary density (excluding large vessels) of the RNFL layer from patients with primary open angle glaucoma and normal tension glaucoma, demonstrating significantly reduced capillary density in these patients as compared to normal (Scripsema, Garcia et al. 2016). They found a mildly reduced capillary density in patients with normal tension glaucoma as compared to patients with primary open angle glaucoma (despite similar age and disease stage between the groups). However, it is difficult to infer differences in pathophysiology on normal tension glaucoma versus primary open angle glaucoma from this small study. With a relatively large cohort of 112 glaucoma eyes and 74 normal eyes, Kumar et al. demonstrated a reduced vessel density of the radial peripapillary capillaries with better diagnostic accuracy of composite vascular parameters, in order to discriminate preperimetric glaucoma from normal eyes as compared to structural parameters (Kumar, Anegondi et al. 2016). Rao et al. also demonstrated strong diagnostic ability of the peripapillary vessel density, particularly the inferotemporal sector, in both primary open angle glaucoma and primary angle closure glaucoma, with similar diagnostic accuracy as RNFL thickness (Rao, Kadambi et al. 2016). Suh et al. demonstrated that primary open angle glaucoma eyes with focal lamina cribrosa defects had reduced vessel density both globally and sectorally as compared to eyes with similar glaucoma severities that did not have focal lamina cribrosa defects (Suh, Zangwill et al. 2016). From these findings, they suggested that focal lamina cribrosa defects and impaired ocular hemodynamics are etiologically related, as suggested in prior research (Burgoyne 2011).
Chen et al. demonstrated a significantly reduced peripapillary flux index and vessel area density, both globally and in particular quadrants of glaucomatous eyes. They also reported a strong correlation between these perfusion metrics and structural and functional measures of glaucoma (RNFL thickness and visual field mean deviation) (Chen, Zhang et al. 2016). Additionally, Mammo et al. utilized a speckle variance-based SS-OCTA, to demonstrate significant reduction in radial peripapillary capillary density (using a manual tracing technique) in unilateral glaucoma eyes compared to fellow eyes, glaucoma suspect eyes, and normal eyes. They, too, demonstrated a strong correlation with RNFL thickness and visual field index (Mammo, Heisler et al. 2016).
Akagi et al. looked specifically at primary open angle glaucoma eyes with hemifield visual field defects and reported peripapillary vessel densities of the inner retina as well as the full thickness of ONH vessel density. They reported reduced vessel densities and reduced RNFL thickness of peripapillary and ONH regions corresponding to the visual field defects. Interestingly, they found reduced RNFL thickness in the regions not corresponding to visual field defects, but did not see a reduction in the vessel density in these locations (Akagi, Iida et al. 2016). From this preliminary finding, they suggested that peripapillary microvascular reduction may occur after RNFL thinning and that vessel density may be more closely correlated with visual function than RNFL thickness. Corroborating the latter conclusion, Yarmohammadi et al. recently reported that visual field mean deviation had a stronger correlation with circumpapillary vessel density and whole image vessel density than with either RNFL thickness or rim area, also suggesting that vascular perfusion may be more closely correlated with visual function than RNFL thickness (Yarmohammadi, Zangwill et al. 2016). They hypothesized that sick retinal ganglion cells and their axons may have reduced perfusion before apoptosis actually occurs, thus having stronger correlation with visual field measures. If these findings are confirmed in larger studies, clinicians and researchers alike may be using OCTA to detect sick, poorly functioning retinal ganglion cells that may benefit from either aggressive IOP-lowering treatments or neuroprotective treatments. While pronounced IOP-lowering surgery has already been shown to reverse visual field damage, presumably salvaging sick retinal ganglion cells before apoptosis (Pederson and Herschler 1982, Tsai, Shin et al. 1991, Gandolfi 1995, Wittstrom, Schatz et al. 2010, Caprioli, de Leon et al. 2016, Waisbourd, Ahmed et al. 2016), OCTA may provide the tool needed to identify patients with salvageable retinal ganglion cells.
Rao et al. has published the first report looking at macular perfusion (of the inner retinal layer from inner limiting membrane to inner plexiform layer; globally and sectorally) in glaucomatous eyes and compared its diagnostic accuracy to that of ONH and peripapillary regions. They showed that peripapillary vessel density actually had greater diagnostic accuracy than ONH and macular regions. The finding that diagnostic accuracy of macular perfusion was inferior may be due to the fact that retinal ganglion cell axons, not their cell bodies, which make up the ganglion cell layer in the macula, are involved in glaucoma pathogenesis (Burgoyne 2011). Alternatively, it may be related to their methodology of using a 3mm×3mm scan, which may not be sufficient to see the area affected by glaucoma. ONH perfusion was likely inferior to peripapillary perfusion due to the fact that measuring perfusion of the ONH is complicated by large variations in disc anatomy and prominence and variations of large vessels within the disc. More recently, Takusagawa et al. also evaluated macular perfusion in glaucoma using 6mm×6mm scans and noted significantly reduced perfusion in the superficial vascular plexus of glaucoma compared to normal eyes, with much higher diagnostic accuracy than that reported by Rao et al. In addition to the large scan area, this study utilized projection resolution algorithms to reduce flow projection artifact in generation of en face images and utilized quantification algorithms with reflectance compensation to reduce artifact from media opacities. Such improvements to software algorithms will continue to increase the clinical utility of OCTA in glaucoma.
Finally, Suh et al. has published the first report looking at a cohort of glaucomatous eyes that had DRL dropout, providing insight into potential vascular etiological factors (Suh, Zangwill et al. 2016). They found that focal lamina cribrosa defects, more advanced glaucoma, reduced RNFL vessel density, thinner choroidal thickness, and lower diastolic blood pressure were all associated with peripapillary DRL dropout. These findings suggest possible disruption of the microvasculature within the laminar tissue, and the association of thinner choroid and lower diastolic blood pressure may suggest etiologic factors for reduced perfusion and subsequent glaucomatous damage. Longitudinal studies will need to validate these findings.
The current body of literature already demonstrates the precision to which OCTA can identify microvascular changes in glaucomatous eyes. OCTA may someday augment structural OCT measures, such as RNFL thickness in early glaucoma detection. Future studies will verify whether OCTA can truly detect reversible glaucomatous changes (e.g. reduced perfusion from sick retinal ganglion cells) that will allow clinicians to intervene and prevent vision loss. Additionally, OCTA, more so than its precursor technologies, has the potential to clarify the degree to which microvascular changes contribute to subsequent glaucomatous damage. Prior to such longitudinal studies, it will be important for us to first understand the ocular, systemic, and physiologic factors (Alnawaiseh, Lahme et al. 2016, Yang, Wang et al. 2016) that also affect microvascular perfusion, so that we can accurately identify cause-and-effect relationships in the future. Never before has the elucidation of vascular mechanisms in glaucoma been so palpable.
8.5 Non-Glaucomatous Optic Neuropathy
A few studies have begun to explore optic nerve head and peripapillary microcirculation findings in non-glaucomatous optic neuropathies. Wang et al. described the optic nerve head and parafoveal perfusion findings in patients with multiple sclerosis, an inflammatory autoimmune disease of the central nervous system characterized by widespread endothelial dysfunction which often manifests with optic neuritis. They demonstrated that multiple sclerosis patients with a history of optic neuritis had a reduced disc flow index compared to patients with multiple sclerosis that did not have an optic neuritis history as well as normal controls (Wang, Jia et al. 2014). Hata et al. described reduced optic nerve head and peripapillary microcirculation in a cohort of 15 chronic non-arteritic ischemic optic neuropathy eyes compared to normal controls OCTA. Interestingly, while the peripapillary RNFL and visual field defect correlated with peripapillary vessel density, they did not correlate with optic nerve head vessel density. They hypothesized that this may be due to the fact that in acute non-arteritic ischemic optic neuropathy, disc swelling may cause additional damage to neighboring capillaries within the optic nerve head, leading to more diffusely reduced vessel density within the optic nerve head (Hata, Oishi et al. 2016). Falavarjani et al. also recently described the findings of 21 eyes with disc edema, pseudoedema, or atrophy as compared to healthy normal eyes using SS-OCTA. They observed reduced peripapillary microvasculature in the regions of RNFL loss. In Lebers hereditary optic neuropathy patients with pseudo-disc edema, they were able to visualize telangectactic vessels characteristic of the disease (Ghasemi Falavarjani, Tian et al. 2016). These findings have also been observed by others (De Rojas, Rasool et al. 2016, Takayama, Ito et al. 2016). As with glaucoma, OCTA has great potential to explore many unanswered questions about the specific vascular mechanisms underlying several optic nerve disorders.
8.6 Age-Related Macular Degeneration (AMD)
AMD can be classified as early, intermediate, or late depending on the presence of drusen, pigmentary changes, geographic atrophy, and CNV (Ferris, Wilkinson et al. 2013). While structural OCT can be used for the routine diagnosis and monitoring of these AMD stages in patients (Rosenfeld 2016), OCTA greatly facilitates the diagnosis and management of macular neovascularization by directly and non-invasively visualizing the neovascularization within the macula, even in the absence of exudation (Figure 10). OCTA can monitor changes in the size and configuration of the neovascular complex before exudation begins and before treatment is initiated. In addition, OCTA is useful for following changes in the neovascular complex while treatment is underway with inhibitors of vascular endothelial growth factor.
8.6.1 Neovascular or Wet Age-Related Macular Degeneration (NVAMD)
Traditionally, three types of neovascularization in AMD have been described based on the location of abnormal vessels in subjects with AMD. Dye-based angiography has been used to infer the type of neovascularization in the clinical setting but is not always definitive (Freund, Zweifel et al. 2010). The location of CNV can also be frequently identified based on structural OCT but the presence of subretinal hypereflective material can make it difficult to determine the nature of structural OCT changes. With different OCTA segmentation strategies, it is now possible to visualize neovascularization directly as shown in Figure 10: neovascularization under the RPE (Type 1) (Moult, Choi et al. 2014, Kuehlewein, Bansal et al. 2015), under retina and above the RPE (Type 2) (El Ameen, Cohen et al. 2015), and within the retina (type 3) (Phasukkijwatana, Tan et al. 2016, Tan, Dansingani et al. 2016). Both Type 1 and Type 2 neovascularization are derived from the choroidal circulation and are referred to as CNV. However, type 3 neovascularization arises directly from the retinal circulation and is initially found within the retina. Type 3 neovascularization is also referred to as retinal angiomatous proliferation. Studies have compared the detection of CNV using OCTA and traditional dye-based angiographic imaging, and SD-OCTA appeared to be inferior to FA for the detection the CNV (Costanzo, Miere et al. 2016, Gong, Yu et al. 2016, Inoue, Jung et al. 2016); however, OCTA did prove useful in many of the cases. For the best visualization of CNV under the RPE, a longer wavelength of light is probably necessary, which should result in better penetration through the RPE, less sensitivity roll-off, and a better signal to noise ratio. Compared with SD-OCTA, which uses a center wavelength of 840-nm, SS-OCTA uses a longer wavelength of ~1050-nm. Three groups have reported that SS-OCTA imaging was better than SD-OCTA for identifying more of the CNV based on boundary identification and detection of discrete lesion characteristics (Novais, Adhi et al. 2016, Told, Ginner et al. 2016). However, a limitation of these studies was the use of different segmentation strategies to visualize the full extent of the neovascular lesions in the two imaging techniques. A recent study done by Miller et al avoided this limitation by using the same segmentation strategy for both imaging techniques. The boundaries of their en face segmentation slab extended from the outer retina to the choriocapillaris (ORCC slab). In addition, a proprietary projection artifact removal algorithm (Zhang, Zhang et al. 2015) was applied to all scans. The results showed that the areas of the neovascularization were measured to be larger with SS-OCTA than with SD-OCTA, and this difference was greater for the 6×6mm2 scans (Miller, Roisman et al. 2017). SS-OCTA can also be used to reliably identify subclinical Type 1 CNV in asymptomatic eyes with the clinical diagnosis of “dry AMD”, also known as non-exudative intermediate AMD (Roisman, Zhang et al. 2016). In addition, OCTA has been a useful tool for identifying the presence or absence of choroidal neovascularization in some masquerade conditions, such as adult-onset foveomacular vitelliform dystrophy (Querques, Zambrowski et al. 2016) and central serous chorioretinopathy (Bonini Filho, de Carlo et al. 2015). For NVAMD, OCT has served as a way to indirectly assess the levels of vascular endothelial growth factor (VEGF) by detecting the absence or presence of exudation or macular fluid. The absence or presence of exudation and whether the volume of a retinal pigment epithelial detachment was changing have proven to be useful OCT indicators for whether therapy with anti-VEGF agents are needed (Rosenfeld 2016) (Penha, Rosenfeld et al. 2012, de Amorim Garcia Filho, Penha et al. 2013, Thorell, Nunes et al. 2014). Rather than rely on these indirect measures of neovascular activity, OCTA is able to directly visualize the neovascularization and determine whether there are changes in the neovascular lesion that precede the onset or recurrence of exudation, which might allow for more precise management of NVAMD using anti-VEGF (Muakkassa, Chin et al. 2015, Dolz-Marco, Phasukkijwatana et al. 2016). If changes observed during OCTA imaging can be used to predict impending exudation, then it might be possible to avoid any future exudation in eyes with non-exudative dry AMD, which contain subclinical neovascular complexes, or in eyes with established exudative disease, in which the exudation is being suppressed with anti-vascular endothelial growth factor therapy using a “treat-and-observe” or “treat-and-extend” strategy. These changes in the shape and complexity of neovascular complexes may help guide clinicians when deciding whether to observe or extend an interval between anti-VEGF injections. Moreover, the ability to acquire both structure and flow information noninvasively from a single OCT data-set suggests that OCT imaging will replace most, if not all, of the current imaging now performed using dye-based angiography for the routine management of AMD patients. Now that artifact removal and CNV quantification algorithms are available, it seems likely that SS-OCTA will become the superior imaging technique for the diagnosis and management of NVAMD patients (Zhang, Zhang et al., Jia, Bailey et al. 2014, Liu, Gao et al. 2015, Zhang, Zhang et al. 2015). However, studies are needed to identify the OCTA parameters that will unambiguously identify neovascularization in AMD patients.
8.6.2 Non-exudative or Dry Age Related Macular Degeneration
Non-exudative AMD in the absence of any CNV accounts for most AMD and is one of the leading causes of vision loss in people over 60 years of age in the developed world (Friedman, O’Colmain et al. 2004, Velez-Montoya, Oliver et al. 2013). In its early stages, non-exudative AMD is characterized by the presence of drusen and pigment abnormalities, and in its later stage, by the presence of geographic atrophy, which correlates with the loss of photoreceptors, RPE, and choriocapillaris (Ferris, Wilkinson et al. 2013, Nunes, Gregori et al. 2013). The pathological events leading from early-stage dry AMD to late-stage dry AMD remain poorly understood. However, both histological and OCT-based studies have shown that the earliest detectable changes that characterize the progression of disease occur at the level of the photoreceptors, RPE, Bruch’s membrane, and choriocapillaris (McLeod, Grebe et al. 2009, Wu, Luu et al. 2014). While the initial triggering event remains unknown and is thought to involve complement activation, it still isn’t known where this initial insult occurs; however, the choriocapillaris has garnered the most interest. Until recently, the choriocapillaris hasn’t been able to be visualized in situ. However, with the advent of OCTA, it is now possible to visualize a vascular layer thought to be the choriocapillaris and to correlate the vascular changes in this layer with structural changes in the outer retina and RPE. Several studies have reported visualizing choriocapillaris in situ in both healthy subjects and AMD patients (Choi, Moult et al. 2015, Moult, Waheed et al. 2016, Nesper, Soetikno et al. 2016, Spaide 2016). Due to the limitations of SD-OCTA and its shorter wavelength, the choriocapillaris changes detected using SD-OCTA imaging are often difficult to distinguish apart from the shadowing effect from signal attenuation caused by drusen and the RPE (Nesper, Soetikno et al. 2016, Spaide 2016). Thus, SS-OCTA systems have proven to be more reliable for visualizing the choriocapillaris signals. Fujimoto’s group used an ultrahigh-speed, SS-OCTA technique to convincingly visualize alterations in the choriocapillaris vasculature (Choi, Moult et al. 2015). By using variable interscan time analysis (VISTA), they showed that SS-OCTA can distinguish varying degrees of choriocapillaris alteration and flow impairment under and around regions of geographic atrophy. Later, the same group studied the eyes with nascent geographic atrophy and drusen associated geographic atrophy (Moult, Waheed et al. 2016). They not only found focal choriocapillaris flow impairment associated with both of these forms of geographic atrophy, they also showed diffused choriocapillaris flow impairment throughout their field-of-view. By documenting these earliest changes in choriocapillaris flow before anatomic abnormalities are observed, SS-OCTA imaging should prove invaluable for studying the onset and progression of AMD and for studying the new therapies designed to prevent vision loss.
8.7. Uveitis
Macular abnormalities such as macular edema and choroidal neovascularization are a frequent complication of uveitis. For example, the intraocular inflammation in uveitis is hypothesized to result from the release of inflammatory cytokines that disrupt the inner and outer blood-retinal-barrier, in addition to other structural changes (Freeman, Matos et al. 2001). While choroidal neovascularization is a focal phenomenon, macular edema occurs regardless of the primary location of uveitis, probably due to diffusion of inflammatory mediators. Quantitative and objective analysis of macular involvement in uveitis has largely been limited to measuring retinal thickness with OCT (Antcliff, Stanford et al. 2000). Widefield FA has become an essential part of uveitis management, but it is still a qualitative tool and is largely used for evaluation of the retinal periphery (Hong, Nazari Khanamiri et al. 2013). The macular complications of uveitis present an important disease entity where OCTA can be applied. A few investigators have already begun to explore this potential (de Carlo, Bonini Filho et al. 2015, Hassan, Agarwal et al. 2016, Kim, Rodger et al. 2016, Levison, Baynes et al. 2016, Moysidis, Koulisis et al. 2016). Just as in DR and RVO, OCTA provides excellent resolution of capillary changes in the macula in subjects with vascular complications of uveitis (Figure 11) and has already been shown to be superior to FA in some cases (Levison, Baynes et al. 2016).
Figure 11.

Subject with microscopic polyangitis and macular edema. (A) Depth encoded OCTA shows diffuse and severe vascular changes in the superior macula. There are focal dilatations of the capillaries and regions of microaneurysmal changes. (B) Superficial retinal layer and (C) DRL slabs shown separately for clarity. (D) B-scan through the fovea from OCTA dataset shows macular edema.
OCTA can also potentially play a unique role in defining subclinical microvascular changes that are hypothesized to lead to macular edema. In a recent study, Kim et al. used SD-OCTA based metrics to quantitatively assess the density and morphology of parafoveal retinal capillaries in subjects with a history of uveitis (Kim, Rodger et al. 2016). This study addressed a number of important questions including: are there differences in macular capillary density or morphology (1) between uveitic eyes and healthy eyes? (2) between uveitic eyes with macular edema and those without macular edema? And (3) between uveitic eyes with different anatomic foci of disease activity? This study is also unique in that the investigators used three different image-processing and retinal segmentation algorithms to validate the reliability of their findings. The authors showed that there are significant qualitative and quantitative changes in the parafoveal capillary density and morphology of subjects with uveitis that can be reliably detected using OCTA. The differences identified between healthy and uveitic eyes were consistent and significant whether layer boundaries were defined by semi-automated or manual segmentation methods (Kim, Rodger et al. 2016). These findings strongly suggest that quantitative assessment of parafoveal capillary density and morphology are clinically important and measurable parameters for uveitis.
8.8 Macular Telangiectasia Type 2 (MacTel2)
MacTel2 is a bilateral retinal disease that primarily involves the capillaries of the parafoveal macula (Gass and Blodi 1993, Charbel Issa, Gillies et al. 2013). Although the exact cause of MacTel2 is unknown, clinical and pathologic studies demonstrate loss of retinal transparency, intraretinal crystals, and telangiectatic-like vascular changes that are thought to originate in the deep retinal capillary plexus during the early nonproliferative stages of the disease (Green, Quigley et al. 1980). Neovascularization can arise from the retinal vessels and can extend into the subretinal or sub-RPE space leading to exudation and fibrosis (Charbel Issa, Gillies et al. 2013). This is known as proliferative MacTel2. OCT has been used to accurately identify structural abnormalities in the inner retina including retinal cavitation, disruption of the outer retinal banding patterns, but does not clearly demonstrate anomalous vessels (Charbel Issa, Gillies et al. 2013, Nunes, Goldhardt et al. 2015). Since there is no known pathology involving the peripheral retina in this disease, OCTA is an ideal imaging modality to comprehensively characterize and follow the vascular changes that occur in the macula (Roisman and Rosenfeld 2016).
Several studies have demonstrated the application of OCTA to MacTel2 (Thorell, Zhang et al. 2014, Spaide, Klancnik et al. 2015, Zhang, Wang et al. 2015, Toto, Di Antonio et al. 2016). In 2014, a study using SS-OCTA of 41 eyes of 22 subjects with non-proliferative and proliferative stages of MacTel2 demonstrated that OCTA is an ideal modality for qualitatively demonstrating the retinal vascular changes in all stages of this disease (Thorell, Zhang et al. 2014). The investigators concluded that there was obvious agreement between OCTA and FA and that the microvascular changes were better visualized with OCTA in all stages of the disease. While FA demonstrates modest abnormal hyperfluorescence and leakage from the juxtafoveal capillaries in the early stages of MacTel2, later stages of the disease can be characterized by non-specific diffuse hyperfluorescence making it difficult to identify neovascularization on FA. The authors showed that the abnormal vasculature first appears in the deep parafoveal temporal capillary plexus and extends to the superficial capillary plexus. It then extends around the fovea while also extending to outer retina, which is usually avascular. On the other hand, the absence of diffuse staining or leakage on OCTA allows accurate visualization of the abnormal microvasculature and the neovascularization that arises. Figure 12 illustrates the typical findings from eyes with MacTel2 showing different stages based on spectral domain OCTA imaging (Figure 12A, early non-proliferative MacTel2; Figure 12B, intermediate non-proliferative MacTel2; Figure 12C and 12D, proliferative MacTel2).
Figure 12.

Spectral Domain OCTA of subjects with various stages of macular telangiectasia type 2 (MacTel2). (A1–4) Early non-proliferative MacTel2. (A1) Depth encoded en face retina flow image of the left eye shows the early subtle changes of retina microvasculature temporal to the fovea. The depth-encoded color flow image of the retinal layers depicts the superficial capillary plexus as red, the deep capillary plexus as green, and the avascular retina as blue. Due to this color-coding, it’s possible to appreciate that the early change of retina vessels begin from the deep retina. (A2) The en face intensity image shows intra-retinal cysts that appear as areas of decreased reflectivity (arrow). (A3–4) Corresponding B-scans with the slab segmentations lines, with and without the flow signal. Note that the cystic cavity with drapping of the internal limiting membrane can be appreciated on cross-sectional B-scan and correspond to the areas of decreased reflectivity seen on the en face image. (B1–4) Intermediate non-proliferative MacTel2. (B1) Depth encoded en face retina flow image of the left eye shows the the abnormal microvasculature involving all the parafoveal retinal plexuses. (B2) The en face intensity image shows intra-retinal areas of decreased reflectivity corresponding to intraretinal cavities (arrow). (B3–4) Corresponding B-scans with the slab segmentations lines, with and without the flow signal. Note that the retinal cavity can be appreciated along with disruption of the photoreceptor inner-–outer-segment band (ellipsoid zone). (C1–4) Proliferative MacTel2. (C1) Depth encoded en face retina flow image of the left eye showing anastomosis between the superficial and deep retina vessels and a proliferative tangle corresponding to the neovascularization. (C2) The en face intensity image shows intra-retinal areas of decreased reflectivity corresponding to an intraretinal cavity (arrow). (C3–4) Corresponding B-scans with the slab segmentations lines, with and without the flow signal. Note that the thickening of retina temporal to the fovea and the dilated microvasculature. (D1–4) Same subject with proliferative MacTel2 as in C, but the outer retinal slab is selected, which is normally an avascular layer. (D1) Outer retinal en face flow image of the left eye with projection artifact removal showing the neovascularization. (D2) The en face intensity image showing the shadows from the superficial retinal vasculature. (D3–4) Corresponding B-scans with the slab segmentations lines, with and without the flow signal. Note that the segmentation lines are located in the outer retina.
In 2016, a study used three-dimensional volume rendered OCTA to demonstrate the relationship of vascular and neurosensory tissue changes in 24 eyes of 16 subjects with MacTel2 (Spaide, Klancnik et al. 2015). Because OCTA images are derived from OCT, the scaling and spatial relationship between vessels and neurosensory tissue are preserved between the two imaging modalities. This study was able to demonstrate that areas of cavitation were topographically associated with posteriorly displaced vessels. In addition, the vascular changes were attributed to contraction of retinal tissue, rather than just tissue loss. Unfortunately, no longitudinal studies with volume-rendered OCTA exist so the exact evolution of these changes could not be validated. Collectively, the current studies reviewed above suggest that MacTel2 is a disease in which OCTA can be used for all aspects of management with equal or greater efficacy to FA.
The proliferative form of MacTel2 involves the development of neovascularization that primarily arises from the abnormal parafoveal microvasculature and extends under the retinal circulation as shown by Zhang et al. (Zhang, Wang et al. 2015). In this study, they were able to unambiguously demonstrate that this presumed subretinal neovascularization communicated with the choroidal circulation. This was confirmed on ICG angiography and seen on SS-OCTA. While a choroidal contribution may not be present in all MacTel2 eyes with subretinal neovascularization, it seems to be present in those eyes with exudation associated with an increase in macular thickness, which can be effectively treated with anti-VEGF therapy. After treatment, the contribution from the choroidal circulation to this neovascular complex is even more evident.
10. Conclusions and Future Directions
OCTA has yet to achieve broadly accepted and definitive clinical indications but it is clearly on the path to becoming a revolutionary tool in the diagnosis and management of retinal vascular diseases. While commercial OCTA devices have only been available for a few years, the clinical and research impact of these systems is growing rapidly. Clinical adoption of the commercial systems has been rapid, despite several logistical hurdles, including the lack of reimbursement and questions regarding the role of OCTA, FA, and ICG. Nevertheless, it is clear that OCTA is at least as good as invasive dye studies for the macular complications of retinal diseases, such as DR and RVO. The main limitation of OCTA in clinical applications for these diseases is the field-of-view, but that will likely change as commercial systems adopt larger scan patterns. The recent announcement of the FDA approval of the SS-OCTA PLEX® Elite 9000 system (Carl Zeiss Meditec), which has up to a 12-mm2 field-of-view and is designed for research applications to better understand the clinical potential of OCTA, is a clear example of this. Another limitation of SD-OCTA systems is the difficulty with detecting CNV in diseases such as AMD. SS-OCTA systems (e.g. PLEX® Elite 9000) with longer wavelengths of coherent light will likely overcome these limitations although these systems are still very early in their clinical evolution. For the spectrum of retinal vascular disease that have been managed with invasive dye studies, it is very likely that OCTA will gradually become the dominant modality for both diagnosis and management. For diseases such as glaucoma, OCTA provides a novel tool to assess the peripapillary capillary plexus which was not previously visualized on any commercial imaging modality. Lastly, for all of these clinical applications, there will be an ongoing struggle to understand 3D vascular and anatomic structures in 2D, until we develop computational methods that can provide fast, reliable, and meaningful 3D representations and quantifications of the data. Given the speed with which clinical interest is evolving around OCTA, it will not be long before all of these limitations will be overcome. It is our opinion that OCTA stands to change the practice of ophthalmology in the next 10 years as profoundly as OCT has changed it in the past 10 years.
Highlights.
OCTA images are based on the variable backscattering of light from the vascular and neurosensory tissue in the retina and provide reliable, high resolution, and non-invasive images of the retinal vasculature in a clinically feasible manner.
OCTA images are approaching histology level resolution and can reliably demonstrate areas of impaired perfusion, microaneurysms, capillary remodeling, some types of intraretinal fluid, and neovascularization within the macula.
OCTA provides high-resolution and depth-resolved information that has never before been available with dye based angiography methods such as fluorescein angiography.
OCTA can demonstrate clinically significant features of prevalent retinal vascular diseases such as diabetic retinopathy, retinal venous occlusion, age-related macular degeneration, glaucoma and uveitis.
Quantitative OCTA metrics are being developed and show good correlation with clinical disease severity in several diseases including diabetic retinopathy, retinal venous occlusion, and uveitis.
A key limitation of current FDA approved spectral domain OCTA systems is the limited resolution of lesions underneath the retinal pigment epithelium and the field-of-view that is limited to the macula. Swept-source OCTA devices are very likely to overcome these limitations in the near future.
A key limitation of current OCTA metrics and imaging methods is that results are displayed and interpreted in a two-dimensional manner and encompass only the macula. Future advances in three-dimensional and wide-field metrics and rendering methods are promising to provide more accurate and novel information about retinal vascular changes in various diseases.
Acknowledgments
The authors would like to thank Arpine Galstyan for editorial and technical help with putting the manuscript as well as Anoush Shahidzadeh for help with the figures.
Footnotes
Financial Disclosures:
AHK: NIH K08EY027006, Carl Zeiss Meditec, RPB
CLC: None
JKG: None
GMR: Carl Zeiss Meditec
RKW: NIH, Carl Zeiss Meditec
YS: NIH R21EY027879
PJR: Carl Zeiss Meditec
Publisher's Disclaimer: This is a PDF file of an unedited manuscript that has been accepted for publication. As a service to our customers we are providing this early version of the manuscript. The manuscript will undergo copyediting, typesetting, and review of the resulting proof before it is published in its final citable form. Please note that during the production process errors may be discovered which could affect the content, and all legal disclaimers that apply to the journal pertain.
References
- Classification of diabetic retinopathy from fluorescein angiograms. ETDRS report number 11. Early Treatment Diabetic Retinopathy Study Research Group. Ophthalmology. 98(5 Suppl):807–822. [PubMed] [Google Scholar]
- Adhi M, Filho MA, Louzada RN, Kuehlewein L, de Carlo TE, Baumal CR, Witkin AJ, Sadda SR, Sarraf D, Reichel E, Duker JS, Waheed NK. Retinal Capillary Network and Foveal Avascular Zone in Eyes with Vein Occlusion and Fellow Eyes Analyzed With Optical Coherence Tomography Angiography. Invest Ophthalmol Vis Sci. 2016;57(9):OCT486–494. doi: 10.1167/iovs.15-18907. [DOI] [PubMed] [Google Scholar]
- Adhi M, Filho MAB, Louzada RN, Kuehlewein L, de Carlo TE, Baumal CR, Witkin AJ, Sadda SR, Sarraf D, Reichel E, Duker JS, Waheed NK. Retinal Capillary Network and Foveal Avascular Zone in Eyes with Vein Occlusion and Fellow Eyes Analyzed With Optical Coherence Tomography Angiography. Investigative Ophthalmology & Visual Science. 2016;57(9):OCT486–489. doi: 10.1167/iovs.15-18907. [DOI] [PubMed] [Google Scholar]
- Agemy SA, Scripsema NK, Shah CM, Chui T, Garcia PM, Lee JG, Gentile RC, Hsiao Y-S, Zhou Q, Ko T, Rosen RB. RETINAL VASCULAR PERFUSION DENSITY MAPPING USING OPTICAL COHERENCE TOMOGRAPHY ANGIOGRAPHY IN NORMALS AND DIABETIC RETINOPATHY PATIENTS. Retina (Philadelphia, Pa) 0002;35(11):1–11. doi: 10.1097/IAE.0000000000000862. [DOI] [PubMed] [Google Scholar]
- Agemy SA, Scripsema NK, Shah CM, Chui T, Garcia PM, Lee JG, Gentile RC, Hsiao YS, Zhou Q, Ko T, Rosen RB. Retinal Vascular Perfusion Density Mapping Using Optical Coherence Tomography Angiography in Normals and Diabetic Retinopathy Patients. Retina. 2015;35(11):2353–2363. doi: 10.1097/IAE.0000000000000862. [DOI] [PubMed] [Google Scholar]
- Akagi T, Iida Y, Nakanishi H, Terada N, Morooka S, Yamada H, Hasegawa T, Yokota S, Yoshikawa M, Yoshimura N. Microvascular Density in Glaucomatous Eyes With Hemifield Visual Field Defects: An Optical Coherence Tomography Angiography Study. Am J Ophthalmol. 2016;168:237–249. doi: 10.1016/j.ajo.2016.06.009. [DOI] [PubMed] [Google Scholar]
- Al-Sheikh M, Akil H, Pfau M, Sadda SR. Swept-Source OCT Angiography Imaging of the Foveal Avascular Zone and Macular Capillary Network Density in Diabetic Retinopathy. Investigative Ophthalmology & Visual Science. 2016;57(8):3907–3907. doi: 10.1167/iovs.16-19570. [DOI] [PubMed] [Google Scholar]
- Alnawaiseh M, Lahme L, Treder M, Rosentreter A, Eter N. Short-Term Effects of Exercise on Optic Nerve and Macular Perfusion Measured by Optical Coherence Tomography Angiography. Retina. 2016 doi: 10.1097/IAE.0000000000001419. [DOI] [PubMed] [Google Scholar]
- Alterman M, Henkind P. Radial peripapillary capillaries of the retina. II. Possible role in Bjerrum scotoma. Br J Ophthalmol. 1968;52(1):26–31. doi: 10.1136/bjo.52.1.26. [DOI] [PMC free article] [PubMed] [Google Scholar]
- An L, Johnstone M, Wang RK. Optical microangiography provides correlation between microstructure and microvasculature of optic nerve head in human subjects. J Biomed Opt. 2012;17(11):116018. doi: 10.1117/1.JBO.17.11.116018. [DOI] [PMC free article] [PubMed] [Google Scholar]
- An L, Qin J, Wang RK. Ultrahigh sensitive optical microangiography for in vivo imaging of microcirculations within human skin tissue beds. Opt Express. 2010;18(8):8220–8228. doi: 10.1364/OE.18.008220. [DOI] [PMC free article] [PubMed] [Google Scholar]
- An L, Shen TT, Wang RK. Using ultrahigh sensitive optical microangiography to achieve comprehensive depth resolved microvasculature mapping for human retina. J Biomed Opt. 2011;16(10):106013. doi: 10.1117/1.3642638. [DOI] [PMC free article] [PubMed] [Google Scholar]
- An L, Wang RK. In vivo volumetric imaging of vascular perfusion within human retina and choroids with optical micro-angiography. Opt Express. 2008;16(15):11438–11452. doi: 10.1364/oe.16.011438. [DOI] [PubMed] [Google Scholar]
- Antcliff RJ, Stanford MR, Chauhan DS, Graham EM, Spalton DJ, Shilling JS, Ffytche TJ, Marshall J. Comparison between optical coherence tomography and fundus fluorescein angiography for the detection of cystoid macular edema in patients with uveitis. Ophthalmology. 2000;107(3):593–599. doi: 10.1016/s0161-6420(99)00087-1. [DOI] [PubMed] [Google Scholar]
- Arend O, Harris A, Sponsel WE, Remky A, Reim M, Wolf S. Macular capillary particle velocities: a blue field and scanning laser comparison. Graefes Arch Clin Exp Ophthalmol. 1995;233(4):244–249. doi: 10.1007/BF00183599. [DOI] [PubMed] [Google Scholar]
- Arend O, Wolf S, Harris A, Reim M. The relationship of macular microcirculation to visual acuity in diabetic patients. Arch Ophthalmol. 1995;113(5):610–614. doi: 10.1001/archopht.1995.01100050078034. [DOI] [PubMed] [Google Scholar]
- Avila CP, Bartsch DU, Bitner DG, Cheng L, Mueller AJ, Karavellas MP, Freeman WR. Retinal blood flow measurements in branch retinal vein occlusion using scanning laser Doppler flowmetry. Am J Ophthalmol. 1998;126(5):683–690. doi: 10.1016/s0002-9394(98)00114-7. [DOI] [PubMed] [Google Scholar]
- Barton J, Stromski S. Flow measurement without phase information in optical coherence tomography images. Opt Express. 2005;13(14):5234–5239. doi: 10.1364/opex.13.005234. [DOI] [PubMed] [Google Scholar]
- Bedggood P, Metha A. Direct visualization and characterization of erythrocyte flow in human retinal capillaries. Biomed Opt Express. 2012;3(12):3264–3277. doi: 10.1364/BOE.3.003264. [DOI] [PMC free article] [PubMed] [Google Scholar]
- Bennett AG, Rudnicka AR, Edgar DF. Improvements on Littmann’s method of determining the size of retinal features by fundus photography. Graefes Arch Clin Exp Ophthalmol. 1994;232(6):361–367. doi: 10.1007/BF00175988. [DOI] [PubMed] [Google Scholar]
- Benya R, Quintana J, Brundage B. Adverse reactions to indocyanine green: a case report and a review of the literature. Cathet Cardiovasc Diagn. 1989;17(4):231–233. doi: 10.1002/ccd.1810170410. [DOI] [PubMed] [Google Scholar]
- Bhanushali D, Anegondi N, Gadde SGK, Srinivasan P, Chidambara L, Yadav NK, Sinha Roy A. Linking Retinal Microvasculature Features With Severity of Diabetic Retinopathy Using Optical Coherence Tomography Angiography. Investigative Ophthalmology & Visual Science. 2016;57(9):OCT519–517. doi: 10.1167/iovs.15-18901. [DOI] [PubMed] [Google Scholar]
- Bojikian KD, Chen CL, Wen JC, Zhang Q, Xin C, Gupta D, Mudumbai RC, Johnstone MA, Wang RK, Chen PP. Optic Disc Perfusion in Primary Open Angle and Normal Tension Glaucoma Eyes Using Optical Coherence Tomography-Based Microangiography. PLoS One. 2016;11(5):e0154691. doi: 10.1371/journal.pone.0154691. [DOI] [PMC free article] [PubMed] [Google Scholar]
- Bolz M, Kriechbaum K, Simader C, Deak G, Lammer J, Treu C, Scholda C, Prünte C, Schmidt-Erfurth U, Vienna DRRG. In vivo retinal morphology after grid laser treatment in diabetic macular edema. Ophthalmology. 2010;117(3):538–544. doi: 10.1016/j.ophtha.2009.07.035. [DOI] [PubMed] [Google Scholar]
- Bonini Filho MA, Adhi M, de Carlo TE, Ferrara D, Baumal CR, Witkin AJ, Reichel E, Kuehlewein L, Sadda SR, Sarraf D, Duker JS, Waheed NK. Optical Coherence Tomography Angiography in Retinal Artery Occlusion. Retina. 2015;35(11):2339–2346. doi: 10.1097/IAE.0000000000000850. [DOI] [PubMed] [Google Scholar]
- Bonini Filho MA, de Carlo TE, Ferrara D, Adhi M, Baumal CR, Witkin AJ, Reichel E, Duker JS, Waheed NK. Association of Choroidal Neovascularization and Central Serous Chorioretinopathy With Optical Coherence Tomography Angiography. JAMA Ophthalmol. 2015;133(8):899–906. doi: 10.1001/jamaophthalmol.2015.1320. [DOI] [PMC free article] [PubMed] [Google Scholar]
- Bresnick GH, Condit R, Syrjala S, Palta M, Groo A, Korth K. Abnormalities of the foveal avascular zone in diabetic retinopathy. Arch Ophthalmol. 1984;102(9):1286–1293. doi: 10.1001/archopht.1984.01040031036019. [DOI] [PubMed] [Google Scholar]
- Burgansky-Eliash Z, Lowenstein A, Neuderfer M, Kesler A, Barash H, Nelson DA, Grinvald A, Barak A. The correlation between retinal blood flow velocity measured by the retinal function imager and various physiological parameters. Ophthalmic Surg Lasers Imaging Retina. 2013;44(1):51–58. doi: 10.3928/23258160-20121221-13. [DOI] [PubMed] [Google Scholar]
- Burgoyne CF. A biomechanical paradigm for axonal insult within the optic nerve head in aging and glaucoma. Exp Eye Res. 2011;93(2):120–132. doi: 10.1016/j.exer.2010.09.005. [DOI] [PMC free article] [PubMed] [Google Scholar]
- Bursell SE, Clermont AC, Kinsley BT, Simonson DC, Aiello LM, Wolpert HA. Retinal blood flow changes in patients with insulin-dependent diabetes mellitus and no diabetic retinopathy. Invest Ophthalmol Vis Sci. 1996;37(5):886–897. [PubMed] [Google Scholar]
- Camino A, Zhang M, Gao SS, Hwang TS, Sharma U, Wilson DJ, Huang D, Jia Y. Evaluation of artifact reduction in optical coherence tomography angiography with real-time tracking and motion correction technology. Biomedical optics express. 2016;7(10):3905–3911. doi: 10.1364/BOE.7.003905. [DOI] [PMC free article] [PubMed] [Google Scholar]
- Campbell JP, Zhang M, Hwang TS, Bailey ST, Wilson DJ, Jia Y, Huang D. Detailed Vascular Anatomy of the Human Retina by Projection-Resolved Optical Coherence Tomography Angiography. Sci Rep. 2017;7:42201. doi: 10.1038/srep42201. [DOI] [PMC free article] [PubMed] [Google Scholar]
- Campochiaro PA. Molecular pathogenesis of retinal and choroidal vascular diseases. Prog Retin Eye Res. 2015;49:67–81. doi: 10.1016/j.preteyeres.2015.06.002. [DOI] [PMC free article] [PubMed] [Google Scholar]
- Campochiaro PA, Wykoff CC, Shapiro H, Rubio RG, Ehrlich JS. Neutralization of vascular endothelial growth factor slows progression of retinal nonperfusion in patients with diabetic macular edema. Ophthalmology. 2014;121(9):1783–1789. doi: 10.1016/j.ophtha.2014.03.021. [DOI] [PubMed] [Google Scholar]
- Caprioli J, de Leon JM, Azarbod P, Chen A, Morales E, Nouri-Mahdavi K, Coleman A, Yu F, Afifi A. Trabeculectomy Can Improve Long-Term Visual Function in Glaucoma. Ophthalmology. 2016;123(1):117–128. doi: 10.1016/j.ophtha.2015.09.027. [DOI] [PubMed] [Google Scholar]
- Cardoso JN, Keane PA, Sim DA, Bradley P, Agrawal R, Addison PK, Egan C, Tufail A. Systematic Evaluation of Optical Coherence Tomography Angiography in Retinal Vein Occlusion. AJOPHT. 2016;163:93–107.e106. doi: 10.1016/j.ajo.2015.11.025. [DOI] [PubMed] [Google Scholar]
- Carpineto P, Mastropasqua R, Marchini G, Toto L, Di Nicola M, Di Antonio L. Reproducibility and repeatability of foveal avascular zone measurements in healthy subjects by optical coherence tomography angiography. Br J Ophthalmol. 2016;100(5):671–676. doi: 10.1136/bjophthalmol-2015-307330. [DOI] [PubMed] [Google Scholar]
- Casselholmde Salles M, Kvanta A, Amren U, Epstein D. Optical Coherence Tomography Angiography in Central Retinal Vein Occlusion: Correlation Between the Foveal Avascular Zone and Visual Acuity. Invest Ophthalmol Vis Sci. 2016;57(9):OCT242–246. doi: 10.1167/iovs.15-18819. [DOI] [PubMed] [Google Scholar]
- Cense B, Nassif N, Chen T, Pierce M, Yun SH, Park B, Bouma B, Tearney G, de Boer J. Ultrahigh-resolution high-speed retinal imaging using spectral-domain optical coherence tomography. Opt Express. 2004;12(11):2435–2447. doi: 10.1364/opex.12.002435. [DOI] [PubMed] [Google Scholar]
- Chalam KV, Bressler SB, Edwards AR, Berger BB, Bressler NM, Glassman AR, Grover S, Gupta SK, Nielsen JS DR CR Network. Retinal thickness in people with diabetes and minimal or no diabetic retinopathy: Heidelberg Spectralis optical coherence tomography. Invest Ophthalmol Vis Sci. 2012;53(13):8154–8161. doi: 10.1167/iovs.12-10290. [DOI] [PMC free article] [PubMed] [Google Scholar]
- Chalam KV, Sambhav K. Optical Coherence Tomography Angiography in Retinal Diseases. J Ophthalmic Vis Res. 2016;11(1):84–92. doi: 10.4103/2008-322X.180709. [DOI] [PMC free article] [PubMed] [Google Scholar]
- Charbel Issa P, Gillies MC, Chew EY, Bird AC, Heeren TF, Peto T, Holz FG, Scholl HP. Macular telangiectasia type 2. Prog Retin Eye Res. 2013;34:49–77. doi: 10.1016/j.preteyeres.2012.11.002. [DOI] [PMC free article] [PubMed] [Google Scholar]
- Chen CBK, Gupta D, Wen J, Zhang Q, Xin C, Kono R, Mudumbai RC, Johnstone MA, Chen PP, Wang RK. Optic disc perfusion in normal eyes and eyes with glaucoma using optical coherence tomography-based microangiography. 2016 doi: 10.21037/qims.2016.03.05. [DOI] [PMC free article] [PubMed] [Google Scholar]
- Chen CBK, Xin C, Wen J, Gupta D, Zhang Q, Mudumbai RC, Johnstone MA, Chen PP, Wang RK. Repeatability and Reproducibility of Optic Disc Perfusion Measurements Using Optical Coherence Tomography-based Angiography. 2016 doi: 10.1117/1.JBO.21.6.065002. [DOI] [PMC free article] [PubMed] [Google Scholar]
- Chen C, Shi W, Gao W. Imaginary part-based correlation mapping optical coherence tomography for imaging of blood vessels in vivo. J Biomed Opt. 2015;20(11):116009. doi: 10.1117/1.JBO.20.11.116009. [DOI] [PubMed] [Google Scholar]
- Chen CL, Wang RK. Optical coherence tomography based angiography [Invited] Biomed Opt Express. 2017;8(2):1056–1082. doi: 10.1364/BOE.8.001056. [DOI] [PMC free article] [PubMed] [Google Scholar]
- Chen CL, Zhang A, Bojikian KD, Wen JC, Zhang Q, Xin C, Mudumbai RC, Johnstone MA, Chen PP, Wang RK. Peripapillary Retinal Nerve Fiber Layer Vascular Microcirculation in Glaucoma Using Optical Coherence Tomography-Based Microangiography. Invest Ophthalmol Vis Sci. 2016;57(9):Oct475–485. doi: 10.1167/iovs.15-18909. [DOI] [PMC free article] [PubMed] [Google Scholar]
- Chen Z, Milner TE, Srinivas S, Wang X, Malekafzali A, van Gemert MJ, Nelson JS. Noninvasive imaging of in vivo blood flow velocity using optical Doppler tomography. Opt Lett. 1997;22(14):1119–1121. doi: 10.1364/ol.22.001119. [DOI] [PubMed] [Google Scholar]
- Cheung N, Huynh S, Wang JJ, Taylor B, Islam FM, Saw SM, Wong TY, Mitchell P. Relationships of retinal vessel diameters with optic disc, macular and retinal nerve fiber layer parameters in 6-year-old children. Invest Ophthalmol Vis Sci. 2008;49(6):2403–2408. doi: 10.1167/iovs.07-1313. [DOI] [PubMed] [Google Scholar]
- Choi W, Moult EM, Waheed NK, Adhi M, Lee B, Lu CD, de Carlo TE, Jayaraman V, Rosenfeld PJ, Duker JS, Fujimoto JG. Ultrahigh-Speed, Swept-Source Optical Coherence Tomography Angiography in Nonexudative Age-Related Macular Degeneration with Geographic Atrophy. Ophthalmology. 2015;122(12):2532–2544. doi: 10.1016/j.ophtha.2015.08.029. [DOI] [PMC free article] [PubMed] [Google Scholar]
- Choi WJ, Qin W, Chen CL, Wang J, Zhang Q, Yang X, Gao BZ, Wang RK. Characterizing relationship between optical microangiography signals and capillary flow using microfluidic channels. Biomed Opt Express. 2016;7(7):2709–2728. doi: 10.1364/BOE.7.002709. [DOI] [PMC free article] [PubMed] [Google Scholar]
- Choma M, Sarunic M, Yang C, Izatt J. Sensitivity advantage of swept source and Fourier domain optical coherence tomography. Opt Express. 2003;11(18):2183–2189. doi: 10.1364/oe.11.002183. [DOI] [PubMed] [Google Scholar]
- Cicinelli MV, Carnevali A, Rabiolo A, Querques L, Zucchiatti I, Scorcia V, Bandello F, Querques G. CLINICAL SPECTRUM OF MACULAR-FOVEAL CAPILLARIES EVALUATED WITH OPTICAL COHERENCE TOMOGRAPHY ANGIOGRAPHY. Retina (Philadelphia, Pa) 2016:1–8. doi: 10.1097/IAE.0000000000001199. [DOI] [PubMed] [Google Scholar]
- Cole ED, Novais EA, Louzada RN, Moult EM, Lee B-K, Witkin AJ, Waheed NK, Duker JS, Baumal CR. Visualization of Changes in the Choriocapillaris, Choroidal Vessels, and Retinal Morphology After Focal Laser Photocoagulation Using OCT Angiography. Investigative Ophthalmology & Visual Science. 2016;57(9):OCT356–356. doi: 10.1167/iovs.15-18473. [DOI] [PubMed] [Google Scholar]
- Conrath J, Giorgi R, Raccah D, Ridings B. Foveal avascular zone in diabetic retinopathy: quantitative vs qualitative assessment. Eye (Lond) 2005;19(3):322–326. doi: 10.1038/sj.eye.6701456. [DOI] [PubMed] [Google Scholar]
- Coscas F, Glacet-Bernard A, Miere A, Caillaux V, Uzzan J, Lupidi M, Coscas G, Souied EH. Optical Coherence Tomography Angiography in Retinal Vein Occlusion: Evaluation of Superficial and Deep Capillary Plexa. Am J Ophthalmol. 2016;161:160–171. e161–162. doi: 10.1016/j.ajo.2015.10.008. [DOI] [PubMed] [Google Scholar]
- Coscas GJ, Lupidi M, Coscas F, Cagini C, Souied EH. OPTICAL COHERENCE TOMOGRAPHY ANGIOGRAPHY VERSUS TRADITIONAL MULTIMODAL IMAGING IN ASSESSING THE ACTIVITY OF EXUDATIVE AGE-RELATED MACULAR DEGENERATION. Retina (Philadelphia, Pa) 0002;35(11):1–10. doi: 10.1097/IAE.0000000000000766. [DOI] [PubMed] [Google Scholar]
- Costanzo E, Miere A, Querques G, Capuano V, Jung C, Souied EH. Type 1 Choroidal Neovascularization Lesion Size: Indocyanine Green Angiography Versus Optical Coherence Tomography Angiography. Invest Ophthalmol Vis Sci. 2016;57(9):OCT307–313. doi: 10.1167/iovs.15-18830. [DOI] [PubMed] [Google Scholar]
- Couturier A, Mane V, Bonnin S, Erginay A, Massin P, Gaudric A, Tadayoni R. Capillary Plexus Anomalies in Diabetic Retinopathy on Optical Coherence Tomography Angiography. Retina. 2015;35(11):2384–2391. doi: 10.1097/IAE.0000000000000859. [DOI] [PubMed] [Google Scholar]
- Dalimier E, Salomon D. Full-field optical coherence tomography: a new technology for 3D high-resolution skin imaging. Dermatology. 2012;224(1):84–92. doi: 10.1159/000337423. [DOI] [PubMed] [Google Scholar]
- Danis RP, Scott IU, Qin H, Altaweel MM, Bressler NM, Bressler SB, Browning DJ, Kollman C DR CR Network. Association of fluorescein angiographic features with visual acuity and with optical coherence tomographic and stereoscopic color fundus photographic features of diabetic macular edema in a randomized clinical trial. Retina. 2010;30(10):1627–1637. doi: 10.1097/IAE.0b013e3181dde5f5. [DOI] [PMC free article] [PubMed] [Google Scholar]
- Dansingani KK, Tan AC, Gilani F, Phasukkijwatana N, Novais E, Querques L, Waheed NK, Duker JS, Querques G, Yannuzzi LA, Sarraf D, Freund KB. Subretinal Hyperreflective Material Imaged With Optical Coherence Tomography Angiography. Am J Ophthalmol. 2016;169:235–248. doi: 10.1016/j.ajo.2016.06.031. [DOI] [PubMed] [Google Scholar]
- de Amorim Garcia Filho CA, Penha FM, Gregori G, Rosenfeld PJ. Increasing volume of a retinal pigmented epithelial detachment as a predictor of submacular hemorrhage during anti-VEGF therapy. Ophthalmic Surg Lasers Imaging Retina. 2013;44(2):204–207. doi: 10.3928/23258160-20130313-12. [DOI] [PubMed] [Google Scholar]
- de Boer JF, Cense B, Park BH, Pierce MC, Tearney GJ, Bouma BE. Improved signal-to-noise ratio in spectral-domain compared with time-domain optical coherence tomography. Opt Lett. 2003;28(21):2067–2069. doi: 10.1364/ol.28.002067. [DOI] [PubMed] [Google Scholar]
- de Carlo TE, Bonini Filho MA, Adhi M, Duker JS. Retinal and Choroidal Vasculature in Birdshot Chorioretinopathy Analyzed Using Spectral Domain Optical Coherence Tomography Angiography. Retina. 2015;35(11):2392–2399. doi: 10.1097/IAE.0000000000000744. [DOI] [PubMed] [Google Scholar]
- de Carlo TE, Bonini Filho MA, Baumal CR, Reichel E, Rogers A, Witkin AJ, Duker JS, Waheed NK. Evaluation of Preretinal Neovascularization in Proliferative Diabetic Retinopathy Using Optical Coherence Tomography Angiography. Ophthalmic Surg Lasers Imaging Retina. 2016;47(2):115–119. doi: 10.3928/23258160-20160126-03. [DOI] [PubMed] [Google Scholar]
- de Carlo TE, Chin AT, Bonini Filho MA, Adhi M, Branchini L, Salz DA, Baumal CR, Crawford C, Reichel E, Witkin AJ, Duker JS, Waheed NK. Detection of Microvascular Changes in Eyes of Patients with Diabetes but Not Clinical Diabetic Retinopathy Using Optical Coherence Tomography Angiography. Retina. 2015;35(11):2364–2370. doi: 10.1097/IAE.0000000000000882. [DOI] [PubMed] [Google Scholar]
- De Rojas JO, Rasool N, Chen RW, Horowitz J, Odel JG. Optical coherence tomography angiography in Leber hereditary optic neuropathy. Neurology. 2016;87(19):2065–2066. doi: 10.1212/WNL.0000000000003313. [DOI] [PubMed] [Google Scholar]
- Dolz-Marco R, Phasukkijwatana N, Sarraf D, Freund KB. Regression of Type 2 Neovascularization into a Type 1 Pattern after Intravitreal Anti-Vascular Endothelial Growth Factor Therapy for Neovascular Age-Related Macular Degeneration. Retina. 2016 doi: 10.1097/IAE.0000000000001279. [DOI] [PubMed] [Google Scholar]
- Drexler W, Fujimoto JG. State-of-the-art retinal optical coherence tomography. Prog Retin Eye Res. 2008;27(1):45–88. doi: 10.1016/j.preteyeres.2007.07.005. [DOI] [PubMed] [Google Scholar]
- Dubis AM, Hansen BR, Cooper RF, Beringer J, Dubra A, Carroll J. Relationship between the foveal avascular zone and foveal pit morphology. Invest Ophthalmol Vis Sci. 2012;53(3):1628–1636. doi: 10.1167/iovs.11-8488. [DOI] [PMC free article] [PubMed] [Google Scholar]
- Dubois A, Vabre L, Boccara AC, Beaurepaire E. High-resolution full-field optical coherence tomography with a Linnik microscope. Appl Opt. 2002;41(4):805–812. doi: 10.1364/ao.41.000805. [DOI] [PubMed] [Google Scholar]
- El Ameen A, Cohen SY, Semoun O, Miere A, Srour M, Quaranta-El Maftouhi M, Oubraham H, Blanco-Garavito R, Querques G, Souied EH. Type 2 Neovascularization Secondary to Age-Related Macular Degeneration Imaged by Optical Coherence Tomography Angiography. Retina. 2015;35(11):2212–2218. doi: 10.1097/IAE.0000000000000773. [DOI] [PubMed] [Google Scholar]
- Enfield J, Jonathan E, Leahy M. In vivo imaging of the microcirculation of the volar forearm using correlation mapping optical coherence tomography (cmOCT) Biomed Opt Express. 2011;2(5):1184–1193. doi: 10.1364/BOE.2.001184. [DOI] [PMC free article] [PubMed] [Google Scholar]
- Ferrara D, Waheed NK, Duker JS. Investigating the choriocapillaris and choroidal vasculature with new optical coherence tomography technologies. Prog Retin Eye Res. 2016;52:130–155. doi: 10.1016/j.preteyeres.2015.10.002. [DOI] [PubMed] [Google Scholar]
- Ferris FL, 3rd, Wilkinson CP, Bird A, Chakravarthy U, Chew E, Csaky K, Sadda SR, Beckman C Initiative for Macular Research Classification. Clinical classification of age-related macular degeneration. Ophthalmology. 2013;120(4):844–851. doi: 10.1016/j.ophtha.2012.10.036. [DOI] [PMC free article] [PubMed] [Google Scholar]
- Fingler J, Readhead C, Schwartz DM, Fraser SE. Phase-contrast OCT imaging of transverse flows in the mouse retina and choroid. Invest Ophthalmol Vis Sci. 2008;49(11):5055–5059. doi: 10.1167/iovs.07-1627. [DOI] [PubMed] [Google Scholar]
- Fingler J, Schwartz D, Yang C, Fraser SE. Mobility and transverse flow visualization using phase variance contrast with spectral domain optical coherence tomography. Opt Express. 2007;15(20):12636–12653. doi: 10.1364/oe.15.012636. [DOI] [PubMed] [Google Scholar]
- Fingler J, Zawadzki RJ, Werner JS, Schwartz D, Fraser SE. Volumetric microvascular imaging of human retina using optical coherence tomography with a novel motion contrast technique. Opt Express. 2009;17(24):22190–22200. doi: 10.1364/OE.17.022190. [DOI] [PMC free article] [PubMed] [Google Scholar]
- Freeman G, Matos K, Pavesio CE. Cystoid macular oedema in uveitis: an unsolved problem. Eye (Lond) 2001;15(Pt 1):12–17. doi: 10.1038/eye.2001.5. [DOI] [PubMed] [Google Scholar]
- Freund KB, Zweifel SA, Engelbert M. Do we need a new classification for choroidal neovascularization in age-related macular degeneration? Retina. 2010;30(9):1333–1349. doi: 10.1097/IAE.0b013e3181e7976b. [DOI] [PubMed] [Google Scholar]
- Friedman DS, O’Colmain BJ, Munoz B, Tomany SC, McCarty C, de Jong PT, Nemesure B, Mitchell P, Kempen J Eye Diseases Prevalence Research G. Prevalence of age-related macular degeneration in the United States. Arch Ophthalmol. 2004;122(4):564–572. doi: 10.1001/archopht.122.4.564. [DOI] [PubMed] [Google Scholar]
- Gabriele ML, Wollstein G, Ishikawa H, Xu J, Kim J, Kagemann L, Folio LS, Schuman JS. Three dimensional optical coherence tomography imaging: advantages and advances. Prog Retin Eye Res. 2010;29(6):556–579. doi: 10.1016/j.preteyeres.2010.05.005. [DOI] [PMC free article] [PubMed] [Google Scholar]
- Gandolfi SA. Improvement of visual field indices after surgical reduction of intraocular pressure. Ophthalmic Surg. 1995;26(2):121–126. [PubMed] [Google Scholar]
- Gao SS, Jia Y, Zhang M, Su JP, Liu G, Hwang TS, Bailey ST, Huang D. Optical Coherence Tomography Angiography. Investigative Ophthalmology & Visual Science. 2016;57(9):OCT27–10. doi: 10.1167/iovs.15-19043. [DOI] [PMC free article] [PubMed] [Google Scholar]
- Gao SS, Liu G, Huang D, Jia Y. Optimization of the split-spectrum amplitude-decorrelation angiography algorithm on a spectral optical coherence tomography system. Opt Lett. 2015;40(10):2305–2308. doi: 10.1364/OL.40.002305. [DOI] [PMC free article] [PubMed] [Google Scholar]
- Gao SS, Liu G, Huang D, Jia Y. Optimization of the split-spectrum amplitude-decorrelation angiography algorithm on a spectral optical coherence tomography system: erratum. Opt Lett. 2016;41(3):496. doi: 10.1364/OL.41.000496. [DOI] [PMC free article] [PubMed] [Google Scholar]
- Garcia CR, Rivero ME, Bartsch DU, Ishiko S, Takamiya A, Fukui K, Hirokawa H, Clark T, Yoshida A, Freeman WR. Oral fluorescein angiography with the confocal scanning laser ophthalmoscope. Ophthalmology. 1999;106(6):1114–1118. doi: 10.1016/S0161-6420(99)90264-6. [DOI] [PubMed] [Google Scholar]
- Gass JD, Blodi BA. Idiopathic juxtafoveolar retinal telangiectasis. Update of classification and follow-up study. Ophthalmology. 1993;100(10):1536–1546. [PubMed] [Google Scholar]
- Ghasemi Falavarjani K, Iafe NA, Hubschman JP, Tsui I, Sadda SR, Sarraf D. Optical Coherence Tomography Angiography Analysis of the Foveal Avascular Zone and Macular Vessel Density After Anti-VEGF Therapy in Eyes With Diabetic Macular Edema and Retinal Vein Occlusion. Invest Ophthalmol Vis Sci. 2017;58(1):30–34. doi: 10.1167/iovs.16-20579. [DOI] [PubMed] [Google Scholar]
- Ghasemi Falavarjani K, Tian JJ, Akil H, Garcia GA, Sadda SR, Sadun AA. Swept-Source Optical Coherence Tomography Angiography of the Optic Disk in Optic Neuropathy. Retina. 2016;36(Suppl 1):S168–S177. doi: 10.1097/IAE.0000000000001259. [DOI] [PubMed] [Google Scholar]
- Giani A, Luiselli C, Esmaili DD, Salvetti P, Cigada M, Miller JW, Staurenghi G. Spectral-domain optical coherence tomography as an indicator of fluorescein angiography leakage from choroidal neovascularization. Invest Ophthalmol Vis Sci. 2011;52(8):5579–5586. doi: 10.1167/iovs.10-6617. [DOI] [PubMed] [Google Scholar]
- Gong J, Yu S, Gong Y, Wang F, Sun X. The Diagnostic Accuracy of Optical Coherence Tomography Angiography for Neovascular Age-Related Macular Degeneration: A Comparison with Fundus Fluorescein Angiography. J Ophthalmol. 2016;2016:7521478. doi: 10.1155/2016/7521478. [DOI] [PMC free article] [PubMed] [Google Scholar]
- Green WR, Quigley HA, De la Cruz Z, Cohen B. Parafoveal retinal telangiectasis. Light and electron microscopy studies. Trans Ophthalmol Soc U K. 1980;100(Pt 1):162–170. [PubMed] [Google Scholar]
- Grulkowski I, Liu JJ, Potsaid B, Jayaraman V, Lu CD, Jiang J, Cable AE, Duker JS, Fujimoto JG. Retinal, anterior segment and full eye imaging using ultrahigh speed swept source OCT with vertical-cavity surface emitting lasers. Biomed Opt Express. 2012;3(11):2733–2751. doi: 10.1364/BOE.3.002733. [DOI] [PMC free article] [PubMed] [Google Scholar]
- Guyer DR, Yannuzzi LA, Slakter JS, Sorenson JA, Hope-Ross M, Orlock DR. Digital indocyanine-green videoangiography of occult choroidal neovascularization. Ophthalmology. 1994;101(10):1727–1735. doi: 10.1016/s0161-6420(13)31433-x. discussion 1735–1727. [DOI] [PubMed] [Google Scholar]
- Gómez-Ulla F, Gutiérrez C, Seoane I. Severe anaphylactic reaction to orally administered fluorescein. Am J Ophthalmol. 1991;112(1):94. doi: 10.1016/s0002-9394(14)76222-1. [DOI] [PubMed] [Google Scholar]
- Hara T, Inami M. Efficacy and safety of fluorescein angiography with orally administered sodium fluorescein. Am J Ophthalmol. 1998;126(4):560–564. doi: 10.1016/s0002-9394(98)00112-3. [DOI] [PubMed] [Google Scholar]
- Hasegawa N, Nozaki M, Takase N, Yoshida M, Ogura Y. New Insights Into Microaneurysms in the Deep Capillary Plexus Detected by Optical Coherence Tomography Angiography in Diabetic Macular Edema. Investigative Ophthalmology & Visual Science. 2016;57(9):OCT348–348. doi: 10.1167/iovs.15-18782. [DOI] [PubMed] [Google Scholar]
- Hassan M, Agarwal A, Afridi R, daSilva MJ, Karaca I, Sadiq MA, Nguyen QD, Do DV. The Role of Optical Coherence Tomography Angiography in the Management of Uveitis. Int Ophthalmol Clin. 2016;56(4):1–24. doi: 10.1097/IIO.0000000000000130. [DOI] [PubMed] [Google Scholar]
- Hata M, Oishi A, Muraoka Y, Miyamoto K, Kawai K, Yokota S, Fujimoto M, Miyata M, Yoshimura N. Structural and Functional Analyses in Nonarteritic Anterior Ischemic Optic Neuropathy: Optical Coherence Tomography Angiography Study. J Neuroophthalmol. 2016 doi: 10.1097/WNO.0000000000000470. [DOI] [PubMed] [Google Scholar]
- Henkind P. Radial peripapillary capillaries of the retina. I. Anatomy: human and comparative. Br J Ophthalmol. 1967;51(2):115–123. doi: 10.1136/bjo.51.2.115. [DOI] [PMC free article] [PubMed] [Google Scholar]
- Ho AC, Yannuzzi LA, Guyer DR, Slakter JS, Sorenson JA, Orlock DA. Intraretinal leakage of indocyanine green dye. Ophthalmology. 1994;101(3):534–541. doi: 10.1016/s0161-6420(94)31323-6. [DOI] [PubMed] [Google Scholar]
- Hong BK, Nazari Khanamiri H, Rao NA. Role of ultra-widefield fluorescein angiography in the management of uveitis. Can J Ophthalmol. 2013;48(6):489–493. doi: 10.1016/j.jcjo.2013.05.009. [DOI] [PubMed] [Google Scholar]
- Hope-Ross M, Yannuzzi LA, Gragoudas ES, Guyer DR, Slakter JS, Sorenson JA, Krupsky S, Orlock DA, Puliafito CA. Adverse reactions due to indocyanine green. Ophthalmology. 1994;101(3):529–533. doi: 10.1016/s0161-6420(94)31303-0. [DOI] [PubMed] [Google Scholar]
- Horii T, Murakami T, Akagi T, Uji A, Ueda-Arakawa N, Nishijima K, Yoshimura N. Optical coherence tomographic reflectivity of cystoid spaces is related to recurrent diabetic macular edema after triamcinolone. Retina. 2015;35(2):264–271. doi: 10.1097/IAE.0000000000000282. [DOI] [PubMed] [Google Scholar]
- Huang D, Jia Y, Rispoli M, Tan O, Lumbroso B. OPTICAL COHERENCE TOMOGRAPHY ANGIOGRAPHY OF TIME COURSE OF CHOROIDAL NEOVASCULARIZATION IN RESPONSE TO ANTI-ANGIOGENIC TREATMENT. Retina (Philadelphia, Pa) 0002;35(11):1–5. doi: 10.1097/IAE.0000000000000846. [DOI] [PMC free article] [PubMed] [Google Scholar]
- Huang D, Swanson EA, Lin CP, Schuman JS, Stinson WG, Chang W, Hee MR, Flotte T, Gregory K, Puliafito CA. Optical coherence tomography. Science. 1991;254(5035):1178–1181. doi: 10.1126/science.1957169. [DOI] [PMC free article] [PubMed] [Google Scholar]
- Huang Y, Zhang Q, Thorell MR, An L, Durbin MK, Laron M, Sharma U, Gregori G, Rosenfeld PJ, Wang RK. Swept-source OCT angiography of the retinal vasculature using intensity differentiation-based optical microangiography algorithms. Ophthalmic Surg Lasers Imaging Retina. 2014;45(5):382–389. doi: 10.3928/23258160-20140909-08. [DOI] [PMC free article] [PubMed] [Google Scholar]
- Hwang TS, Jia Y, Gao SS, Bailey ST, Lauer AK, Flaxel CJ, Wilson DJ, Huang D. Optical Coherence Tomography Angiography Features of Diabetic Retinopathy. Retina. 2015;35(11):2371–2376. doi: 10.1097/IAE.0000000000000716. [DOI] [PMC free article] [PubMed] [Google Scholar]
- Hwang TS, Zhang M, Bhavsar K, Zhang X, Campbell JP, Lin P, Bailey ST, Flaxel CJ, Lauer AK, Wilson DJ, Huang D, Jia Y. Visualization of 3 Distinct Retinal Plexuses by Projection-Resolved Optical Coherence Tomography Angiography in Diabetic Retinopathy. JAMA Ophthalmol. 2016;134(12):1411–1419. doi: 10.1001/jamaophthalmol.2016.4272. [DOI] [PMC free article] [PubMed] [Google Scholar]
- Iafe NA, Phasukkijwatana N, Chen X, Sarraf D. Retinal Capillary Density and Foveal Avascular Zone Area Are Age-Dependent: Quantitative Analysis Using Optical Coherence Tomography Angiography. Invest Ophthalmol Vis Sci. 2016;57(13):5780–5787. doi: 10.1167/iovs.16-20045. [DOI] [PubMed] [Google Scholar]
- Inoue M, Jung JJ, Balaratnasingam C, Dansingani KK, Dhrami-Gavazi E, Suzuki M, de Carlo TE, Shahlaee A, Klufas MA, El Maftouhi A, Duker JS, Ho AC, Maftouhi MQ, Sarraf D, Freund KB C-S Group. A Comparison Between Optical Coherence Tomography Angiography and Fluorescein Angiography for the Imaging of Type 1 Neovascularization. Invest Ophthalmol Vis Sci. 2016;57(9):OCT314–323. doi: 10.1167/iovs.15-18900. [DOI] [PubMed] [Google Scholar]
- Ishibazawa A, Nagaoka T, Takahashi A, Omae T, Tani T, Sogawa K, Yokota H, Yoshida A. Optical Coherence Tomography Angiography in Diabetic Retinopathy: A Prospective Pilot Study. AJOPHT. 2015;160(1):1–11. doi: 10.1016/j.ajo.2015.04.021. [DOI] [PubMed] [Google Scholar]
- Izatt JA, Kulkarni MD, Yazdanfar S, Barton JK, Welch AJ. In vivo bidirectional color Doppler flow imaging of picoliter blood volumes using optical coherence tomography. Opt Lett. 1997;22(18):1439–1441. doi: 10.1364/ol.22.001439. [DOI] [PubMed] [Google Scholar]
- Jia Y, Bailey ST, Hwang TS, McClintic SM, Gao SS. Quantitative optical coherence tomography angiography of vascular abnormalities in the living human eye. 2015;112(18):E2395–2402. doi: 10.1073/pnas.1500185112. [DOI] [PMC free article] [PubMed] [Google Scholar]
- Jia Y, Bailey ST, Hwang TS, McClintic SM, Gao SS, Pennesi ME, Flaxel CJ, Lauer AK, Wilson DJ, Hornegger J, Fujimoto JG, Huang D. Quantitative optical coherence tomography angiography of vascular abnormalities in the living human eye. Proceedings of the National Academy of Sciences of the United States of America. 2015;112(18):E2395–E2402. doi: 10.1073/pnas.1500185112. [DOI] [PMC free article] [PubMed] [Google Scholar]
- Jia Y, Bailey ST, Wilson DJ, Tan O, Klein ML, Flaxel CJ, Potsaid B, Liu JJ, Lu CD, Kraus MF, Fujimoto JG, Huang D. Quantitative optical coherence tomography angiography of choroidal neovascularization in age-related macular degeneration. Ophthalmology. 2014;121(7):1435–1444. doi: 10.1016/j.ophtha.2014.01.034. [DOI] [PMC free article] [PubMed] [Google Scholar]
- Jia Y, Morrison JC, Tokayer J, Tan O, Lombardi L, Baumann B, Lu CD, Choi W, Fujimoto JG, Huang D. Quantitative OCT angiography of optic nerve head blood flow. Biomed Opt Express. 2012;3(12):3127–3137. doi: 10.1364/BOE.3.003127. [DOI] [PMC free article] [PubMed] [Google Scholar]
- Jia Y, Tan O, Tokayer J, Potsaid B, Wang Y, Liu JJ, Kraus MF, Subhash H, Fujimoto JG, Hornegger J. Split-spectrum amplitude-decorrelation angiography with optical coherence tomography. Optics express. 2012;20(4):4710–4725. doi: 10.1364/OE.20.004710. [DOI] [PMC free article] [PubMed] [Google Scholar]
- Jia Y, Tan O, Tokayer J, Potsaid B, Wang Y, Liu JJ, Kraus MF, Subhash H, Fujimoto JG, Hornegger J, Huang D. Split-spectrum amplitude-decorrelation angiography with optical coherence tomography. Optics express. 2012;20(4):4710–4725. doi: 10.1364/OE.20.004710. [DOI] [PMC free article] [PubMed] [Google Scholar]
- Jia Y, Wei E, Wang X, Zhang X, Morrison JC, Parikh M, Lombardi LH, Gattey DM, Armour RL, Edmunds B, Kraus MF, Fujimoto JG, Huang D. Optical coherence tomography angiography of optic disc perfusion in glaucoma. Ophthalmology. 2014;121(7):1322–1332. doi: 10.1016/j.ophtha.2014.01.021. [DOI] [PMC free article] [PubMed] [Google Scholar]
- Jian Z, Yu L, Rao B, Tromberg BJ, Chen Z. Three-dimensional speckle suppression in Optical Coherence Tomography based on the curvelet transform. Opt Express. 2010;18(2):1024–1032. doi: 10.1364/OE.18.001024. [DOI] [PMC free article] [PubMed] [Google Scholar]
- Jonathan E, Enfield J, Leahy MJ. Correlation mapping method for generating microcirculation morphology from optical coherence tomography (OCT) intensity images. J Biophotonics. 2011;4(9):583–587. doi: 10.1002/jbio.201000103. [DOI] [PubMed] [Google Scholar]
- Kashani AH, Lee SY, Moshfeghi A, Durbin MK, Puliafito CA. Optical Coherence Tomography Angiography of Retinal Venous Occlusion. Retina. 2015;35(11):2323–2331. doi: 10.1097/IAE.0000000000000811. [DOI] [PubMed] [Google Scholar]
- Kashani AH, Zimmer-Galler IE, Shah SM, Dustin L, Do DV, Eliott D, Haller JA, Nguyen QD. Retinal thickness analysis by race, gender, and age using Stratus OCT. Am J Ophthalmol. 2010;149(3):496–502.e491. doi: 10.1016/j.ajo.2009.09.025. [DOI] [PMC free article] [PubMed] [Google Scholar]
- Kim AY, Chu Z, Shahidzadeh A, Wang RK, Puliafito CA, Kashani AH. Quantifying Microvascular Density and Morphology in Diabetic Retinopathy Using Spectral-Domain Optical Coherence Tomography Angiography. Invest Ophthalmol Vis Sci. 2016;57(9):OCT362–370. doi: 10.1167/iovs.15-18904. [DOI] [PMC free article] [PubMed] [Google Scholar]
- Kim AY, Rodger DC, Shahidzadeh A, Chu Z, Koulisis N, Burkemper B, Jiang X, Pepple KL, Wang RK, Puliafito CA, Rao NA, Kashani AH. Quantifying retinal microvascular changes in uveitis using spectral domain optical coherence tomography angiography (SD-OCTA) Am J Ophthalmol. 2016 doi: 10.1016/j.ajo.2016.08.035. [DOI] [PMC free article] [PubMed] [Google Scholar]
- Kim AY, Rodger DC, Shahidzadeh A, Chu Z, Koulisis N, Burkemper B, Jiang X, Pepple KL, Wang RK, Puliafito CA, Rao NA, Kashani AH. Quantifying Retinal Microvascular Changes in Uveitis Using Spectral-Domain Optical Coherence Tomography Angiography. Am J Ophthalmol. 2016;171:101–112. doi: 10.1016/j.ajo.2016.08.035. [DOI] [PMC free article] [PubMed] [Google Scholar]
- Kim DY, Fingler J, Werner JS, Schwartz DM, Fraser SE, Zawadzki RJ. In vivo volumetric imaging of human retinal circulation with phase-variance optical coherence tomography. Biomed Opt Express. 2011;2(6):1504–1513. doi: 10.1364/BOE.2.001504. [DOI] [PMC free article] [PubMed] [Google Scholar]
- Kim DY, Fingler J, Zawadzki RJ, Park SS, Morse LS, Schwartz DM, Fraser SE, Werner JS. Noninvasive imaging of the foveal avascular zone with high-speed, phase-variance optical coherence tomography. Invest Ophthalmol Vis Sci. 2012;53(1):85–92. doi: 10.1167/iovs.11-8249. [DOI] [PMC free article] [PubMed] [Google Scholar]
- Kim J, Brown W, Maher JR, Levinson H, Wax A. Functional optical coherence tomography: principles and progress. Phys Med Biol. 2015;60(10):R211–237. doi: 10.1088/0031-9155/60/10/R211. [DOI] [PMC free article] [PubMed] [Google Scholar]
- Klein BE. Overview of epidemiologic studies of diabetic retinopathy. Ophthalmic Epidemiol. 2007;14(4):179–183. doi: 10.1080/09286580701396720. [DOI] [PubMed] [Google Scholar]
- Koulisis N, Kim AY, Chu Z, Shahidzadeh A, Burkemper B, Olmos de Koo LC, Moshfeghi AA, Ameri H, Puliafito CA, Isozaki VL, Wang RK, Kashani AH. Quantitative Microvascular Analysis of Retinal Venous Occlusions by Spectral Domain Optical Coherence Tomography Angiography; Association for Research in Vision and Ophthalmology (ARVO) Abstract 5505 - C0109; Seattle, WA. 2016. [DOI] [PMC free article] [PubMed] [Google Scholar]
- Kuehlewein L, Bansal M, Lenis TL, Iafe NA, Sadda SR, Bonini Filho MA, De Carlo TE, Waheed NK, Duker JS, Sarraf D. Optical Coherence Tomography Angiography of Type 1 Neovascularization in Age-Related Macular Degeneration. Am J Ophthalmol. 2015;160(4):739–748 e732. doi: 10.1016/j.ajo.2015.06.030. [DOI] [PubMed] [Google Scholar]
- Kuehlewein L, Tepelus TC, An L, Durbin MK, Srinivas S, Sadda SR. Noninvasive Visualization and Analysis of the Human Parafoveal Capillary Network Using Swept Source OCT Optical Microangiography. Invest Ophthalmol Vis Sci. 2015;56(6):3984–3988. doi: 10.1167/iovs.15-16510. [DOI] [PubMed] [Google Scholar]
- Kumar RS, Anegondi N, Chandapura RS, Sudhakaran S, Kadambi SV, Rao HL, Aung T, Sinha Roy A. Discriminant Function of Optical Coherence Tomography Angiography to Determine Disease Severity in Glaucoma. Invest Ophthalmol Vis Sci. 2016;57(14):6079–6088. doi: 10.1167/iovs.16-19984. [DOI] [PubMed] [Google Scholar]
- Kurokawa K, Sasaki K, Makita S, Hong YJ, Yasuno Y. Three-dimensional retinal and choroidal capillary imaging by power Doppler optical coherence angiography with adaptive optics. Opt Express. 2012;20(20):22796–22812. doi: 10.1364/OE.20.022796. [DOI] [PubMed] [Google Scholar]
- Kwiterovich KA, Maguire MG, Murphy RP, Schachat AP, Bressler NM, Bressler SB, Fine SL. Frequency of adverse systemic reactions after fluorescein angiography. Results of a prospective study. Ophthalmology. 1991;98(7):1139–1142. doi: 10.1016/s0161-6420(91)32165-1. [DOI] [PubMed] [Google Scholar]
- Landa G, Jangi AA, Garcia PM, Rosen RB. Initial report of quantification of retinal blood flow velocity in normal human subjects using the Retinal Functional Imager (RFI) Int Ophthalmol. 2012;32(3):211–215. doi: 10.1007/s10792-012-9547-z. [DOI] [PubMed] [Google Scholar]
- Lang SJ, Cakir B, Evers C, Ludwig F, Lange CA, Agostini HT. Value of Optical Coherence Tomography Angiography Imaging in Diagnosis and Treatment of Hemangioblastomas in von Hippel-Lindau Disease. Ophthalmic Surg Lasers Imaging Retina. 2016;47(10):935–946. doi: 10.3928/23258160-20161004-07. [DOI] [PubMed] [Google Scholar]
- Lee R, Wong TY, Sabanayagam C. Epidemiology of diabetic retinopathy, diabetic macular edema and related vision loss. Eye Vis (Lond) 2015;2:17. doi: 10.1186/s40662-015-0026-2. [DOI] [PMC free article] [PubMed] [Google Scholar]
- Leitgeb R, Hitzenberger C, Fercher A. Performance of fourier domain vs. time domain optical coherence tomography. Opt Express. 2003;11(8):889–894. doi: 10.1364/oe.11.000889. [DOI] [PubMed] [Google Scholar]
- Leitgeb R, Schmetterer L, Drexler W, Fercher A, Zawadzki R, Bajraszewski T. Real-time assessment of retinal blood flow with ultrafast acquisition by color Doppler Fourier domain optical coherence tomography. Opt Express. 2003;11(23):3116–3121. doi: 10.1364/oe.11.003116. [DOI] [PubMed] [Google Scholar]
- Leitgeb R, Schmetterer LF, Wojtkowski M, Hitzenberger CK, Sticker M, Fercher AF. Flow velocity measurements by frequency domain short coherence interferometry. International Symposium on Biomedical Optics; International Society for Optics and Photonics; 2002. [Google Scholar]
- Leitgeb RA, Werkmeister RM, Blatter C, Schmetterer L. Doppler optical coherence tomography. Prog Retin Eye Res. 2014;41:26–43. doi: 10.1016/j.preteyeres.2014.03.004. [DOI] [PMC free article] [PubMed] [Google Scholar]
- Leung CK. Diagnosing glaucoma progression with optical coherence tomography. Curr Opin Ophthalmol. 2014;25(2):104–111. doi: 10.1097/ICU.0000000000000024. [DOI] [PubMed] [Google Scholar]
- Leveque PM, Zeboulon P, Brasnu E, Baudouin C, Labbe A. Optic Disc Vascularization in Glaucoma: Value of Spectral-Domain Optical Coherence Tomography Angiography. J Ophthalmol. 2016;2016:6956717. doi: 10.1155/2016/6956717. [DOI] [PMC free article] [PubMed] [Google Scholar]
- Levison AL, Baynes KM, Lowder CY, Kaiser PK, Srivastava SK. Choroidal neovascularisation on optical coherence tomography angiography in punctate inner choroidopathy and multifocal choroiditis. Br J Ophthalmol. 2016 doi: 10.1136/bjophthalmol-2016-308806. [DOI] [PubMed] [Google Scholar]
- Li M, Yang Y, Jiang H, Gregori G, Roisman L, Zheng F, Ke B, Qu D, Wang J. Retinal Microvascular Network and Microcirculation Assessments in High Myopia. Am J Ophthalmol. 2017;174:56–67. doi: 10.1016/j.ajo.2016.10.018. [DOI] [PMC free article] [PubMed] [Google Scholar]
- Liu L, Gao SS, Bailey ST, Huang D, Li D, Jia Y. Automated choroidal neovascularization detection algorithm for optical coherence tomography angiography. Biomed Opt Express. 2015;6(9):3564–3576. doi: 10.1364/BOE.6.003564. [DOI] [PMC free article] [PubMed] [Google Scholar]
- Liu L, Jia Y, Takusagawa HL, Pechauer AD, Edmunds B, Lombardi L, Davis E, Morrison JC, Huang D. Optical Coherence Tomography Angiography of the Peripapillary Retina in Glaucoma. JAMA Ophthalmol. 2015;133(9):1045–1052. doi: 10.1001/jamaophthalmol.2015.2225. [DOI] [PMC free article] [PubMed] [Google Scholar]
- Liu L, Jia Y, Takusagawa HL, Pechauer AD, Edmunds B, Lombardi L, Davis E, Morrison JC, Huang D. Optical Coherence Tomography Angiography of the Peripapillary Retina in Glaucoma. JAMA Ophthalmol. 2015 doi: 10.1001/jamaophthalmol.2015.2225. [DOI] [PMC free article] [PubMed] [Google Scholar]
- Lupidi M, Coscas F, Cagini C, Fiore T, Spaccini E, Fruttini D, Coscas G. Automated Quantitative Analysis of Retinal Microvasculature in Normal Eyes on Optical Coherence Tomography Angiography. American Journal of Ophthalmology. 2016;169:9–23. doi: 10.1016/j.ajo.2016.06.008. [DOI] [PubMed] [Google Scholar]
- López-Sáez MP, Ordoqui E, Tornero P, Baeza A, Sainza T, Zubeldia JM, Baeza ML. Fluorescein-induced allergic reaction. Ann Allergy Asthma Immunol. 1998;81(5):428–430. doi: 10.1016/S1081-1206(10)63140-7. [DOI] [PubMed] [Google Scholar]
- Makita S, Hong Y, Yamanari M, Yatagai T, Yasuno Y. Optical coherence angiography. Opt Express. 2006;14(17):7821–7840. doi: 10.1364/oe.14.007821. [DOI] [PubMed] [Google Scholar]
- Makita S, Jaillon F, Yamanari M, Miura M, Yasuno Y. Comprehensive in vivo micro-vascular imaging of the human eye by dual-beam-scan Doppler optical coherence angiography. Opt Express. 2011;19(2):1271–1283. doi: 10.1364/OE.19.001271. [DOI] [PubMed] [Google Scholar]
- Mammo Z, Balaratnasingam C, Yu P, Xu J, Heisler M, Mackenzie P, Merkur A, Kirker A, Albiani D, Freund KB, Sarunic MV, Yu DY. Quantitative Noninvasive Angiography of the Fovea Centralis Using Speckle Variance Optical Coherence Tomography. Invest Ophthalmol Vis Sci. 2015;56(9):5074–5086. doi: 10.1167/iovs.15-16773. [DOI] [PubMed] [Google Scholar]
- Mammo Z, Heisler M, Balaratnasingam C, Lee S, Yu DY, Mackenzie P, Schendel S, Merkur A, Kirker A, Albiani D, Navajas E, Beg MF, Morgan W, Sarunic MV. Quantitative Optical Coherence Tomography Angiography of Radial Peripapillary Capillaries in Glaucoma, Glaucoma Suspect, and Normal Eyes. Am J Ophthalmol. 2016;170:41–49. doi: 10.1016/j.ajo.2016.07.015. [DOI] [PubMed] [Google Scholar]
- Mansour AM, Schachat A, Bodiford G, Haymond R. Foveal avascular zone in diabetes mellitus. Retina. 1993;13(2):125–128. doi: 10.1097/00006982-199313020-00006. [DOI] [PubMed] [Google Scholar]
- Mariampillai A, Leung MK, Jarvi M, Standish BA, Lee K, Wilson BC, Vitkin A, Yang VX. Optimized speckle variance OCT imaging of microvasculature. Opt Lett. 2010;35(8):1257–1259. doi: 10.1364/OL.35.001257. [DOI] [PubMed] [Google Scholar]
- Mariampillai A, Standish BA, Moriyama EH, Khurana M, Munce NR, Leung MK, Jiang J, Cable A, Wilson BC, Vitkin IA, Yang VX. Speckle variance detection of microvasculature using swept-source optical coherence tomography. Opt Lett. 2008;33(13):1530–1532. doi: 10.1364/ol.33.001530. [DOI] [PubMed] [Google Scholar]
- Marmor MF, Choi SS, Zawadzki RJ, Werner JS. Visual insignificance of the foveal pit: reassessment of foveal hypoplasia as fovea plana. Arch Ophthalmol. 2008;126(7):907–913. doi: 10.1001/archopht.126.7.907. [DOI] [PMC free article] [PubMed] [Google Scholar]
- Marschall S, Sander B, Mogensen M, Jorgensen TM, Andersen PE. Optical coherence tomography-current technology and applications in clinical and biomedical research. Anal Bioanal Chem. 2011;400(9):2699–2720. doi: 10.1007/s00216-011-5008-1. [DOI] [PubMed] [Google Scholar]
- Mase T, Ishibazawa A, Nagaoka T, Yokota H, Yoshida A. Radial Peripapillary Capillary Network Visualized Using Wide-Field Montage Optical Coherence Tomography Angiography. Invest Ophthalmol Vis Sci. 2016;57(9):OCT504–510. doi: 10.1167/iovs.15-18877. [DOI] [PubMed] [Google Scholar]
- Mase T, Ishibazawa A, Nagaoka T, Yokota H, Yoshida A. Radial Peripapillary Capillary Network Visualized Using Wide-Field Montage Optical Coherence Tomography Angiography. Investigative Ophthalmology & Visual Science. 2016;57(9):OCT504–507. doi: 10.1167/iovs.15-18877. [DOI] [PubMed] [Google Scholar]
- Matsunaga D, Yi J, Puliafito CA, Kashani AH. OCT Angiography in Healthy Human Subjects. Ophthalmic Surgery, Lasers and Imaging Retina. 2014;45(6):510–515. doi: 10.3928/23258160-20141118-04. [DOI] [PubMed] [Google Scholar]
- Matsunaga DR, Yi JJ, De Koo LO, Ameri H, Puliafito CA, Kashani AH. Optical Coherence Tomography Angiography of Diabetic Retinopathy in Human Subjects. Ophthalmic Surg Lasers Imaging Retina. 2015;46(8):796–805. doi: 10.3928/23258160-20150909-03. [DOI] [PubMed] [Google Scholar]
- McLeod DS, Grebe R, Bhutto I, Merges C, Baba T, Lutty GA. Relationship between RPE and choriocapillaris in age-related macular degeneration. Invest Ophthalmol Vis Sci. 2009;50(10):4982–4991. doi: 10.1167/iovs.09-3639. [DOI] [PMC free article] [PubMed] [Google Scholar]
- McNamara PM, Subhash HM, Leahy MJ. In vivo full-field en face correlation mapping optical coherence tomography. J Biomed Opt. 2013;18(12):126008. doi: 10.1117/1.JBO.18.12.126008. [DOI] [PubMed] [Google Scholar]
- Mendis KR, Balaratnasingam C, Yu P, Barry CJ, McAllister IL, Cringle SJ, Yu D-Y. Correlation of histologic and clinical images to determine the diagnostic value of fluorescein angiography for studying retinal capillary detail. Investigative Ophthalmology & Visual Science. 2010;51(11):5864–5869. doi: 10.1167/iovs.10-5333. [DOI] [PubMed] [Google Scholar]
- Miller AR, Roisman L, Zhang Q, Zheng F, Rafael de Oliveira Dias J, Yehoshua Z, Schaal KB, Feuer W, Gregori G, Chu Z, Chen CL, Kubach S, An L, Stetson PF, Durbin MK, Wang RK, Rosenfeld PJ. Comparison Between Spectral-Domain and Swept-Source Optical Coherence Tomography Angiographic Imaging of Choroidal Neovascularization. Invest Ophthalmol Vis Sci. 2017;58(3):1499–1505. doi: 10.1167/iovs.16-20969. [DOI] [PMC free article] [PubMed] [Google Scholar]
- Mo S, Krawitz B, Efstathiadis E, Geyman L, Weitz R, Chui TYP, Carroll J, Dubra A, Rosen RB. Imaging Foveal Microvasculature: Optical Coherence Tomography Angiography Versus Adaptive Optics Scanning Light Ophthalmoscope Fluorescein Angiography. Investigative Ophthalmology & Visual Science. 2016;57(9):OCT130–111. doi: 10.1167/iovs.15-18932. [DOI] [PMC free article] [PubMed] [Google Scholar]
- Moghimi S, Hosseini H, Riddle J, Lee GY, Bitrian E, Giaconi J, Caprioli J, Nouri-Mahdavi K. Measurement of optic disc size and rim area with spectral-domain OCT and scanning laser ophthalmoscopy. Invest Ophthalmol Vis Sci. 2012;53(8):4519–4530. doi: 10.1167/iovs.11-8362. [DOI] [PubMed] [Google Scholar]
- Moore J, Bagley S, Ireland G, McLeod D, Boulton ME. Three dimensional analysis of microaneurysms in the human diabetic retina. J Anat. 1999;194(Pt 1):89–100. doi: 10.1046/j.1469-7580.1999.19410089.x. [DOI] [PMC free article] [PubMed] [Google Scholar]
- Moult E, Choi W, Waheed NK, Adhi M, Lee B, Lu CD, Jayaraman V, Potsaid B, Rosenfeld PJ, Duker JS, Fujimoto JG. Ultrahigh-Speed Swept-Source OCT Angiography in Exudative AMD. Ophthalmic Surgery, Lasers and Imaging Retina. 2014;45(6):496–505. doi: 10.3928/23258160-20141118-03. [DOI] [PMC free article] [PubMed] [Google Scholar]
- Moult E, Choi W, Waheed NK, Adhi M, Lee B, Lu CD, Jayaraman V, Potsaid B, Rosenfeld PJ, Duker JS, Fujimoto JG. Ultrahigh-speed swept-source OCT angiography in exudative AMD. Ophthalmic Surg Lasers Imaging Retina. 2014;45(6):496–505. doi: 10.3928/23258160-20141118-03. [DOI] [PMC free article] [PubMed] [Google Scholar]
- Moult EM, Waheed NK, Novais EA, Choi W, Lee B, Ploner SB, Cole ED, Louzada RN, Lu CD, Rosenfeld PJ, Duker JS, Fujimoto JG. Swept-Source Optical Coherence Tomography Angiography Reveals Choriocapillaris Alterations in Eyes with Nascent Geographic Atrophy and Drusen-Associated Geographic Atrophy. Retina. 2016;36(Suppl 1):S2–S11. doi: 10.1097/IAE.0000000000001287. [DOI] [PMC free article] [PubMed] [Google Scholar]
- Moysidis SN, Koulisis N, Patel VR, Kashani AH, Rao NA, Humayun MS, Rodger DC. THE SECOND BLIND SPOT: SMALL RETINAL VESSEL VASCULOPATHY AFTER VACCINATION AGAINST NEISSERIA MENINGITIDIS AND YELLOW FEVER. Retin Cases Brief Rep. 2016 doi: 10.1097/ICB.0000000000000391. [DOI] [PubMed] [Google Scholar]
- Muakkassa NW, Chin AT, de Carlo T, Klein KA, Baumal CR, Witkin AJ, Duker JS, Waheed NK. Characterizing the Effect of Anti-Vascular Endothelial Growth Factor Therapy on Treatment-Naive Choroidal Neovascularization Using Optical Coherence Tomography Angiography. Retina. 2015;35(11):2252–2259. doi: 10.1097/IAE.0000000000000836. [DOI] [PubMed] [Google Scholar]
- Nassif N, Cense B, Park BH, Yun SH, Chen TC, Bouma BE, Tearney GJ, de Boer JF. In vivo human retinal imaging by ultrahigh-speed spectral domain optical coherence tomography. Opt Lett. 2004;29(5):480–482. doi: 10.1364/ol.29.000480. [DOI] [PubMed] [Google Scholar]
- Nemiroff J, Kuehlewein L, Rahimy E, Tsui I, Doshi R, Gaudric A, Gorin MB, Sadda S, Sarraf D. Assessing Deep Retinal Capillary Ischemia in Paracentral Acute Middle Maculopathy by Optical Coherence Tomography Angiography. Am J Ophthalmol. 2016;162:121–132 e121. doi: 10.1016/j.ajo.2015.10.026. [DOI] [PubMed] [Google Scholar]
- Nesper PL, Soetikno BT, Fawzi AA. Choriocapillaris Non-Perfusion is Associated with Poor Visual Acuity in Eyes with Reticular Pseudodrusen. Am J Ophthalmol. 2016 doi: 10.1016/j.ajo.2016.10.005. [DOI] [PMC free article] [PubMed] [Google Scholar]
- Novais EA, Adhi M, Moult EM, Louzada RN, Cole ED, Husvogt L, Lee B, Dang S, Regatieri CV, Witkin AJ, Baumal CR, Hornegger J, Jayaraman V, Fujimoto JG, Duker JS, Waheed NK. Choroidal Neovascularization Analyzed on Ultrahigh-Speed Swept-Source Optical Coherence Tomography Angiography Compared to Spectral-Domain Optical Coherence Tomography Angiography. Am J Ophthalmol. 2016;164:80–88. doi: 10.1016/j.ajo.2016.01.011. [DOI] [PMC free article] [PubMed] [Google Scholar]
- NOVOTNY HR, ALVIS DL. A method of photographing fluorescence in circulating blood in the human retina. Circulation. 1961;24:82–86. doi: 10.1161/01.cir.24.1.82. [DOI] [PubMed] [Google Scholar]
- Nunes RP, Goldhardt R, de Amorim Garcia Filho CA, Thorell MR, Abbey AM, Kuriyan AE, Modi YS, Shah M, Yehoshua Z, Gregori G, Feuer W, Rosenfeld PJ. Spectral-domain optical coherence tomography measurements of choroidal thickness and outer retinal disruption in macular telangiectasia type 2. Ophthalmic Surg Lasers Imaging Retina. 2015;46(2):162–170. doi: 10.3928/23258160-20150213-17. [DOI] [PubMed] [Google Scholar]
- Nunes RP, Gregori G, Yehoshua Z, Stetson PF, Feuer W, Moshfeghi AA, Rosenfeld PJ. Predicting the progression of geographic atrophy in age-related macular degeneration with SD-OCT en face imaging of the outer retina. Ophthalmic Surg Lasers Imaging Retina. 2013;44(4):344–359. doi: 10.3928/23258160-20130715-06. [DOI] [PubMed] [Google Scholar]
- Parodi MB, Visintin F, Della Rupe P, Ravalico G. Foveal avascular zone in macular branch retinal vein occlusion. Int Ophthalmol. 1995;19(1):25–28. doi: 10.1007/BF00156415. [DOI] [PubMed] [Google Scholar]
- Pece A, Sannace C, Menchini U, Virgili G, Galli L, Isola V, Brancato R. Fluorescein angiography and indocyanine green angiography for identifying occult choroidal neovascularization in age-related macular degeneration. Eur J Ophthalmol. 2005;15(6):759–763. [PubMed] [Google Scholar]
- Pechauer AD, Huang D, Jia Y. Detecting Blood Flow Response to Stimulation of the Human Eye. Biomed Res Int. 2015;2015:121973. doi: 10.1155/2015/121973. [DOI] [PMC free article] [PubMed] [Google Scholar]
- Pederson JE, Herschler J. Reversal of glaucomatous cupping in adults. Arch Ophthalmol. 1982;100(3):426–431. doi: 10.1001/archopht.1982.01030030428008. [DOI] [PubMed] [Google Scholar]
- Penha FM, Rosenfeld PJ, Gregori G, Falcão M, Yehoshua Z, Wang F, Feuer WJ. Quantitative imaging of retinal pigment epithelial detachments using spectral-domain optical coherence tomography. Am J Ophthalmol. 2012;153(3):515–523. doi: 10.1016/j.ajo.2011.08.031. [DOI] [PubMed] [Google Scholar]
- Phasukkijwatana N, Tan AC, Chen X, Freund KB, Sarraf D. Optical coherence tomography angiography of type 3 neovascularisation in age-related macular degeneration after antiangiogenic therapy. Br J Ophthalmol. 2016 doi: 10.1136/bjophthalmol-2016-308815. [DOI] [PubMed] [Google Scholar]
- YJ, STB, DJW, OT, MLK, CJF, BP, JJL, CDL, MFK, JGF, DHMD Quantitative Optical Coherence Tomography Angiography of Choroidal Neovascularization in Age-Related Macular Degeneration. Ophthalmology. 2014;121(7):1435–1444. doi: 10.1016/j.ophtha.2014.01.034. [DOI] [PMC free article] [PubMed] [Google Scholar]
- Pircher M, Hitzenberger CK, Schmidt-Erfurth U. Polarization sensitive optical coherence tomography in the human eye. Prog Retin Eye Res. 2011;30(6):431–451. doi: 10.1016/j.preteyeres.2011.06.003. [DOI] [PMC free article] [PubMed] [Google Scholar]
- Ploner SB, Moult EM, Choi W, Waheed NK, Lee B, Novais EA, Cole ED, Potsaid B, Husvogt L, Schottenhamml J, Maier A, Rosenfeld PJ, Duker JS, Hornegger J, Fujimoto JG. TOWARD QUANTITATIVE OPTICAL COHERENCE TOMOGRAPHY ANGIOGRAPHY: Visualizing Blood Flow Speeds in Ocular Pathology Using Variable Interscan Time Analysis. Retina. 2016;36(Suppl 1):S118–S126. doi: 10.1097/IAE.0000000000001328. [DOI] [PMC free article] [PubMed] [Google Scholar]
- Proskurin SG, He Y, Wang RK. Determination of flow velocity vector based on Doppler shift and spectrum broadening with optical coherence tomography. Opt Lett. 2003;28(14):1227–1229. doi: 10.1364/ol.28.001227. [DOI] [PubMed] [Google Scholar]
- Querques G, Zambrowski O, Corvi F, Miere A, Semoun O, Srour M, Souied EH. Optical coherence tomography angiography in adult-onset foveomacular vitelliform dystrophy. Br J Ophthalmol. 2016;100(12):1724–1730. doi: 10.1136/bjophthalmol-2016-308370. [DOI] [PubMed] [Google Scholar]
- Rao HL, Kadambi SV, Weinreb RN, Puttaiah NK, Pradhan ZS, Rao DA, Kumar RS, Webers CA, Shetty R. Diagnostic ability of peripapillary vessel density measurements of optical coherence tomography angiography in primary open-angle and angle-closure glaucoma. Br J Ophthalmol. 2016 doi: 10.1136/bjophthalmol-2016-309377. [DOI] [PubMed] [Google Scholar]
- Reichel E, Duker JS, Puliafito CA. Indocyanine green angiography and choroidal neovascularization obscured by hemorrhage. Ophthalmology. 1995;102(12):1871–1876. doi: 10.1016/s0161-6420(95)30781-6. [DOI] [PubMed] [Google Scholar]
- Reichel E, Pollock DA, Duker JS, Puliafito CA. Indocyanine green angiography for recurrent choroidal neovascularization in age-related macular degeneration. Ophthalmic Surg Lasers. 1995;26(6):513–518. [PubMed] [Google Scholar]
- Remky A, Wolf S, Knabben H, Arend O, Reim M. Perifoveal capillary network in patients with acute central retinal vein occlusion. Ophthalmology. 1997;104(1):33–37. doi: 10.1016/s0161-6420(97)30365-0. [DOI] [PubMed] [Google Scholar]
- Rispoli M, Savastano MC, Lumbroso B. Capillary Network Anomalies in Branch Retinal Vein Occlusion on Optical Coherence Tomography Angiography. Retina. 2015;35(11):2332–2338. doi: 10.1097/IAE.0000000000000845. [DOI] [PMC free article] [PubMed] [Google Scholar]
- Riva CE, Grunwald JE, Sinclair SH. Laser Doppler Velocimetry study of the effect of pure oxygen breathing on retinal blood flow. Invest Ophthalmol Vis Sci. 1983;24(1):47–51. [PubMed] [Google Scholar]
- Roisman L, Rosenfeld PJ. Optical Coherence Tomography Angiography of Macular Telangiectasia Type 2. Dev Ophthalmol. 2016;56:146–158. doi: 10.1159/000442807. [DOI] [PubMed] [Google Scholar]
- Roisman L, Zhang Q, Wang RK, Gregori G, Zhang A, Chen CL, Durbin MK, An L, Stetson PF, Robbins G, Miller A, Zheng F, Rosenfeld PJ. Optical Coherence Tomography Angiography of Asymptomatic Neovascularization in Intermediate Age-Related Macular Degeneration. Ophthalmology. 2016;123(6):1309–1319. doi: 10.1016/j.ophtha.2016.01.044. [DOI] [PMC free article] [PubMed] [Google Scholar]
- Rosenfeld PJ. Optical Coherence Tomography and the Development of Antiangiogenic Therapies in Neovascular Age-Related Macular Degeneration. Invest Ophthalmol Vis Sci. 2016;57(9):OCT14–26. doi: 10.1167/iovs.16-19969. [DOI] [PMC free article] [PubMed] [Google Scholar]
- Ryan SJ, Schachat AP, Wilkinson CP, Hinton DR, Sadda SR, Wiedeman P. Retina. 5. Elsevier; 2013. [Google Scholar]
- Samara WA, Say EA, Khoo CT, Higgins TP, Magrath G, Ferenczy S, Shields CL. Correlation of Foveal Avascular Zone Size with Foveal Morphology in Normal Eyes Using Optical Coherence Tomography Angiography. Retina. 2015;35(11):2188–2195. doi: 10.1097/IAE.0000000000000847. [DOI] [PubMed] [Google Scholar]
- Schmitt JM, Xiang SH, Yung KM. Speckle in optical coherence tomography. J Biomed Opt. 1999;4(1):95–105. doi: 10.1117/1.429925. [DOI] [PubMed] [Google Scholar]
- Schwartz DM, Fingler J, Kim DY, Zawadzki RJ, Morse LS, Park SS, Fraser SE, Werner JS. Phase-variance optical coherence tomography: a technique for noninvasive angiography. Ophthalmology. 2014;121(1):180–187. doi: 10.1016/j.ophtha.2013.09.002. [DOI] [PMC free article] [PubMed] [Google Scholar]
- Scoles D, Gray DC, Hunter JJ, Wolfe R, Gee BP, Geng Y, Masella BD, Libby RT, Russell S, Williams DR, Merigan WH. In-vivo imaging of retinal nerve fiber layer vasculature: imaging histology comparison. BMC Ophthalmol. 2009;9:9. doi: 10.1186/1471-2415-9-9. [DOI] [PMC free article] [PubMed] [Google Scholar]
- Scripsema NK, Garcia PM, Bavier RD, Chui TY, Krawitz BD, Mo S, Agemy SA, Xu L, Lin YB, Panarelli JF, Sidoti PA, Tsai JC, Rosen RB. Optical Coherence Tomography Angiography Analysis of Perfused Peripapillary Capillaries in Primary Open-Angle Glaucoma and Normal-Tension Glaucoma. Invest Ophthalmol Vis Sci. 2016;57(9):OCT611–OCT620. doi: 10.1167/iovs.15-18945. [DOI] [PubMed] [Google Scholar]
- Shi Y, Gahm J, Kashani A. Curvelet-based Vessel Enhancement for 3D OCT Angiography. Association for Research In Vision and Ophthalmology (ARVO) 2017 Abstract 2017. [Google Scholar]
- Snodderly DM, Weinhaus RS, Choi JC. Neural-vascular relationships in central retina of macaque monkeys (Macaca fascicularis) J Neurosci. 1992;12(4):1169–1193. doi: 10.1523/JNEUROSCI.12-04-01169.1992. [DOI] [PMC free article] [PubMed] [Google Scholar]
- Son T, Wang B, Thapa D, Lu Y, Chen Y, Cao D, Yao X. Optical coherence tomography angiography of stimulus evoked hemodynamic responses in individual retinal layers. Biomedical optics express. 2016;7(8):3151–3112. doi: 10.1364/BOE.7.003151. [DOI] [PMC free article] [PubMed] [Google Scholar]
- Sophie R, Hafiz G, Scott AW, Zimmer-Galler I, Nguyen QD, Ying H, Do DV, Solomon S, Sodhi A, Gehlbach P, Duh E, Baranano D, Campochiaro PA. Long-term outcomes in ranibizumab-treated patients with retinal vein occlusion; the role of progression of retinal nonperfusion. Am J Ophthalmol. 2013;156(4):693–705. doi: 10.1016/j.ajo.2013.05.039. [DOI] [PMC free article] [PubMed] [Google Scholar]
- Spaide RF. Volume-Rendered Optical Coherence Tomography of Diabetic Retinopathy Pilot Study. Am J Ophthalmol. 2015;160(6):1200–1210. doi: 10.1016/j.ajo.2015.09.010. [DOI] [PubMed] [Google Scholar]
- Spaide RF. Choriocapillaris Flow Features Follow a Power Law Distribution: Implications for Characterization and Mechanisms of Disease Progression. Am J Ophthalmol. 2016;170:58–67. doi: 10.1016/j.ajo.2016.07.023. [DOI] [PubMed] [Google Scholar]
- Spaide RF, Fujimoto JG, Waheed NK. Image Artifacts in Optical Coherence Tomography Angiography. Retina. 2015;35(11):2163–2180. doi: 10.1097/IAE.0000000000000765. [DOI] [PMC free article] [PubMed] [Google Scholar]
- Spaide RF, Fujimoto JG, Waheed NK. IMAGE ARTIFACTS IN OPTICAL COHERENCE TOMOGRAPHY ANGIOGRAPHY. Retina (Philadelphia, Pa) 2015;35(11):1–18. doi: 10.1097/IAE.0000000000000765. [DOI] [PMC free article] [PubMed] [Google Scholar]
- Spaide RF, Klancnik JM, Cooney MJ, Yannuzzi LA, Balaratnasingam C, Dansingani KK, Suzuki M. Volume-Rendering Optical Coherence Tomography Angiography of Macular Telangiectasia Type 2. Ophthalmology. 2015:1–9. doi: 10.1016/j.ophtha.2015.07.025. [DOI] [PubMed] [Google Scholar]
- Spaide RF, Klancnik JM, Jr, Cooney MJ, Yannuzzi LA, Balaratnasingam C, Dansingani KK, Suzuki M. Volume-Rendering Optical Coherence Tomography Angiography of Macular Telangiectasia Type 2. Ophthalmology. 2015;122(11):2261–2269. doi: 10.1016/j.ophtha.2015.07.025. [DOI] [PubMed] [Google Scholar]
- Spaide RF, Klancnik JM, Jr, Cooney MJ. Retinal Vascular Layers Imaged by Fluorescein Angiography and Optical Coherence Tomography Angiography. JAMA Ophthalmology. 2015;133(1):45. doi: 10.1001/jamaophthalmol.2014.3616. [DOI] [PubMed] [Google Scholar]
- Squirrell DM, Watts A, Evans D, Mody C, Talbot JF. A prospective evaluation of the Heidelberg retina flowmeter in diagnosing ischaemia following branch retinal vein occlusion: a masked, controlled comparison with fluorescein angiography. Eye (Lond) 2001;15(Pt 3):261–266. doi: 10.1038/eye.2001.91. [DOI] [PubMed] [Google Scholar]
- Stitt AW, Curtis TM, Chen M, Medina RJ, McKay GJ, Jenkins A, Gardiner TA, Lyons TJ, Hammes HP, Simó R, Lois N. The progress in understanding and treatment of diabetic retinopathy. Prog Retin Eye Res. 2016;51:156–186. doi: 10.1016/j.preteyeres.2015.08.001. [DOI] [PubMed] [Google Scholar]
- Stitt AW, Gardiner TA, Archer DB. Histological and ultrastructural investigation of retinal microaneurysm development in diabetic patients. Br J Ophthalmol. 1995;79(4):362–367. doi: 10.1136/bjo.79.4.362. [DOI] [PMC free article] [PubMed] [Google Scholar]
- Suh MH, Zangwill LM, Manalastas PI, Belghith A, Yarmohammadi A, Medeiros FA, Diniz-Filho A, Saunders LJ, Weinreb RN. Deep Retinal Layer Microvasculature Dropout Detected by the Optical Coherence Tomography Angiography in Glaucoma. Ophthalmology. 2016;123(12):2509–2518. doi: 10.1016/j.ophtha.2016.09.002. [DOI] [PMC free article] [PubMed] [Google Scholar]
- Suh MH, Zangwill LM, Manalastas PI, Belghith A, Yarmohammadi A, Medeiros FA, Diniz-Filho A, Saunders LJ, Yousefi S, Weinreb RN. Optical Coherence Tomography Angiography Vessel Density in Glaucomatous Eyes with Focal Lamina Cribrosa Defects. Ophthalmology. 2016;123(11):2309–2317. doi: 10.1016/j.ophtha.2016.07.023. [DOI] [PMC free article] [PubMed] [Google Scholar]
- Szkulmowska A, Szkulmowski M, Szlag D, Kowalczyk A, Wojtkowski M. Three-dimensional quantitative imaging of retinal and choroidal blood flow velocity using joint Spectral and Time domain Optical Coherence Tomography. Opt Express. 2009;17(13):10584–10598. doi: 10.1364/oe.17.010584. [DOI] [PubMed] [Google Scholar]
- Takase N, Nozaki M, Kato A, Ozeki H, Yoshida M, Ogura Y. Enlargement of Foveal Avascular Zone in Diabetic Eyes Evaluated by En Face Optical Coherence Tomography Angiography. Retina. 2015;35(11):2377–2383. doi: 10.1097/IAE.0000000000000849. [DOI] [PubMed] [Google Scholar]
- Takayama K, Ito Y, Kaneko H, Kataoka K, Ra E, Terasaki H. Optical coherence tomography angiography in leber hereditary optic neuropathy. Acta Ophthalmol. 2016 doi: 10.1111/aos.13244. [DOI] [PubMed] [Google Scholar]
- Tan AC, Dansingani KK, Yannuzzi LA, Sarraf D, Freund KB. Type 3 Neovascularization Imaged with Cross-Sectional and En Face Optical Coherence Tomography Angiography. Retina. 2016 doi: 10.1097/IAE.0000000000001343. [DOI] [PubMed] [Google Scholar]
- Tan CS, Lim LW, Chow VS, Chay IW, Tan S, Cheong KX, Tan GT, Sadda SR. Optical Coherence Tomography Angiography Evaluation of the Parafoveal Vasculature and Its Relationship With Ocular Factors. Investigative Ophthalmology & Visual Science. 2016;57(9):OCT224–211. doi: 10.1167/iovs.15-18869. [DOI] [PubMed] [Google Scholar]
- Tan PE, Balaratnasingam C, Xu J, Mammo Z, Han SX, Mackenzie P, Kirker AW, Albiani D, Merkur AB, Sarunic MV, Yu DY. Quantitative Comparison of Retinal Capillary Images Derived By Speckle Variance Optical Coherence Tomography With Histology. Invest Ophthalmol Vis Sci. 2015;56(6):3989–3996. doi: 10.1167/iovs.14-15879. [DOI] [PubMed] [Google Scholar]
- Tao YK, Kennedy KM, Izatt JA. Velocity-resolved 3D retinal microvessel imaging using single-pass flow imaging spectral domain optical coherence tomography. Opt Express. 2009;17(5):4177–4188. doi: 10.1364/oe.17.004177. [DOI] [PMC free article] [PubMed] [Google Scholar]
- Thorell MR, Nunes RP, Chen GW, Doshi RR, Dugar J, George MK, Kim BT, Lowrance MD, Modi D, Nahas Z, Gregori G, Yehoshua Z, Feuer W, Rosenfeld PJ. Response to aflibercept after frequent re-treatment with bevacizumab or ranibizumab in eyes with neovascular AMD. Ophthalmic Surg Lasers Imaging Retina. 2014;45(6):526–533. doi: 10.3928/23258160-20141118-07. [DOI] [PubMed] [Google Scholar]
- Thorell MR, Zhang Q, Huang Y, An L, Durbin MK, Laron M, Sharma U, Stetson PF, Gregori G, Wang RK, Rosenfeld PJ. Swept-source OCT angiography of macular telangiectasia type 2. Ophthalmic Surg Lasers Imaging Retina. 2014;45(5):369–380. doi: 10.3928/23258160-20140909-06. [DOI] [PubMed] [Google Scholar]
- Thorell MR, Zhang Q, Huang Y, An L, Durbin MK, Laron M, Sharma U, Stetson PF, Gregori G, Wang RK, Rosenfeld PJ. Swept-Source OCT Angiography of Macular Telangiectasia Type 2. Ophthalmic Surgery, Lasers and Imaging Retina. 2014;45(5):369–380. doi: 10.3928/23258160-20140909-06. [DOI] [PubMed] [Google Scholar]
- Tick S, Rossant F, Ghorbel I, Gaudric A, Sahel JA, Chaumet-Riffaud P, Paques M. Foveal shape and structure in a normal population. Invest Ophthalmol Vis Sci. 2011;52(8):5105–5110. doi: 10.1167/iovs.10-7005. [DOI] [PubMed] [Google Scholar]
- Tokayer J, Jia Y, Dhalla A-H, Huang D. Blood flow velocity quantification using split-spectrum amplitude-decorrelation angiography with optical coherence tomography. Biomedical optics express. 2013;4(10):1909. doi: 10.1364/BOE.4.001909. [DOI] [PMC free article] [PubMed] [Google Scholar]
- Tokayer J, Jia Y, Dhalla AH, Huang D. Blood flow velocity quantification using split-spectrum amplitude-decorrelation angiography with optical coherence tomography. Biomed Opt Express. 2013;4(10):1909–1924. doi: 10.1364/BOE.4.001909. [DOI] [PMC free article] [PubMed] [Google Scholar]
- Told R, Ginner L, Hecht A, Sacu S, Leitgeb R, Pollreisz A, Schmidt-Erfurth U. Comparative study between a spectral domain and a high-speed single-beam swept source OCTA system for identifying choroidal neovascularization in AMD. Sci Rep. 2016;6:38132. doi: 10.1038/srep38132. [DOI] [PMC free article] [PubMed] [Google Scholar]
- Tomic L, Bjärnhall G, Mäepea O, Sperber GO, Alm A. Effects of oxygen and carbon dioxide on human retinal circulation: an investigation using blue field simulation and scanning laser ophthalmoscopy. Acta Ophthalmol Scand. 2005;83(6):705–710. doi: 10.1111/j.1600-0420.2005.00522.x. [DOI] [PubMed] [Google Scholar]
- Toto L, Di Antonio L, Mastropasqua R, Mattei PA, Carpineto P, Borrelli E, Rispoli M, Lumbroso B, Mastropasqua L. Multimodal Imaging of Macular Telangiectasia Type 2: Focus on Vascular Changes Using Optical Coherence Tomography Angiography. Investigative Ophthalmology & Visual Science. 2016;57(9):OCT268–269. doi: 10.1167/iovs.15-18872. [DOI] [PubMed] [Google Scholar]
- Tsai CS, Shin DH, Wan JY, Zeiter JH. Visual field global indices in patients with reversal of glaucomatous cupping after intraocular pressure reduction. Ophthalmology. 1991;98(9):1412–1419. doi: 10.1016/s0161-6420(91)32118-3. [DOI] [PubMed] [Google Scholar]
- Velez-Montoya R, Oliver SC, Olson JL, Fine SL, Mandava N, Quiroz-Mercado H. Current knowledge and trends in age-related macular degeneration: today’s and future treatments. Retina. 2013;33(8):1487–1502. doi: 10.1097/IAE.0b013e318271f265. [DOI] [PubMed] [Google Scholar]
- Waisbourd M, Ahmed OM, Molineaux J, Gonzalez A, Spaeth GL, Katz LJ. Reversible structural and functional changes after intraocular pressure reduction in patients with glaucoma. Graefes Arch Clin Exp Ophthalmol. 2016;254(6):1159–1166. doi: 10.1007/s00417-016-3321-2. [DOI] [PubMed] [Google Scholar]
- Wang Q, Chan S, Yang JY, You B, Wang YX, Jonas JB, Bin Wei W. Vascular Density in Retina and Choriocapillaris as Measured by Optical Coherence Tomography Angiography. AJOPHT. 2016;168(C):95–109. doi: 10.1016/j.ajo.2016.05.005. [DOI] [PubMed] [Google Scholar]
- Wang R, Kirkpatrick S, Hinds M. Phase Sensitive Optical Coherence Elastography for Mapping Tissue Micro-Strains in Real Time. Applied Physics Letters. 2007 Apr;90(164105) [Google Scholar]
- Wang R, Ma Z, KSJ Tissue Doppler optical coherence elastography for real time strain rate and strain mapping of soft tissue. Applied Physics Letters. 2006 Oct;89(144103) [Google Scholar]
- Wang RK. Optical Microangiography: A Label Free 3D Imaging Technology to Visualize and Quantify Blood Circulations within Tissue Beds in vivo. IEEE J Sel Top Quantum Electron. 2010;16(3):545–554. doi: 10.1109/JSTQE.2009.2033609. [DOI] [PMC free article] [PubMed] [Google Scholar]
- Wang RK, An L, Francis P, Wilson DJ. Depth-resolved imaging of capillary networks in retina and choroid using ultrahigh sensitive optical microangiography. Opt Lett. 2010;35(9):1467–1469. doi: 10.1364/OL.35.001467. [DOI] [PMC free article] [PubMed] [Google Scholar]
- Wang RK, An L, Saunders S, Wilson DJ. Optical microangiography provides depth-resolved images of directional ocular blood perfusion in posterior eye segment. J Biomed Opt. 2010;15(2):020502. doi: 10.1117/1.3353958. [DOI] [PMC free article] [PubMed] [Google Scholar]
- Wang RK, Jacques SL, Ma Z, Hurst S, Hanson SR, Gruber A. Three dimensional optical angiography. Opt Express. 2007;15(7):4083–4097. doi: 10.1364/oe.15.004083. [DOI] [PubMed] [Google Scholar]
- Wang RK, Zhang A, Choi WJ, Zhang Q, Chen CL, Miller A, Gregori G, Rosenfeld PJ. Wide-field optical coherence tomography angiography enabled by two repeated measurements of B-scans. Opt Lett. 2016;41(10):2330–2333. doi: 10.1364/OL.41.002330. [DOI] [PMC free article] [PubMed] [Google Scholar]
- Wang X, Jia Y, Spain R, Potsaid B, Liu JJ, Baumann B, Hornegger J, Fujimoto JG, Wu Q, Huang D. Optical coherence tomography angiography of optic nerve head and parafovea in multiple sclerosis. Br J Ophthalmol. 2014;98(10):1368–1373. doi: 10.1136/bjophthalmol-2013-304547. [DOI] [PMC free article] [PubMed] [Google Scholar]
- Wang X, Jiang C, Ko T, Kong X, Yu X, Min W, Shi G, Sun X. Correlation between optic disc perfusion and glaucomatous severity in patients with open-angle glaucoma: an optical coherence tomography angiography study. Graefes Arch Clin Exp Ophthalmol. 2015;253(9):1557–1564. doi: 10.1007/s00417-015-3095-y. [DOI] [PubMed] [Google Scholar]
- Wei E, Jia Y, Tan O, Potsaid B, Liu JJ, Choi W, Fujimoto JG, Huang D. Parafoveal Retinal Vascular Response to Pattern Visual Stimulation Assessed with OCT Angiography. PLoS ONE. 2013;8(12):e81343. doi: 10.1371/journal.pone.0081343. [DOI] [PMC free article] [PubMed] [Google Scholar]
- Weinhaus RS, Burke JM, Delori FC, Snodderly DM. Comparison of fluorescein angiography with microvascular anatomy of macaque retinas. Experimental Eye Research. 1995;61(1):1–16. doi: 10.1016/s0014-4835(95)80053-0. [DOI] [PubMed] [Google Scholar]
- Willoughby AS, Ying GS, Toth CA, Maguire MG, Burns RE, Grunwald JE, Daniel E, Jaffe GJ CoA-RMDTTR Group. Subretinal Hyperreflective Material in the Comparison of Age-Related Macular Degeneration Treatments Trials. Ophthalmology. 2015;122(9):1846–1853.e1845. doi: 10.1016/j.ophtha.2015.05.042. [DOI] [PMC free article] [PubMed] [Google Scholar]
- Wilson DJ, Finkelstein D, Quigley HA, Green WR. Macular grid photocoagulation. An experimental study on the primate retina. Arch Ophthalmol. 1988;106(1):100–105. doi: 10.1001/archopht.1988.01060130106038. [DOI] [PubMed] [Google Scholar]
- Wittstrom E, Schatz P, Lovestam-Adrian M, Ponjavic V, Bergstrom A, Andreasson S. Improved retinal function after trabeculectomy in glaucoma patients. Graefes Arch Clin Exp Ophthalmol. 2010;248(4):485–495. doi: 10.1007/s00417-009-1220-5. [DOI] [PubMed] [Google Scholar]
- Wojtkowski M, Leitgeb R, Kowalczyk A, Bajraszewski T, Fercher AF. In vivo human retinal imaging by Fourier domain optical coherence tomography. J Biomed Opt. 2002;7(3):457–463. doi: 10.1117/1.1482379. [DOI] [PubMed] [Google Scholar]
- Wojtkowski M, Srinivasan V, Ko T, Fujimoto J, Kowalczyk A, Duker J. Ultrahigh-resolution, high-speed, Fourier domain optical coherence tomography and methods for dispersion compensation. Opt Express. 2004;12(11):2404–2422. doi: 10.1364/opex.12.002404. [DOI] [PubMed] [Google Scholar]
- Wu Z, Luu CD, Ayton LN, Goh JK, Lucci LM, Hubbard WC, Hageman JL, Hageman GS, Guymer RH. Optical coherence tomography-defined changes preceding the development of drusen-associated atrophy in age-related macular degeneration. Ophthalmology. 2014;121(12):2415–2422. doi: 10.1016/j.ophtha.2014.06.034. [DOI] [PubMed] [Google Scholar]
- Xu H, Deng G, Jiang C, Kong X, Yu J, Sun X. Microcirculatory Responses to Hyperoxia in Macular and Peripapillary Regions. Invest Ophthalmol Vis Sci. 2016;57(10):4464–4468. doi: 10.1167/iovs.16-19603. [DOI] [PubMed] [Google Scholar]
- Xu J, Han S, Balaratnasingam C, Mammo Z, Wong KS, Lee S, Cua M, Young M, Kirker A, Albiani D, Forooghian F, Mackenzie P, Merkur A, Yu DY, Sarunic MV. Retinal angiography with real-time speckle variance optical coherence tomography. Br J Ophthalmol. 2015;99(10):1315–1319. doi: 10.1136/bjophthalmol-2014-306010. [DOI] [PubMed] [Google Scholar]
- Yang Y, Wang J, Jiang H, Yang X, Feng L, Hu L, Wang L, Lu F, Shen M. Retinal Microvasculature Alteration in High Myopia. Invest Ophthalmol Vis Sci. 2016;57(14):6020–6030. doi: 10.1167/iovs.16-19542. [DOI] [PubMed] [Google Scholar]
- Yannuzzi LA. Indocyanine green angiography: a perspective on use in the clinical setting. Am J Ophthalmol. 2011;151(5):745–751.e741. doi: 10.1016/j.ajo.2011.01.043. [DOI] [PubMed] [Google Scholar]
- Yannuzzi LA, Rohrer KT, Tindel LJ, Sobel RS, Costanza MA, Shields W, Zang E. Fluorescein angiography complication survey. Ophthalmology. 1986;93(5):611–617. doi: 10.1016/s0161-6420(86)33697-2. [DOI] [PubMed] [Google Scholar]
- Yannuzzi LA, Slakter JS, Sorenson JA, Guyer DR, Orlock DA. Digital indocyanine green videoangiography and choroidal neovascularization. Retina. 1992;12(3):191–223. [PubMed] [Google Scholar]
- Yarmohammadi A, Zangwill LM, Diniz-Filho A, Suh MH, Manalastas PI, Fatehee N, Yousefi S, Belghith A, Saunders LJ, Medeiros FA, Huang D, Weinreb RN. Optical Coherence Tomography Angiography Vessel Density in Healthy, Glaucoma Suspect, and Glaucoma Eyes. Invest Ophthalmol Vis Sci. 2016;57(9):OCT451–459. doi: 10.1167/iovs.15-18944. [DOI] [PMC free article] [PubMed] [Google Scholar]
- Yarmohammadi A, Zangwill LM, Diniz-Filho A, Suh MH, Yousefi S, Saunders LJ, Belghith A, Manalastas PI, Medeiros FA, Weinreb RN. Relationship between Optical Coherence Tomography Angiography Vessel Density and Severity of Visual Field Loss in Glaucoma. Ophthalmology. 2016;123(12):2498–2508. doi: 10.1016/j.ophtha.2016.08.041. [DOI] [PMC free article] [PubMed] [Google Scholar]
- Yeung L, Lima VC, Garcia P, Landa G, Rosen RB. Correlation between spectral domain optical coherence tomography findings and fluorescein angiography patterns in diabetic macular edema. Ophthalmology. 2009;116(6):1158–1167. doi: 10.1016/j.ophtha.2008.12.063. [DOI] [PubMed] [Google Scholar]
- Yousefi S, Wang RK. Simultaneous estimation of bidirectional particle flow and relative flux using MUSIC-OCT: phantom studies. Physics in medicine and biology. 2014;59(22):6693. doi: 10.1088/0031-9155/59/22/6693. [DOI] [PMC free article] [PubMed] [Google Scholar]
- Yousefi S, Zhi Z, Wang RK. Eigendecomposition-based clutter filtering technique for optical micro-angiography. IEEE Trans Biomed Eng. 2011;58(8) doi: 10.1109/TBME.2011.2152839. [DOI] [PMC free article] [PubMed] [Google Scholar]
- Yu J, Gu R, Zong Y, Xu H, Wang X, Sun X, Jiang C, Xie B, Jia Y, Huang D. Relationship Between Retinal Perfusion and Retinal Thickness in Healthy Subjects: An Optical Coherence Tomography Angiography Study. Investigative Ophthalmology & Visual Science. 2016;57(9):OCT204–207. doi: 10.1167/iovs.15-18630. [DOI] [PMC free article] [PubMed] [Google Scholar]
- Yu PK, Balaratnasingam C, Xu J, Morgan WH, Mammo Z, Han S, Mackenzie P, Merkur A, Kirker A, Albiani D, Sarunic MV, Yu DY. Label-Free Density Measurements of Radial Peripapillary Capillaries in the Human Retina. PLoS One. 2015;10(8):e0135151. doi: 10.1371/journal.pone.0135151. [DOI] [PMC free article] [PubMed] [Google Scholar]
- Zahid S, Dolz-Marco R, Freund KB, Balaratnasingam C, Dansingani K, Gilani F, Mehta N, Young E, Klifto MR, Chae B, Yannuzzi LA, Young JA. Fractal Dimensional Analysis of Optical Coherence Tomography Angiography in Eyes With Diabetic Retinopathy. Investigative Ophthalmology & Visual Science. 2016;57(11):4940–4948. doi: 10.1167/iovs.16-19656. [DOI] [PubMed] [Google Scholar]
- Zhang A, Zhang Q, Chen CL, Wang RK. Methods and algorithms for optical coherence tomography-based angiography: a review and comparison. J Biomed Opt. 2015;20(10):100901. doi: 10.1117/1.JBO.20.10.100901. [DOI] [PMC free article] [PubMed] [Google Scholar]
- Zhang A, Zhang Q, Wang RK. Minimizing projection artifacts for accurate presentation of choroidal neovascularization in OCT micro-angiography. Biomed Opt Express. 2015;6(10):4130–4143. doi: 10.1364/BOE.6.004130. [DOI] [PMC free article] [PubMed] [Google Scholar]
- Zhang M, Hwang TS, Campbell JP, Bailey ST, Wilson DJ, Huang D, Jia Y. Projection-resolved optical coherence tomographic angiography. Biomed Opt Express. 2016;7(3):816–828. doi: 10.1364/BOE.7.000816. [DOI] [PMC free article] [PubMed] [Google Scholar]
- Zhang M, Hwang TS, Dongye C, Wilson DJ, Huang D, Jia Y. Automated Quantification of Nonperfusion in Three Retinal Plexuses Using Projection-Resolved Optical Coherence Tomography Angiography in Diabetic Retinopathy. Invest Ophthalmol Vis Sci. 2016;57(13):5101–5106. doi: 10.1167/iovs.16-19776. [DOI] [PMC free article] [PubMed] [Google Scholar]
- Zhang Q, Chen CL, Chu Z, Zheng F, Miller A, Roisman L, Rafael de Oliveira Dias J, Yehoshua Z, Schaal KB, Feuer W, Gregori G, Kubach S, An L, Stetson PF, Durbin MK, Rosenfeld PJ, Wang RK. Automated Quantitation of Choroidal Neovascularization: A Comparison Study Between Spectral-Domain and Swept-Source OCT Angiograms. Invest Ophthalmol Vis Sci. 2017;58(3):1506–1513. doi: 10.1167/iovs.16-20977. [DOI] [PMC free article] [PubMed] [Google Scholar]
- Zhang Q, Lee CS, Chao J, Chen CL, Zhang T, Sharma U, Zhang A, Liu J, Rezaei K, Pepple KL, Munsen R, Kinyoun J, Johnstone M, Van Gelder RN, Wang RK. Wide-field optical coherence tomography based microangiography for retinal imaging. Sci Rep. 2016;6:22017. doi: 10.1038/srep22017. [DOI] [PMC free article] [PubMed] [Google Scholar]
- Zhang Q, Wang RK, Chen CL, Legarreta AD, Durbin MK, An L, Sharma U, Stetson PF, Legarreta JE, Roisman L, Gregori G, Rosenfeld PJ. SWEPT SOURCE OPTICAL COHERENCE TOMOGRAPHY ANGIOGRAPHY OF NEOVASCULAR MACULAR TELANGIECTASIA TYPE 2. Retina. 2015;35(11):2285–2299. doi: 10.1097/IAE.0000000000000840. [DOI] [PMC free article] [PubMed] [Google Scholar]
- Zhang Q, Zhang A, Lee CS, Lee AY, Rezaei KA, Roisman L, Miller A, Zheng F, Gregori G, Durbin MK, An L, Stetson PF, Rosenfeld PJ, Wang RK. Projection Artifact Removal Improves Visualization and Quantitation of Macular Neovascularization Imaged by Optical Coherence Tomography Angiography. Ophthalmology Retina. doi: 10.1016/j.oret.2016.08.005. [DOI] [PMC free article] [PubMed] [Google Scholar]
- Zotter S, Pircher M, Torzicky T, Bonesi M, Gotzinger E, Leitgeb RA, Hitzenberger CK. Visualization of microvasculature by dual-beam phase-resolved Doppler optical coherence tomography. Opt Express. 2011;19(2):1217–1227. doi: 10.1364/OE.19.001217. [DOI] [PMC free article] [PubMed] [Google Scholar]