

Summary
Parental care is essential for the survival of mammals, yet the mechanisms underlying its evolution remain largely unknown. Here we show that two sister species of mice, Peromyscus polionotus and P. maniculatus, have large and heritable differences in parental behaviour. Using quantitative genetics, we identify 12 genomic regions that affect parental care, eight of which have sex-specific effects, suggesting that parental care can evolve independently in males and females. Furthermore, some regions affect parental care broadly, whereas others affect specific behaviours, such as nest building. Of the genes linked to differences in nest-building behaviour, vasopressin is differentially expressed in the hypothalamus of the two species, with increased levels associated with less nest building. Using pharmacology in Peromyscus and chemogenetics in Mus, we show that vasopressin inhibits nest building but not other parental behaviours. Together, our results indicate that variation in an ancient neuropeptide contributes to interspecific differences in parental care.
Introduction
In mammals, parental care is critical for the survival of young. Parental behaviour, however, is not uniform and instead varies in form and magnitude among individuals, between sexes, and across species. A particularly variable feature of parental behaviour is the care for young by their fathers, which occurs more often and to a larger extent in monogamous species than promiscuous ones1.
Parental care, performed by mothers and some fathers, encompasses an array of behaviours including retrieving, huddling, nursing, and grooming pups along with building a nest, which is often initiated or enhanced by the birth of a litter. The rich diversity of parental behaviours raises several questions about the evolution of parental care, particularly in monogamous mammals: How does the genetic architecture differ between males and females? Does evolution act on genetic loci that affect multiple components of parental behaviour in concert or do particular components have independent genetic underpinnings? What specific genes are involved? How does variation in these genes act within neuronal circuits to alter behaviour?
Comparative analyses of species with divergent social systems have offered important insights into the genetic and neurobiological basis of natural variation in social behaviour. Studies of monogamous and promiscuous voles defined a prominent role for the vasopressin and oxytocin pathways in affiliative behaviours, showing, for example, that differences in the spatial distribution of the vasopressin 1a receptor in the male brain are associated with changes in pair-bonding behaviour2,3. Oxytocin and vasopressin are known to regulate many aspects of parental care4–7, but how genetic variation in these pathways contributes to natural differences in parental care is poorly understood.
To study the genetic basis of parental care, we focused on mice of the genus Peromyscus, in which both social and genetic monogamy has evolved independently at least twice8 (Fig. 1a). One of these lineages consists of the promiscuous deer mouse (P. maniculatus bairdii)9,10 and its sister species, the monogamous old-field mouse (P. polionotus subgriseus)11,12 (Fig. 1a,b). These species are at opposite ends of a monogamy-promiscuity spectrum13, yet – in contrast to the classic vole species – they can interbreed in the laboratory. The remarkable divergence in behaviour between such closely related species offers a unique opportunity to define the genomic architecture of a mammalian social behaviour and to identify pathways and genes that contribute to the evolution of parental behaviour.
Figure 1. Parental behaviours of monogamous and promiscuous Peromyscus mice.
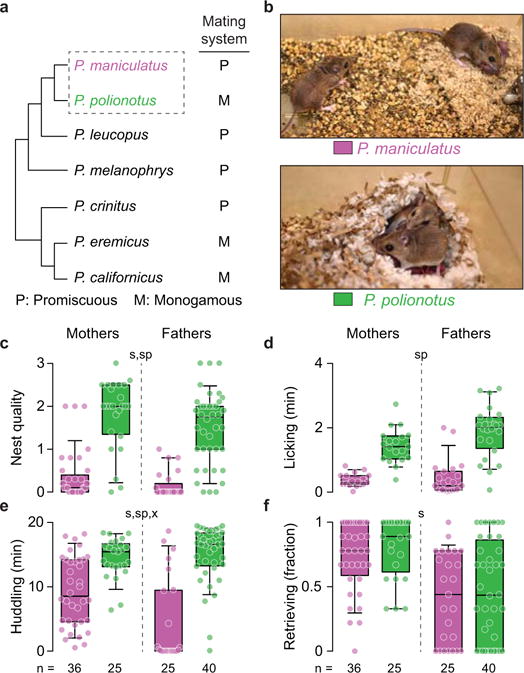
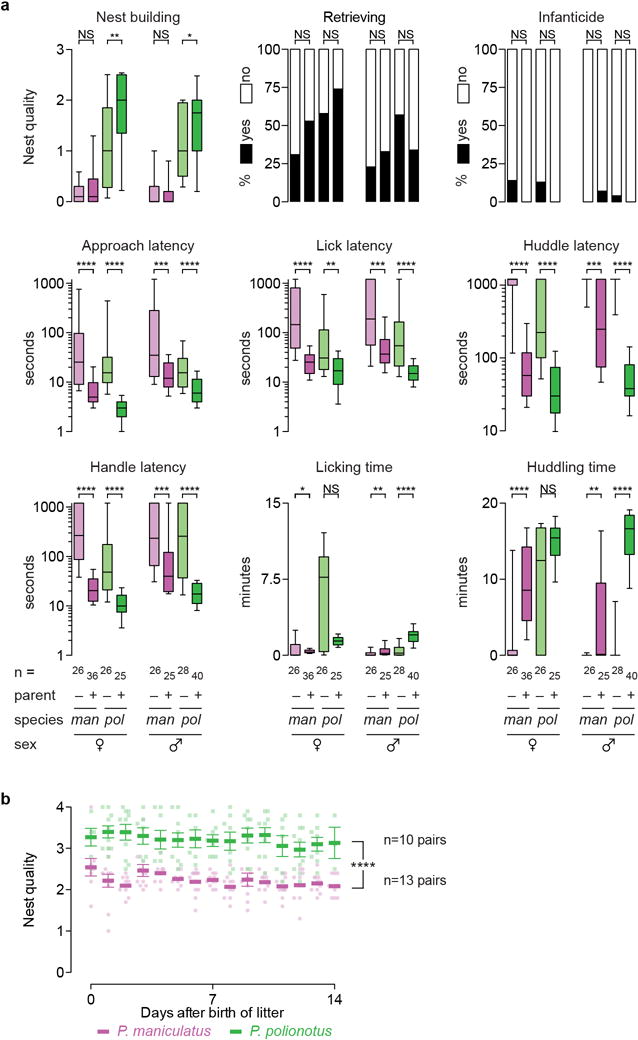
a) Cladogram of selected Peromyscus species, including known monogamous species (adapted from ref. 8). b) Typical P. maniculatus and P. polionotus parents in the laboratory. c–f) Parental behaviours of P. maniculatus and P. polionotus. Each circle represents the median behaviour of an animal tested three times (c–e) or the fraction of pups retrieved over the three tests (f). Box plots indicate median, interquartile range, and 10th to 90th percentiles. Kruskal-Wallis followed by Dunn’s (c) and two-way ANOVA results (d–f): significant effects of species (sp), sex (s), or sex-by-species interaction (x) at P<0.01.
Monogamous Peromyscus are more parental
First, we measured components of both maternal and paternal behaviour (Supplementary Videos 1–8) and found that, in general, P. polionotus fathers provided care similar to mothers, whereas P. maniculatus fathers provided little parental care. Specifically, P. polionotus fathers built nests, licked pups and huddled pups to the same extent as P. polionotus mothers and to a larger extent than both P. maniculatus fathers and mothers, but retrieved fewer pups than P. polionotus mothers (Fig. 1c–f). P. maniculatus fathers did as little nest building and pup licking as P. maniculatus mothers but huddled and retrieved pups significantly less than P. maniculatus mothers (Fig. 1c–f). Mothers of the two species also differed: P. polionotus provided more care than P. maniculatus in all behaviours but pup retrieval (Fig. 1c–f). Overall, we observed large differences in parental behaviour, and the differences are most pronounced in fathers.
To test whether these interspecific and between-sex differences in parental behaviour persist in less controlled conditions, we videotaped parents in their home cage for three consecutive days starting at the birth of a litter. Results were consistent with the shorter behavioural assays: P. polionotus fathers were more paternal than P. maniculatus fathers, whereas mothers of the two species were similar in their parental care (Extended Data Fig. 1). Together, both the acute and multi-day behavioural patterns align with the highly divergent mating systems of these two species.
Parental behaviour in Peromyscus is heritable
To determine if interspecific differences in parental behaviour are influenced by the parental care received as pups, we cross-fostered P. polionotus and P. maniculatus pups with parents from the other species (Fig. 2a). The parental behaviour of cross-fostered animals, once they became parents themselves, was indistinguishable from the parental care of non-cross-fostered animals (Fig. 2b–e). There were two exceptions: P. maniculatus males raised by P. polionotus parents lick and retrieve their own pups less than P. maniculatus males raised by their own parents. In sum, the care that pups receive does not explain species differences that emerge in adulthood, consistent with a strong heritable component to parental behaviour.
Figure 2. Effect of cross fostering on parental behaviour.
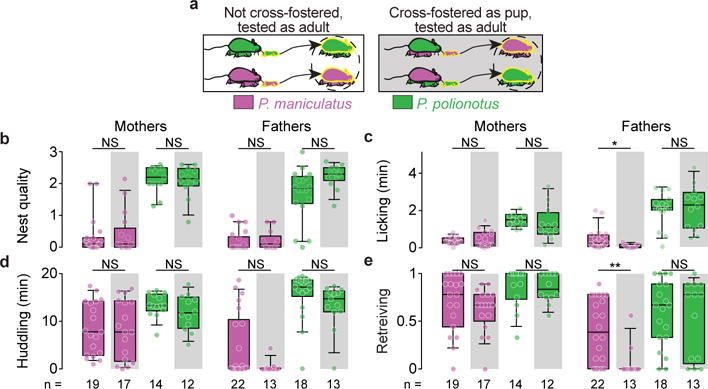
a) Design of the cross-fostering experiment between P. maniculatus and P. polionotus. b–e) Parental behaviour of animals raised by their own parents (white) or by parents of the other Peromyscus species (grey). Each circle represents the median behaviour of an animal tested three times. Box plots indicate median, interquartile range, and 10th to 90th percentiles. *, P<0.05; **, P<0.01; NS, not significant by two-sided Mann-Whitney U with Bonferroni correction.
Differences in parental care also may occur because P. polionotus pups demand more care than P. maniculatus pups. To test this possibility, we compared the parental behaviour of animals towards their own pups to the behaviour towards pups from the other species. In general, fathers and mothers of both species behaved indistinguishably towards their own pups and pups of the other species (Extended Data Fig. 2 and Supplementary Discussion), indicating that the higher levels of parental behaviour in P. polionotus are not due simply to an increased demand of care by their pups.
Genetic architecture of parental care
Encouraged by the large and plausibly heritable differences in parental behaviour between P. polionotus and P. maniculatus, we conducted an interspecies cross to identify genetic components that modulate parental behaviour. We first crossed P. maniculatus females to P. polionotus males to generate (F1) hybrids. Next, we intercrossed these F1 hybrids to generate 769 F2 hybrids (419 males and 350 females) and measured parental behaviour towards their F3 pups (Fig. 3a). The distribution of each component of parental care among the F2s encompassed the distributions of both species (Fig. 3b–e). Based on the largely unimodal distributions of parental behaviours among the F2 hybrids, which resemble P. maniculatus more closely than P. polionotus, the more extensive parental care of P. polionotus likely involves more than one genetic locus.
Figure 3. Distribution of parental behaviours in each species and their interspecific hybrids.
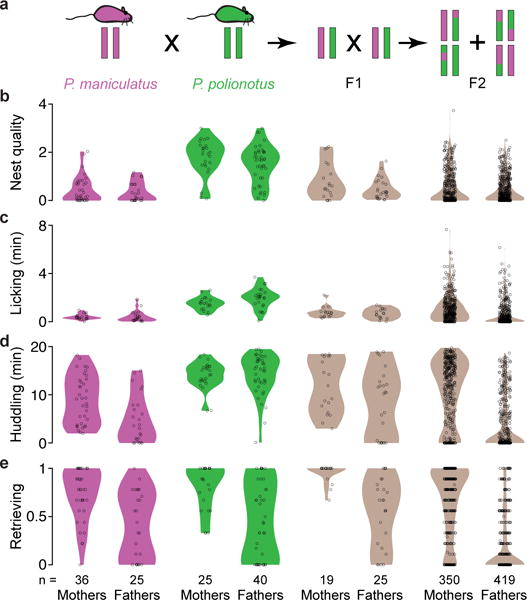
a) Genetic cross design. Female P. maniculatus were mated to P. polionotus males to found the cross (see Methods); the behaviour of females and males of each species is shown here for comparison. b–e) Violin plots show the distribution of behaviours. Each dot represents the mean behaviour of an animal over three trials.
Next, we tested for correlations among behaviours in the F2 progeny and analysed the sexes independently (Fig. 4a). We found that time spent huddling and licking were positively correlated in both males and females (Spearman correlation (rs) = 0.88, 0.66, respectively), and these two behaviours were also strongly correlated with pup retrieval (huddling-retrieving rs = 0.60 in males, 0.51 in females; licking-retrieving rs = 0.52 in males, 0.45 in females). In males, huddling and licking were also correlated with how soon they handled the pup after the assay started (rs = 0.72 for both). By contrast, in both males and females, nest-building behaviour had much weaker correlations with the other parental behaviours (rs ranged from 0.23–0.43 in males, 0.22–0.31 in females). These results suggest that some genetic loci affect multiple parental behaviours, whereas nest building is more genetically independent from the other behaviours measured.
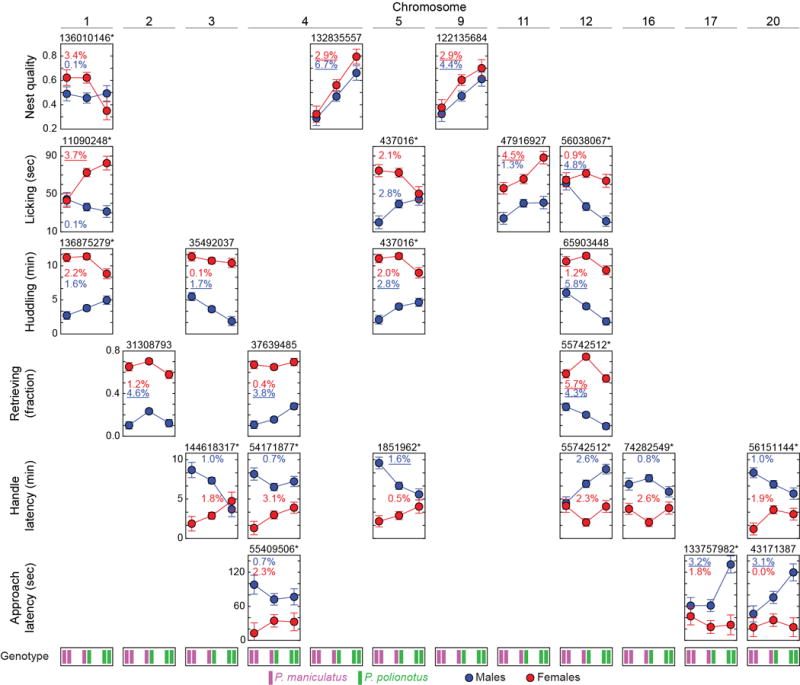
Figure 4. The genetic architecture of parental behaviour.
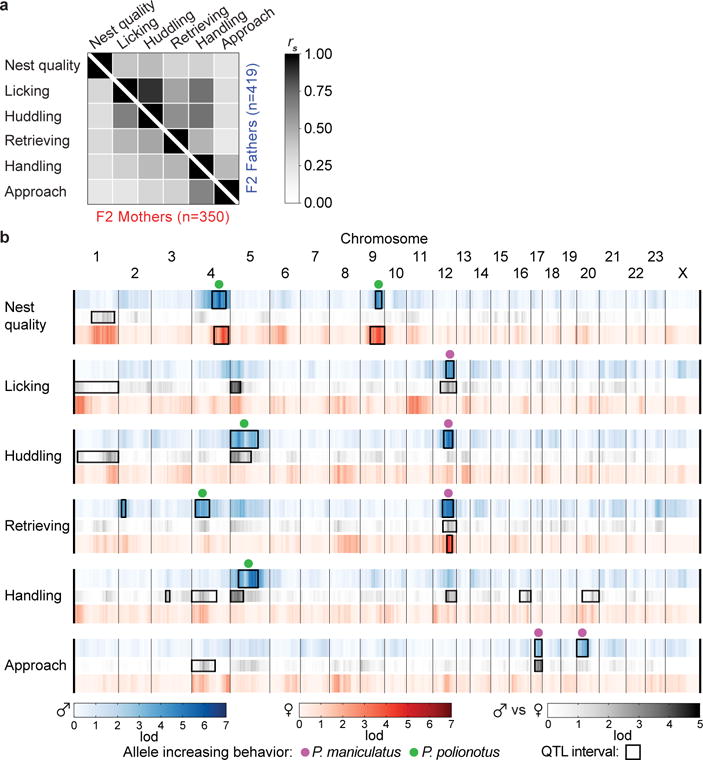
a) Correlation matrix of parental behaviours in F2 hybrids. b) The linkage (lod score) of each behaviour to each marker in each sex and the sex-by-genotype interaction (gray). Boxes delineate the Bayes 0.95 credible interval of QTL of genome-wide significance (α=0.05). Dots denote the allele at the peak of the QTL that correlates with a higher value for that behaviour (for handling and approach, a decrease in latency to perform behaviour). Heterozygotes at QTLs on chromosomes 2 and 12 (females only) retrieve more pups (see Extended Data Fig. 4 and Supplementary Discussion).
To identify specific genetic regions that mediate the differences in parental behaviour between P. polionotus and P. maniculatus, we performed Quantitative Trait Locus (QTL) analysis. To start, we assembled the P. maniculatus genome into chromosomes, becoming the fifth rodent genome assembled to the chromosomal level. To genotype the F2 animals, we combined double-digest Restriction Associated DNA sequencing (ddRAD-Seq14) with multiplexed shotgun genotyping (MSG15). Using this strategy, we genotyped the 769 F2 mice at 406,611 loci and then used the 56,068 most informative loci. By combining behavioural and genetic data, we identified 12 independent QTLs on 11 chromosomes that contribute to one or more of the six behaviours measured (Fig. 4b and Extended Data Fig. 3,4; see Supplementary Discussion for validation and potential false positives).
Sex-specific genetics of parental care
Of the 12 QTLs, eight showed evidence of having different effects in the two sexes as determined by a QTL analysis with sex as a covariate (Fig. 4b). Genotypes at some QTLs preferentially affect the behaviour of one sex, and at other QTLs they affect behaviour in opposite directions in the two sexes (Extended Data Fig. 4 and Supplementary Discussion). In addition, the strength of correlation between genotype and parental behaviour is often very different between the sexes (Fig. 4b), suggesting that some genetic variants have a stronger effect in one sex than the other. Together, these results indicate that the genetic architecture of parental behaviour differs between males and females.
Several QTLs had effects on specific parental behaviours, whereas others affected more than one behaviour. For example, one QTL on chromosome 4 and one on chromosome 9 were linked to nest building in both males and females, but are not associated with any other behaviours (Fig. 4b, Extended Data Fig. 3 and Supplementary Discussion), consistent with the low phenotypic correlation between nest building and the other parental behaviours (Fig. 4a). By contrast, we found two QTLs that affected several aspects of paternal behaviour: a chromosome 12 QTL affected huddling, licking, and retrieving of pups, and a chromosome 5 QTL affected huddling and latency to handle pups (Fig. 4b and Extended Data Fig. 3). These data raise the possibility that there are genes that have specific behavioural effects and others that can affect parental behaviour more broadly.
A QTL for parental nest building
We next focused on a QTL on chromosome 4 that was associated with parental nest building and had the strongest effect on behaviour of all QTLs (Extended Data Fig. 4). Nest building is a core component of the parental behaviour of vertebrates16, which, in Peromyscus, increases significantly when animals become parents (Extended Data Fig. 5a). Moreover, monogamous P. polionotus build more elaborate nests during an acute parental assay, and P. polionotus pairs maintain more elaborate nests than P. maniculatus for at least two weeks after the birth of their pups (Extended Data Fig. 5b). The chromosome 4 QTL was not detected when the nest building of the same animals was measured before mating (data not shown), implying that this QTL is important in a parental context. These results indicate that the chromosome 4 QTL affects an interspecific difference in nesting behaviour that is enhanced by, and maintained during, parenthood.
To identify genes mediating interspecific differences in parental nest building, we first determined which of the genes in the chromosome 4 QTL differed in their protein sequence. Of the 498 genes encompassed by both the male and female QTL regions, 34 had interspecific differences (Supplementary Data File 1), but only four were predicted to affect protein function (absolute PROVEAN17 score > 2.5): sulfide quinone reductase-like and mitochondrial antiviral signaling protein, which localize to mitochondria18,19, congenital dyserythropoietic anemia type I, which is expressed ubiquitously and involved in erythropoiesis20, and glial cell line derived neurotrophic factor family receptor alpha 4, a protein not expressed in the brain21. None were strong candidates to affect nest building.
We next determined which of the genes in the QTL differed in interspecific expression level. We focused on the hypothalamus, a brain area that contains both the medial preoptic area and the paraventricular nucleus (PVN), regions critical for parental nest building in rodents22,23. Only 23 genes differed in expression between the two species (Extended Data Fig. 6 and 7a). Of these, nine showed allele-specific expression differences in F1 hybrids, which provides evidence of local cis-acting mutation(s) that affect expression, a feature expected of causal genes in QTL regions (Fig. 5a; Extended Data Fig. 7b; Methods), and thereby further narrowing the list of candidate genes.
Figure 5. Role for vasopressin in parental nest building.
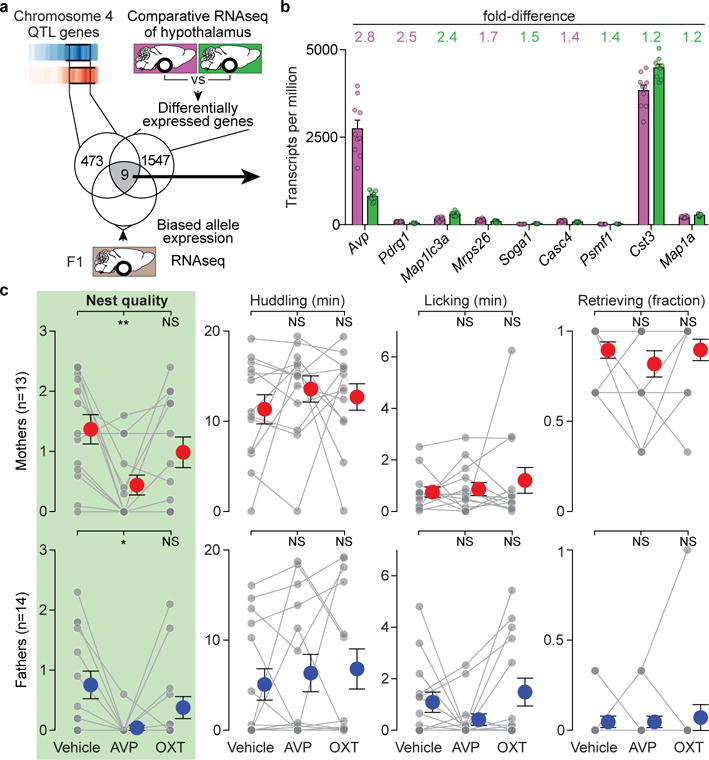
a) 23 genes in the nest-building QTL on chromosome 4 are differentially expressed in the hypothalamus of the two species, 15 of which had interspecific variants required for allele-specific analysis in F1 hybrids. b) Expression of the 9 candidate genes from (a) in P. maniculatus (magenta) and P. polionotus (green) hypothalamus. The voom-transformed difference in expression is shown above; colour indicates the species with higher expression. Circles represent each individual. No significant differences between sexes for any gene. c) Parental behaviours of P. polionotus following vehicle, 100 ng vasopressin (AVP) or 100 ng oxytocin (OXT) administration intracerebroventricularly. Each individual (grey) is connected by lines. Red and blue circles with whiskers indicate mean ± SEM *, P<0.05; **, P<0.01; NS, not significant by Friedman followed by Dunn’s compared to Vehicle.
Vasopressin inhibits nest building
Arginine vasopressin (Avp), an important modulator of social behaviours, including maternal care5,24, stood out as a top candidate gene for variation in nest building. It is found within the large-effect nest-building QTL, highly expressed (among the 4% most highly expressed genes in the hypothalamus), robustly differentially expressed between the two species in both sexes (2.8-fold higher levels in P. maniculatus than P. polionotus; moderated t-statistic, FDR-adjusted P=5×10⁻⁵), and showed allele-specific expression (Fig. 5a; Extended Data Fig. 7b and 8). These results are consistent with differences in vasopressin protein levels in the PVN of these species25. Moreover, while vasopressin is known to promote anxiety in rodents26, our genetic analyses of anxiety-related behaviour in the same animals argue that effects of vasopressin on parental nest-building behaviour in Peromyscus are not mediated simply through changes in anxiety (Extended Data Fig. 9; Supplementary Discussion). Thus, vasopressin emerged as a strong candidate to test for a role in variation in parental nest-building behaviour in Peromyscus.
We next performed pharmacological experiments to determine if vasopressin regulates nest building in Peromyscus. Consistent with the inverse relationship between vasopressin levels and nest building in both Mus musculus27 and Peromyscus (this study), intracerebroventricular administration of vasopressin into parents of the high nest-building P. polionotus inhibited nest building (Fig. 5c). The inhibition of nest building was specific to vasopressin, as the highly similar nonapeptide oxytocin did not have a measurable effect on this behaviour. Remarkably, vasopressin administration did not impact any other parental behaviours measured, in line with the specificity of the QTL containing the vasopressin gene for nest building (Fig. 5c).
To confirm that vasopressin can suppress nest building, we performed chemogenetic experiments in Mus musculus, where we could specifically manipulate the activity of vasopressin neurons. Consistent with our expectations, inhibition of vasopressin neurons in the PVN, the only vasopressin nucleus previously implicated in nest building (by lesion studies23), increased nest building, whereas excitation decreased nest building (Extended Data Fig. 10, and Supplementary Discussion). Together, our results indicate that vasopressin has an inhibitory effect on parental nest-building behaviour as shown in P. polionotus and confirmed in Mus musculus.
Discussion
Here, using a pair of sister species that lie at opposite ends of the monogamy-promiscuity spectrum, we documented large, heritable differences in parental behaviour and then dissected the genetic architecture of this behavioural variation. Consistent with the largely polygenic nature of variation in behaviour28, we found that the recent evolution of increased parental care in the monogamous P. polionotus involved many genetic regions spread across the genome. Most of these regions have sex-specific effects, suggesting that variation in male and female parental care has a different genetic basis, even if many of the behaviours appear similar between the sexes. Some brain sexual dimorphisms are thought to compensate for other biological differences between the sexes (like pregnancy and parturition only in females), ensuring that males and females behave similarly29. Our results provide genetic evidence of this phenomenon: monogamous males and females evolve through different genetic routes to achieve similarly high levels of parental care.
Ethological observations and theory30,31 as well as neurobiological experiments31,32 indicate that behaviours are often hierarchically organized such that an internal state (such as hunger) can motivate multiple specific behaviours related to that state (such as searching for and then consuming food). This organization is further manifested in the brain: some brain areas and neuron types contribute to the control of an entire suite of related behaviours, while other neurons control the execution of specific behaviours. For example, galanin neurons in the medial preoptic area of the hypothalamus are essential for multiple components of parental care33, and more discrete neuronal types likely control the execution of each component. However, it is unknown how this hierarchical organization is manifested at the genetic level. Here we found genetic loci that affect parenting behaviour broadly, and others that are specific to a particular parenting behaviour sequence. Thus, the genetic architecture of parental behaviour mirrors its neuronal organization, and our results begin to provide novel molecular handles for multiple levels of this hierarchy, such as vasopressin and nest building.
It has long been argued that neurotransmitter and neuromodulator receptors are preferred targets of evolutionary change in behaviour because altering their expression pattern or levels can be more modular, hence less pleiotropic, than mutations in the respective ligands34,35. Here we uncovered a case where differences in the levels of the vasopressin peptide itself has likely contributed to interspecific variation in parental behaviour, arguing that, at least in some instances, genetic polymorphism affecting neuromodulators can contribute to behavioural evolution.
Our genetic dissection of parenting – from natural behaviour to candidate gene – opens exciting new avenues of research for the neurobiological and circuit-based understanding of a complex social behaviour. In particular, discovering molecular and neural mechanisms by which genes with sex-specific effects act to modulate behaviours common to both sexes, and how highly pleiotropic genes like vasopressin may change only specific aspects of behaviour, represent important next steps in understanding how behaviours and the brain evolve.
Methods
Animal husbandry
We established colonies of Peromyscus maniculatus bairdii (strain BW) and Peromyscus polionotus subgriseus (strain PO) at Harvard University from animals originally obtained from the Peromyscus Stock Center at the University of South Carolina. We housed animals in barrier, specific-pathogen free conditions with 16 h light : 8 h dark at 22 °C in individually ventilated cages (7.75 in wide × 12 in long × 6.5 in high, Allentown, Allentown, NJ) with ¼ inch Bed-o-cob bedding (The Andersons, Inc., Maumee, OH). Breeding animals and their litters were fed irradiated PicoLab Mouse Diet 20 5058 (LabDiet, St. Louis, MO) ad libitum and had free access to water. We weaned animals at 23 days of age into cages with at most four other members of the same strain and sex. After weaning, we fed animals irradiated LabDiet Prolab Isopro RMH 3000 5P75 (LabDiet, St. Louis, MO) ad libitum with free access to water and provided them with nesting material (Nestlet, Ancare, Bellmore, NY) and a polycarbonate translucent red hut. Animal experimentation protocols were approved by the Harvard FAS IACUC.
Parental behaviour assay
We tested animals for parental behaviour when their pups were 4, 5 and 6 days old. Parental behaviour was tested with the first litter unless otherwise noted. Testing was carried out between zeitgeber time (ZT) 6 and ZT 15. We transferred animals to a testing room adjacent to the housing room. The female, pups, nest, red hut and food hopper were transferred to a new cage and placed 30–300 cm from the male cage, undisturbed while the male was being tested.
To begin each assay (time 0), we gave ~0.625 g of compacted cotton nesting material (Ancare, Bellmore, NY) to the male within 1 minute of being transferred to the test cage. At 30 minutes, we placed one of the animal’s own pups inside the cage (in the center of the cage if the male had built a nest in a corner or was sitting in a corner or in a corner if the animal had built a nest in the center). We then scored the latency to approach the pup, to handle (move) the pup with the front paws, to lick the pup, to huddle over the pup (by covering at least 50% of the pup’s body with the parent’s body) and to retrieve the pup (pick up the pup with the mouth and displace it from its original position). We also scored the total time licking the pup and huddling over the pup until minute 50, when we scored nest quality according to the scale described below. At minutes 50 and 52 (20 and 22 minutes after adding the pup), we added another of the fathers’ own pups to the cage (following the same placement guidelines as above and at least 5 cm from pups already in the cage) and scored the time to retrieve the pup. If there were fewer than three pups in the litter, we used one of the pups again (removing it at minutes 50 and 52), waiting 10–15 seconds before adding it back to the cage to measure retrieval. We tested female mice in a similar fashion, after the male, in the new cage where she had been placed at the beginning of the assay.
The experimenter scored each assay ~200 cm from the cage by observing the cage and a monitor with a video feed from the side of the cage opposite to the experimenter. This double view facilitates scoring of all behaviours but particularly huddling and licking. In Figures 1 and 2, we used the median of the three tests for each behavioural parameter. To increase genetic mapping resolution by avoiding ties in the F2s, however, we used the mean of the three tests.
Nest quality score
We used the following scoring system to quantify nest-building behaviour: 0 = nesting material is not shredded; 1 = all of the nesting material is shredded but is scattered; 2 = nesting material is shredded and gathered in a flat platform; 3 = nesting material is shredded and has enough height to cover the entire animal; 4 = nest covers the entire animal including a complete roof. Nests that are between two of the above categories received an intermediate score in increments of 0.1.
Home cage long-term behavioural observations
We set up breeding cages as described above in Animal husbandry. Two days before their first litter, we attached three cameras (Microsoft LifeCam HD-5000, with the infrared cut filter removed, adapted with an OEM 180° 0.25X fisheye lens, and a Neewer 720 nm longpass filter over the fisheye lens) to the cage. Two cameras were inside the cage, above the food hopper and one camera was outside of the cage, on one side, focused on the nest. We illuminated the cage with a strip of infrared LED lights attached to the outside of the cage, near the top. To provide a better view of the parents and pups, we removed part of the nest, leaving enough nesting material for a nest with walls but not enough for a roof. The cameras were connected to a computer that recorded continuously with a custom Python script from before birth to three days after birth.
We scored the following behaviours on the video recordings, sampling 5 min from every hour at one hour intervals: amount of time in and outside the nest, time licking pups, time huddling over the pups, time building nest, time retrieving pups, time grooming their mate.
Cross-fostering experiments
Within 24 h of birth, we exchanged pups from one species (P. polionotus or P. maniculatus) with pups of the other species that were also born within 24 h. In no case was there any obvious rejection of the pups. We weaned cross-fostered pups at 23 days of age with pups of their biological species in cages of five animals of the same sex, in the same way as non-cross-fostered animals. At 60–90 days old, we paired cross-fostered animals with an animal of their own biological species (cross-fostered or not) and tested parental behaviours as described above. Number of litters cross-fostered animals represent: P. polionotus mothers: 8; fathers: 9; P. maniculatus mothers: 9; fathers: 7.
Cross design
To generate a genetically heterogeneous F2 hybrid population, we first mated four P. maniculatus females to four P. polionotus males. We were limited to only a single cross direction because of excessive fetal growth and the resultant death of mothers when P. polionotus females were mated with P. maniculatus males36. Next, 16 F1-sib pairs were intercrossed to generate 769 F2 hybrids. These F2 individuals have autosomes that are a recombinant mix of the two species as well as the P. maniculatus mitochondria, and males carry the P. polionotus Y chromosome.
Double-digest Restriction Associated DNA sequencing (ddRAD-seq)
We performed ddRAD-seq as described in Peterson et al14, with some modifications. In brief, we extracted DNA from a liver sample using the AutoGenprep 965 (Autogen). Next, we digested DNA with MluCI and NlaIII enzymes (New England Biolabs), ligated fragments to biotinylated barcoded adapters and combined in pools of ≤48 samples. Using a Pippin Prep (Sage Science), we selected fragments of 216–276 bp and purified biotinylated fragments with streptavidin beads, then PCR amplified for 10 cycles using Phusion (New England Biosciences). We evaluated the quality of the final libraries in a 2200 TapeStation (Agilent Technologies) and quantified them fluorimetrically with a Qubit 2.0 (ThermoFisher Scientific).
We sequenced 384 individuals per lane of an Illumina HiSeq 2500 with HiSeq v4 chemistry in High output mode and paired-ends (2 × 125 bp) to a median depth of 7.8 × 10⁵ reads per individual. We then processed Illumina fastq files into separate files based on Illumina multiplex read indices. We merged and trimmed overlapping paired ends to remove adapter sequence readthrough and then further de-multiplexed based on the custom barcode.
Overlapping reads were pre-mapped to the P. maniculatus bairdii (strain BW) genome reference (Pman_1.0, GenBank assembly accession: GCA_000500345.1) using BWA 0.7.5a37 and then re-mapped using Stampy 1.0.1838. Using GATK 2.7-2, we re-aligned reads and called genotypes using UnifiedGenotyper39.
Chromosome-level map of Peromyscus maniculatus genome
The Peromyscus maniculatus bairdii (BW) draft reference genome (Pman_1.0, GenBank assembly accession: GCA_000500345.1) has a total sequence length of 2,630,541,020 bp and is assembled into 30,921 scaffolds with a N50 of 3,760,915 bp. To anchor scaffolds into chromosomes, we used genetic linkage data, which reflects the ordering and relative orientation of scaffolds in each linkage group. The procedure involved the following steps:
To minimize conflicts in genetic linkage arising from translocations, inversions and other structural variants that could arise in an interspecific cross, we used genetic information from an intraspecific cross between P. maniculatus bairdii (BW) and P. maniculatus nubiterrae (NUB) from Pennsylvania (unpublished results). We genotyped 403 F2 individuals with ddRAD-seq, using EcoRI - NlaIII fragments of 216–276 bp. After quality filtering (QD>5, GQ>20, removing markers with identical genotypes in all F2s, and markers with genotypes in less than 220 F2s), we obtained 1,779 high-confidence markers.
A genetic map was constructed from these 1,779 markers using R/qtl and marker ordering was optimized following guidelines from http://www.rqtl.org/tutorials/geneticmaps.pdf. This produced a map of with 23 autosomal linkage groups as expected based on the number of P. maniculatus chromosomes40,41. The X chromosome markers were identified via model-based clustering that uses the heterozygote frequencies of markers in males and in females, using the Mclust function in the mclust package in R42. We assigned 130 markers to the X chromosome and determined their order as we did for the autosomes.
We ordered the 557 scaffolds represented by these 1,779 markers based on the relative position of the markers and oriented them whenever there was more than one marker per scaffold. Spacing between scaffolds was based on the median genetic to physical distance correspondence of 1.4 cM/Mb calculated with the scaffolds with more than one marker.
This chromosome-level map was used for MSG genotyping of the P. maniculatus × P. polionotus F2s. The recombination fraction plots were examined in detail using plotRF (R/qtl) and iplotRF (R/qtlcharts43), and scaffolds were moved to a place with higher linkage, whenever possible. This generated a new map that was used for a new MSG run and further improvement of the scaffold coordinates. This cycle was repeated 13 times, when no further improvement was seen. At this point, the 557 scaffolds encompassed 1,872,038,949 bp, or 71% of the total sequence in the Pman_1.0 assembly.
To add additional scaffolds (and thus include a larger fraction of the genome) to our chromosome-level map, we genotyped 614 P. maniculatus × P. polionotus F2s using high-confidence GATK genotypes (DP>7) directly (as opposed to genotype probabilities from MSG), from ddRAD libraries sequenced at higher coverage. We then mapped these markers into the existing genetic map using Haley-Knott regression. This procedure allowed us to add 1,166 scaffolds to the map.
Scaffold coordinates (chromosomal location and orientation) were optimized as described in step 4, eight times, when no further improvement was seen.
We assigned chromosome names to the linkage groups in our map based on the localization of known genes in Peromyscus chromosomes in our linkage groups44. Chromosomes 16 and 21 from Kenney-Hunt et al.44 are represented by a single linkage group in our map, and there was no obvious position to split this linkage group, as there was strong linkage among markers throughout. Based on new data from fluorescence hybridization experiments (M. Felder and R. O’Neill, personal communication), we find that chromosome 8a corresponds to chromosome 16, 8b is chromosome 8, and in agreement with our linkage results, published chromosomes 16 and 21 should both be included in chromosome 21. The chromosome names reported here reflect this updated nomenclature.
Our map includes 1723 scaffolds, which encompass 2,444,934,125 bp (93% of the total sequence in Pman_1.0), in 23 autosomes and the X chromosome (Supplementary Data File 2). Genetic linkage data suggests that 63 scaffolds are erroneous chimeras, since different parts of those scaffolds map to different chromosomes or different parts of a single chromosome.
Multiplexed Shotgun Genotyping
To identify variants fixed between the P. maniculatus and P. polionotus founders of our intercross, we performed ddRAD-seq in eight founders of the cross (four per species). We used Picard (http://broadinstitute.github.io/picard/) to merge the reads of the four animals of each species into one pseudo-individual of each species and then used GATK 2.7-2 UnifiedGenotyper to genotype the two pseudo-individuals. Variants called at GQ >15 that were opposite homozygotes in the two pseudo-individuals amounted to a preliminary set of 961,137 fixed variants. To eliminate variants that were not fixed, we genotyped 614 of the F2s in additional HiSeq lanes (as described above) to a median depth of 1 × 10⁶ reads per individual. Only ¼ of the F2s are expected to be homozygous at a given variant, so we removed the 124,629 variants that were homozygous in all F2s genotyped at that position with a DP ≥ 7. This left us with a set of 836,508 fixed variants.
Next, we performed MSG as described in Andolfatto et al15, with some modifications. From Samtools45 mpileups of the GATK RealignedReads BAMs, we extracted the fixed variants and kept only those that were separated by at least 1 kb, thus ensuring they originated from independent reads. We formatted these filtered mpileups to be compatible with the Hidden Markov Model ( fit-hmm.R) step of MSG and started the MSG pipeline at that step. Before running fit-hmm, the variants in each scaffold were combined into chromosomes based on the coordinates from our chromosome-level assembly (described above). We used the following settings in fit-hmm:
deltapar1 0.015
deltapar2 0.015
recRate 25
rfac 1
priors 0.25,0.5,0.25
XpriorsFemales 0.5,0.5,0.0
theta 1
one_site_per_contig 1
We combined fit-hmm data of all F2s using https://github.com/JaneliaSciComp/msg/combine.py, which yielded 406,611 variants. Many of these variants contain redundant information, because there is no recombination between them. Therefore, we filtered variants to include only neighbouring markers with a genotype conditional probability that differed by at least 0.1, using https://github.com/dstern/pull_thin46 with the following settings:
difffac = 0.1
chroms = all
cross = f2
autosome_prior = 0.25
X_prior = 0.25
This procedure yielded 56,068 variants that were used for QTL analysis.
Quantitative Trait Locus analysis
We calculated the number of F2 hybrids to be tested (i.e., 350 per sex) to achieve enough power to detect even modest QTLs; this sample size provides 90% power at a 5% false positive rate to detect QTLs (in QTL scans separated by sex) that individually explain ≥ 4% of the variance in behaviours among the F2s47. QTL analysis was performed using R/qtl48. Ancestry probabilities of the 769 F2s were imported into R/qtl as genotype probabilities using https://github.com/dstern/read_cross_msg/read.cross.msg.1.5.R46. We performed non-parametric interval mapping separately on males and females. We determined significance thresholds by 1,000 permutations of the data using scanone. We also performed additional scans to search for QTLs with different effects in the two sexes using Haley-Knott regression on nqrank normalized traits, using sex as an interactive and an additive covariate and subtracting the lod scores from a scan with sex as an additive covariate alone. For permutations to determine significance thresholds, we used the same random seed for both of these scans. We calculated the variance explained by the QTL of nqrank normalized values in F2s using 1–10−2*LOD/n as implemented in fitqtl from R/qtl.
Comparative transcriptomics
To estimate mRNA abundance in whole hypothalamus of P. maniculatus and P. polionotus, we conducted an RNAseq experiment. Specifically, immediately after a parental behaviour assay on the sixth day after the birth of their litter, we euthanized five male and five female parents by CO2 inhalation for 2 minutes and collected hypothalami according to49. We immersed the tissue in ice-cold TRIzol reagent (Thermo-Fisher, Waltham, MA) and disrupted the tissues with a motorized pestle prior to storage at −80°C until processing. Hypothalamus samples from males and females from both species were processed together from RNA extraction to sequencing to alleviate batch effects. Total RNA was extracted using Direct-zol-96 RNA (Zymo Research, Irvine, CA) and used as input to isolate messenger RNA with NEB magnetic mRNA isolation kit (New England Biolabs, Ipswich, MA). We constructed cDNA libraries using the NEBNext® Ultra™ Directional RNA Library Prep Kit for Illumina (NEB, Ipswich, MA). Multiplexed libraries were sequenced on an Illumina HiSeq 2500 (Illumina, San Diego, CA) with HiSeq v4 chemistry in High output mode and paired-ends (2 × 125 bp). Libraries from males and females from both species were sequenced in the same lanes to alleviate batch effects. The average depth per sample was 46.1 million reads. We removed low quality and adaptor bases from raw reads using TrimGalore v0.4.0 (http://www.bioinformatics.babraham.ac.uk/projects/trim_galore/) and mapped the cleaned reads to the genome using the STAR RNA-Seq aligner v2.4.2a in two-pass mode50. We obtained the P. maniculatus genome sequence and annotation from the Peromyscus Genome Project (Pman_1.0, GenBank accession: GCA_000500345.1). We created a P. polionotus genome and annotation by incorporating SNPs and indels into the P. maniculatus Pman_1.0 reference using the AlleleSeq package51 and the UCSC liftover tool. Briefly, P. polionotus gDNA reads (Genbank BioProject accession: PRJNA53593) were aligned to the Pman_1.0 reference using Stampy38 v1.0.21 with a substitution rate=0.04. The resulting alignment files were pre-processed according to the GATK Best Practices. We used Haplotype Caller to perform variant calling as implemented in GATK 3.3-0 and filtered out variants with non-reference allele frequency < 0.50.
We estimated expression using STAR alignments in transcriptomic coordinates and the RSEM package52, and calculated differential expression using the limma package following voom transformation of the estimated counts53,54. Raw read counts for genes with counts per million (cpm) value >1 in at least three samples (15,729 genes) were used as inputs to tbe limma/voom pipeline and scale normalization of the RNA-seq read counts was performed using the TMM normalization method55. The Benjamini and Hochberg method56 was used for adjusting for multiple testing, and we report values of expression at an FDR of 5% for the species factor in a linear model that included species, sex and species × sex as factors.
Allele-specific expression analysis
We crossed two P. maniculatus females to two P. polionotus males to produce F1 hybrids. Then, we dissected the hypothalamus of 6 female and 6 male adult F1 offspring. We used the same procedure described above to sequence RNA libraries. Then we aligned the quality and adapter trimmed reads to a hybrid diploid P. maniculatus/P. polionotus genome using STAR v2.4.2a50. For each gene, we selected variants common to all isoforms and kept only the variants that were homozygous for opposite alleles in the two species. Of the 23 genes that were differentially expressed between P. maniculatus and P. polionotus and present in the chromosome 4 nest-building QTL, 15 had variants that allowed us to distinguish the species of origin of the transcripts in the F1 hybrids. We counted the number of reads containing the P. maniculatus allele or the P. polionotus allele in the F1 hybrids. Using 1–3 variants per gene, we fitted a linear model for each gene in the R package (lm(ln(maniculatus mapping reads/number of variants)-ln(polionotus mapping reads/number of variants) ~ sex) and identified genes with significant differences in allele-specific expression at an FDR of 5%.
To perform allele-specific expression analysis of Avp by droplet digital PCR (ddPCR), we extracted RNA from whole brain or from specific brain regions. We extracted RNA from whole brain RNA using Trizol and chloroform, cleaned the RNA using Qiagen RNAeasy columns, and made cDNA with Quanta qScript cDNA Supermix followed by DNAseI digestion. To microdissect individual vasopressin-producing nuclei, we froze freshly dissected brains in Tissue-Tek O.C.T. compound over dry ice, then mounted brains in cryostat, sectioned coronally until we reached the most posterior part of the anterior commissure and finally made 1 mm diameter, ~1.5 mm thick punches with the aid of a stereo microscope (Extended Data Fig. 8a). We quickly froze these punches in RNAqueous-Micro Total RNA Isolation Kit (Ambion) lysis solution on dry ice, and extracted RNA following the manufacturer’s protocol. Finally, we made cDNA followed by DNAseI digestion using Superscript VILO (Invitrogen).
We used a BioRad QX200 Droplet Generator to create droplets, BioRad S1000 for PCR, a QX200 Reader to read droplets, and BioRad ddPCR Supermix for probes (No dUTP), all according to manufacturer’s instructions.
We used a TaqMan SNP Genotyping assay (ThermoFisher) targeting the Avp SNP (P. maniculatus=C, P. polionotus=T) at position NW_006501268.1:1,146,329:
Primer 1: CCTAATGCTCGCCAGAATGCT
Primer 2: CAGCAGGCTCAGGAAGCAA
Reporter 1: AACGCCACGCTGTCT
Reporter 2: AACGCCACACTGTCT
Protein-coding variant analysis
For variant calling using the hypothalamus RNAseq data, we mapped the cleaned reads from P. maniculatus and P. polionotus to the Pman_1.0 reference genome using the STAR RNA-Seq aligner v2.4.2a in two-pass mode and applying a MAPQ of 60 for uniquely mapped reads. The resulting alignment files were pre-processed according to the GATK Best Practices recommendations for calling variants on RNAseq data. Briefly, duplicate reads were marked using Picard (v 1.115) and reads spanning introns were split into exon segments using the SplitNCigarReads function of GATK. Next, we used HaplotypeCaller to perform variant calling as implemented in GATK 3.3-0 on each sample separately using the GVCF mode. Joint genotyping was subsequently performed using all gvcf files simultaneously allowing a maximum of 12 alternate alleles. We employed SnpEff version 4.357 to annotate and predict the effects of variants on genes.
From the SnpEff-annotated vcf, we determined the genes with fixed differences between the species. 21,316 protein-coding genes out of 22,720 in the annotation had variants that passed our quality filters (GATK’s Best Practices: QD > 2, FS < 30; plus DP > 4), indicating we could determine variation in 94% of genes in the genome using hypothalamus RNAseq. To be considered a fixed difference, variants had to be called in at least three individuals of the ten individuals per species, be homozygous in all called individuals, and have different alleles in the two species; these variants were all confirmed with DNA sequences of one independent P. maniculatus and one P. polionotus animal. To identify variants that affect protein sequences we used SnpEff to select variants with MODERATE or HIGH putative impact. To evaluate the potential impact of fixed variants on protein function, we used the standalone version of the PROVEAN algorithm (version 1.1.5)17 and the NCBI nr database (downloaded April 2015).
Elevated plus maze assay
We designed an elevated plus maze that included four arms (31 cm L × 5 cm W), two closed arms with walls 15 cm high, and the maze floor raised 55 cm above the ground. We first used 50–60 day old P. maniculatus and P. polionotus mice that were housed with same-sex animals. Testing was carried out between zeitgeber time (ZT) 8 and ZT 15 with the lights on. We transferred animals in their home cage into the behaviour testing room, where they acclimated for 30 minutes before testing. To start a trial, we placed an animal inside a 3 3/4″ × 1 7/8″ × 3″ red box, which we gently lowered into a closed arm of the maze. We left the animal inside the box for 2 minutes before releasing it in the center of the maze by opening the door and removing the box without handling the animal. This approach – as opposed to transferring an animal directly from its home cage to the maze – reduced the number of times Peromyscus mice jumped off the maze at the start of a trial. We video recorded the next 5 minutes and used custom code to track the position of the animal. The same assay was then used to measure anxiety-related behaviour in the 769 F2 hybrid mice.
Intracerebroventricular drug delivery
Two to five days before the birth of a litter of P. polionotus pairs, we implanted guide cannulas in the right lateral cerebral ventricle (coordinates from bregma: ML: 1 mm, DV: 1.8 mm, AP: +0.1) under isoflurane anesthesia and using topical incisional bupivacaine and subcutaneous buprenorphine as analgesics. We used C315GAS-5 26 gauge cannulas (Plastics One) cut 1.8 mm below pedestal and covered the cannula with C315DCS-5 dummy cannulas that fit the guide cannulas without projecting. Six pairs had to be separated after surgery because they chewed on the cannulas of their mate. In those cases, we used an acrylic divider with multiple slits to separate the animals in their home cage but allowing for nose protrusion to the other side of the cage.
A day after a litter was born, we administered 2 μL Ringer’s solution (NaCl 7.2 g/L, CaCl2 0.17 g/L, KCl 0.37 g/L, pH 7.35) via a C315IAS-5 33 gauge internal cannula protruding 0.5 mm below guide cannula, at a rate of 0.75 μL/min using a MyNeurolab syringe pump under light (1.5% isoflurane) anaesthesia. Immediately after intracerebroventricular (i.c.v.) delivery, we performed a standard parental behaviour assay as described above, except the acclimation period before a pup was introduced was reduced to 15 min. We selected this interval between drug delivery and behavioural test to match the pharmacokinetics — the half life of vasopressin in cerebrospinal fluid is 24 min58 and the physiological effects of i.c.v. vasopressin start within 10 minutes of administration for the dose we used and recover by 1 h (ref59). A day later, animals received an i.c.v. injection of 100 ng vasopressin (Tocris) in Ringer’s. Next day, animals received an i.c.v. injection of 100 ng oxytocin (Tocris) in Ringer’s. All compounds were injected in a 2 μL volume as described above for the vehicle control (Ringer’s) and doses were within the range of those used previously in rodents59–63. We checked the correct placement of the cannulas by delivering Chicago Sky blue solution after the last test and visually confirming the presence of dye in the brain ventricles.
Generation of transgenic mice
To generate recombinant BAC constructs, we used the RP23-152M19 and RP24-63F7 BAC clones, in which the Avp coding sequences are flanked by ~90 kb and ~60 kb genomic sequences on each side. An IRES-Cre cassette was inserted immediately after the stop codon of the Avp sequence in the BAC clones by homologous recombination. We mixed equal amounts of modified BAC constructs derived from RP23-152M19 and RP24-63F7 and then microinjected the mix into pronuclei of B6/CBA F1 oocytes to generate transgenic founders. We backcrossed founders to C57BL6/J mice for 5 generations before testing. The transgene is inserted in the X chromosome; we used homozygous females and hemizygous males for all experiments. We verified Cre expression in vasopressin cells by immunofluorescence staining in two animals of each sex (Cre antibody: EMD Millipore MAB3120, vasopressin antibody: Immunostar 20069), as shown in Extended Data Fig. 10a. In males, 94.4% of 213 vasopressin+ cells were Cre+ in the PVN and 97.7% of 221 cells in the SON; 99.5% of 202 Cre+ cells were vasopressin+ in the PVN and 97.7% of 221 cells in the SON. In females, 96.9% of 213 vasopressin+ cells were Cre+ in the PVN and 97.7% of 221 cells in the SON; 99.5% of 202 Cre+ cells were vasopressin+ in the PVN and 97.7% of 221 cells in the SON.
Chemogenetics
We obtained recombinant adeno-associated viruses from the Penn Vector Core (University of Pennsylvania). We injected 200 nL of either rAAV-hSyn-DIO-hM4D(Gi)-mCherry (Gi-DREADD) or rAAV-hSyn-DIO-hM3D(Gq) (Gq-DREADD) stereotactically into the paraventricular nucleus of the hypothalamus (PVN) of 2 to 4-month-old Avp-Cre transgenic mice, bilaterally (from Bregma, −0.9 mm anteroposterior, 4.75 mm dorsoventral, ±0.25 mm). Three to 4 weeks later, we injected mice intraperitoneally (I.P.) with 0.9% NaCl (10 μL/g of body weight) and placed them in a clean mouse cage with corncob bedding, 2.5 g of cotton nestlet and ~3 mL hydrogel. We covered the cage with a clear plexiglass lid and recorded the animal for 1 hour. Two to 4 days later, we tested mice again, this time after a Clozapine-N-oxide (Sigma) I.P. injection (10 mg/kg in 0.9% NaCl, 10 uL/g of body weight). Two to 4 days later, we tested mice after a 0.9% NaCl I.P. injection, as in the first day. An experimenter blind to the sex of the animal, type of rAAV used, and the I.P. injection received, scored the time spent shredding, rearranging and retrieving nesting material on randomized videos. We verified the delivery of the virus by histology and present data for mice with DREADD-mCherry expression bilaterally in PVN and not in SON, SCN, BNST or medial amygdala.
Data Availability Statement
RNAseq data have been deposited in the NCBI Sequence Read Archive (BioProject PRJNA376410). Other data sets reported in this study are provided as Source Data and Supplementary Data Files.
Extended Data
Extended Data Figure 1. Parental behaviours in undisturbed home cages for three days following the birth of a litter.
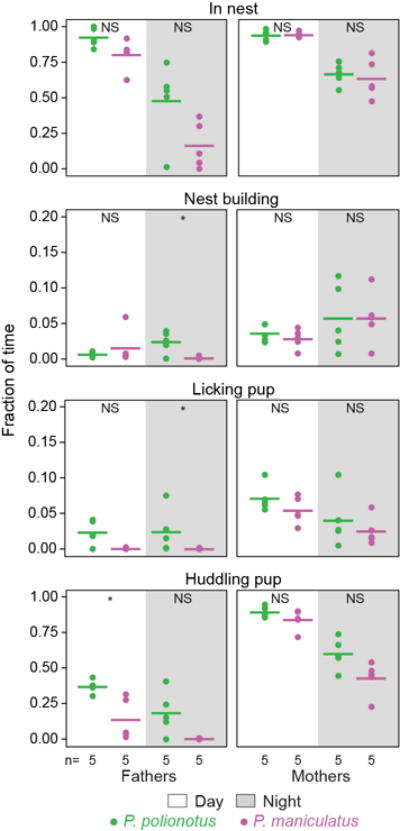
The fraction of time an animal was engaged in each behaviour averaged across 5-min samples for each hour, for 16 h of light and 8 h of dark parts of the day separately. Horizontal lines denote the mean. *, P<0.05; NS, not significant by Mann-Whitney U test.
Extended Data Figure 2. Parental behaviours towards own pups and heterospecific pups.
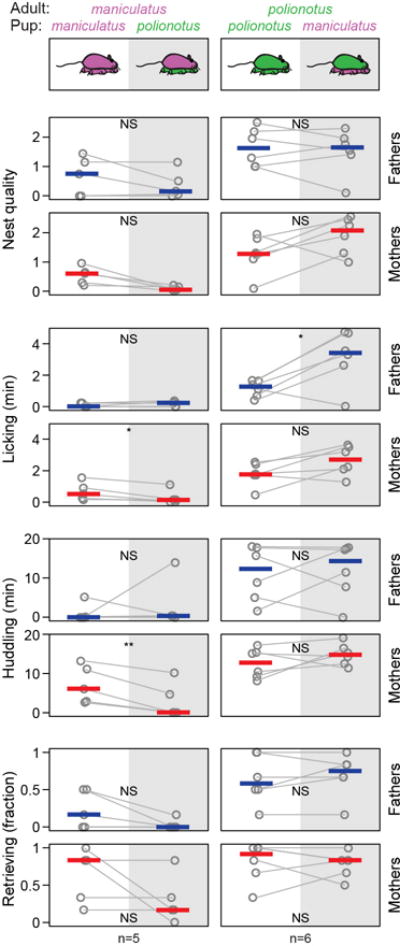
The behaviour of parents was measured across four consecutive days, alternating the pup species each day (randomizing the pup that was given on day 1). Grey lines connect an individual’s behaviour. Blue and red lines denote the median for fathers and mothers, respectively. *, P<0.05; **, P<0.01; NS, not significant by paired t-test or Wilcoxon signed-rank test (nest quality).
Extended Data Figure 3. QTL mapping of parental behaviours.
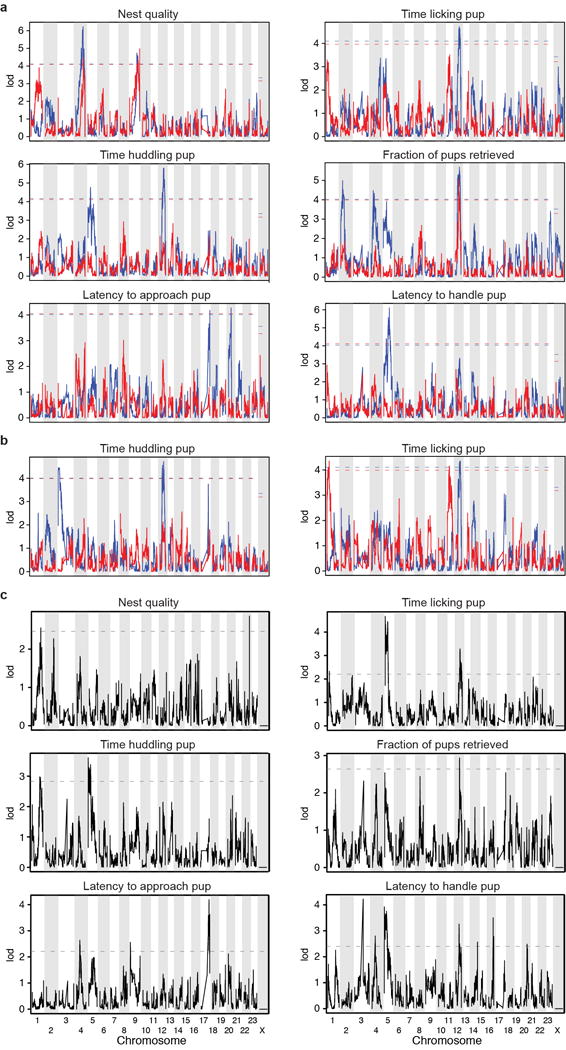
Non-parametric interval mapping of a) six parental behaviours in males (n=419) and females (n=350), b) the subset of F2 animals that performed a behaviour (i.e. excluding the animals that did not huddle or lick their pups for the duration of all three trials). Sample sizes for huddling: males = 259, females = 300; licking: males = 319, females = 313. c) Haley-Knott regression on nqrank normalized values of all F2 individuals, using sex as a covariate. Plots show the difference in lod scores for the scan with sex as an interactive and as an additive covariate minus the scan with sex as an additive covariate alone. The artificial narrow peaks at the ends of chromosomes result from lack of genotype imputation by Multiplex Shotgun Genotyping at chromosome ends (Nest quality, chromosome 22; Latency to approach, chromosome 9; Latency to handle, chromosome 14). a–c) Dashed lines denote the P=0.05 genome-wide significance level determined by 1,000 permutations.
Extended Data Figure 4. QTL effect plots.
Phenotype means (±SEM) against genotypes at peak QTL markers reported in Figure 4 and Extended Data Figure 3. Above each graph is the chromosomal position of the QTL peak. *, significant QTL-by-sex interaction. The percent variance explained is given for each QTL and is underlined if the QTL was significant in a QTL analysis of that sex (Extended Data Figure 3a,b).
Extended Data Figure 5. Behaviour of sexually naïve and parental animals.
a) Sexually naïve animals were tested with 4–6 day old conspecific pups, and parents with their own 4–6 day old pups. Box plots indicate median, interquartile range, and 10th to 90th percentiles. P. maniculatus (man, magenta) and P. polionotus (pol, green). *, P<0.05; **, P<0.01; ***, P<0.001; ****, P<0.001; NS, not significant by Mann-Whitney U or Fisher’s exact tests (retrieving and infanticide). b) Nest quality (mean ±SEM, and each pair in magenta circles for P. maniculatus and green squares for P. polionotus) in the two weeks following the birth of a litter. Existing nests were removed from the parents cage at the time of weaning and 5 g of new cotton nesting material (Nestlet) was provided. Litters were born 1–4 days after weaning the previous litter, and nest quality was evaluated once a day in the home cage, where both mother and father were present. ****, P<0.0001 effect of species in a two-way ANOVA including species and time as factors. There was no significant effect of time or species-by-time interaction.
Extended Data Figure 6. RNAseq analysis of P. maniculatus and P. polionotus hypothalamus.
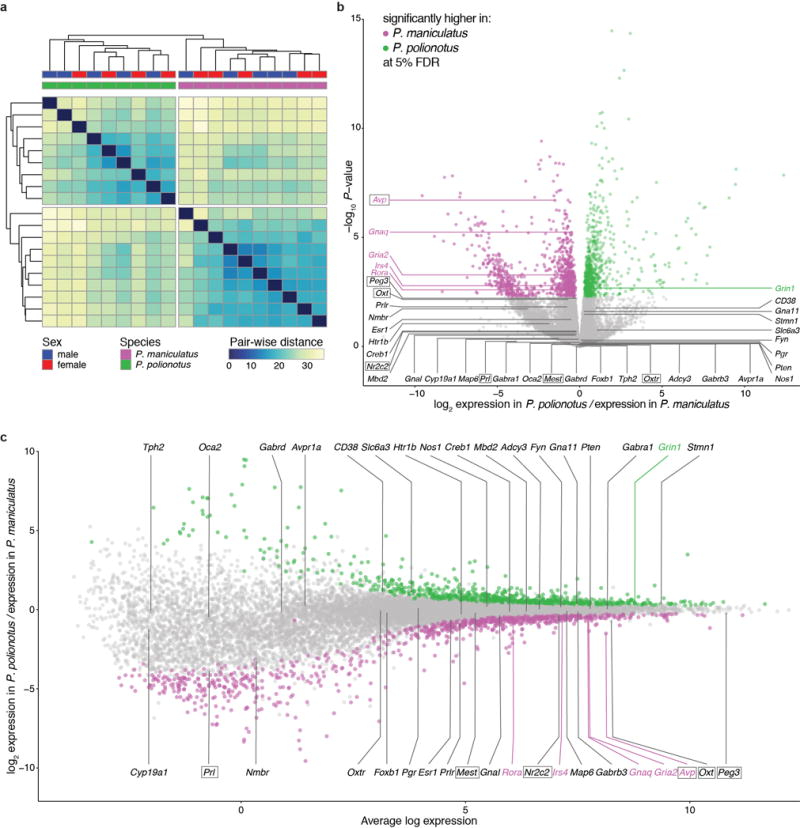
a) Clustering dendogram of RNAseq samples by Euclidian distances of transcript expression levels. Samples cluster by species but not by sex. b) Strength of differential expression between species. Each circle represents a gene and is colour-coded in magenta or green if its differential expression was significant at a 5% FDR. c) Relationship between average gene expression level and differential expression between species. In both b and c, genes that have been associated with parental care in previous studies (by physiological/pharmacological studies or induced mutations)64–66 are labelled; the gene is also boxed if located inside parental behaviour QTLs identified in this study.
Extended Data Figure 7. Expression analysis of genes in the chromosome 4 nest-building QTL.

a) Twenty-three genes that are differentially expressed in the hypothalamus at 5% FDR between P. maniculatus and P. polionotus, sorted by FDR-adjusted P-value. No significant differences between sexes for any gene. For each gene, its average expression level in each species and sex is shown on the left, the fold-difference in expression between the species in the middle, and the FDR-adjusted P-value on the right. b) Allele-specific expression of the 15 genes from a for which interspecific genetic variation allows this analysis. Mean fraction of reads (±SEM) matching the P. maniculatus allele from RNAseq of the hypothalamus of 12 male and 12 female P. maniculatus × P. polionotus F1 hybrids. There are no significant differences between males and females so the sexes were combined. *, P<0.05; **, P<0.01; ***, P<0.001; ****, P<0.0001 by a linear model that measures allelic bias: y = log(maniculatus allele counts genex)-log(polionotus allele counts genex) ~ sex).
Extended Data Figure 8. Allele-specific expression of Avp in different brain regions.
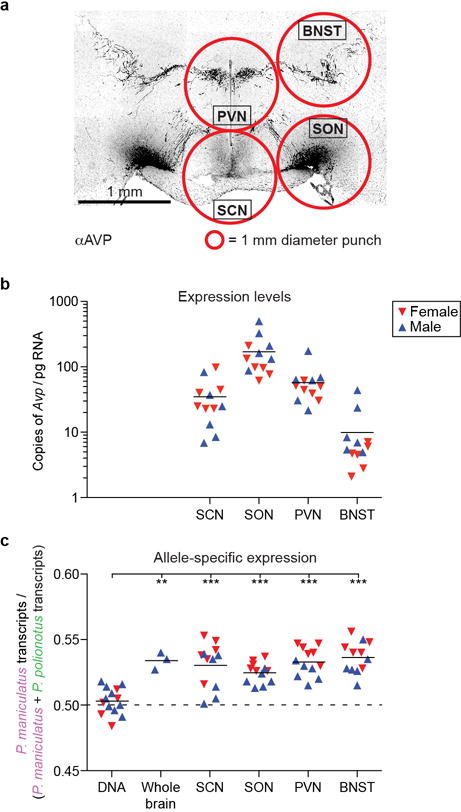
a) Immnunofluorescence staining of vasopressin in a coronal section of a P. maniculatus male brain, showing the main vasopressin producing nuclei. Red circles illustrate the 1 mm diameter (1.5 mm thick) circular punches used to microdissect these nuclei. b,c) Number of Avp transcripts (b) and allele-specific expression of Avp (c) in each of the microdissected regions in P. maniculatus × P. polionotus F1 hybrid animals, measured by droplet-digital PCR; horizontal line at the mean. **, P<0.01; ***, P<0.001; by ANOVA with Bonferroni correction. SCN: suprachiasmatic nucleus; SON: supraoptic nucleus; PVN: paraventricular nucleus of the hypothalamus; BNST: bed nucleus of the stria terminalis.
Extended Data Figure 9. Relationship between anxiety and nest building.
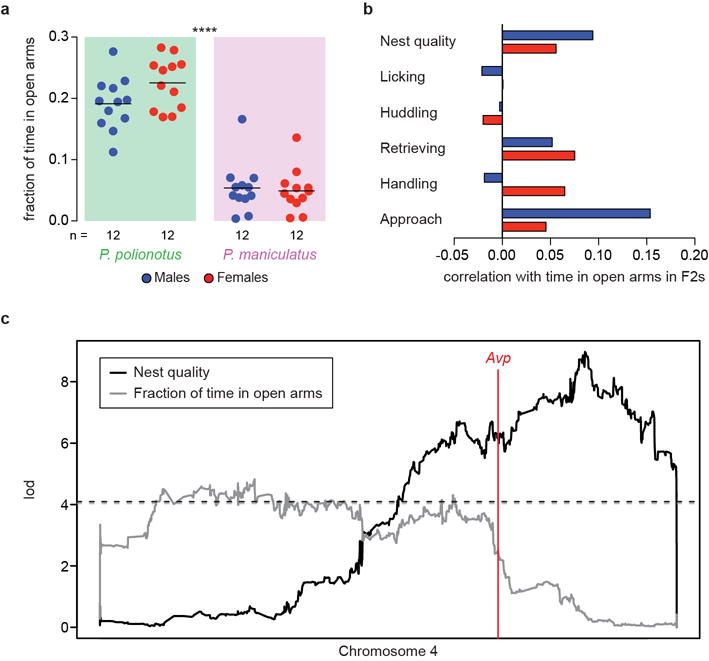
a) Fraction of time in the open arms of an elevated plus maze. Line at the mean. ****, P<0.0001 for difference between species by two-way ANOVA with sex and species as factors. No significant effect of sex or sex-by-species interaction. b) Spearman correlation coefficients among F2s between fraction of time in the open arms and parental behaviours. Handling and approach are promptness to perform those behaviours. c) Linkage (lod score) to chromosome 4 of nest building behaviour and fraction of time in open arms. Males and females combined since there are no major differences in the lod scores between sexes. Red line denotes the location of Avp. Dashed lines denote the P=0.05 genome-wide significance level determined by 1,000 permutations of each trait (n=769).
Extended Data Figure 10. Chemogenetic experiments on vasopressin neurons of Mus musculus.
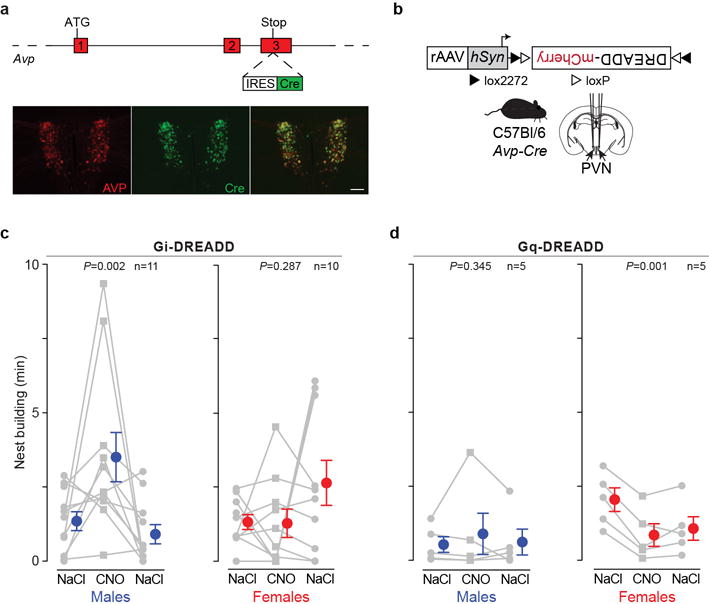
a) Generation of Avp-Cre BAC-transgenic Mus musculus. Top: Schematic illustrating the targeting of the IRES-Cre cassette immediately after the Avp stop codon. Bottom: Immunofluorescence histology of vasopressin (AVP) and Cre in the paraventricular nuclei of the hypothalamus of an Avp-Cre BAC-transgenic Mus musculus. Scale bar, 100 μm. b) A recombinant adeno-associated virus (rAAV) containing a Cre-dependent DREADD was injected into the paraventricular nuclei (PVN) of Avp-Cre transgenic Mus musculus. c,d) Nest-building behaviour for one hour following intraperitoneal injection with 0.9% NaCl or with the DREADD agonist clozapine-N-oxide (CNO) at 10 mg/kg. In c animals expressed the inhibitory Gi-DREADD and in d, the excitatory Gq-DREADD. Males (with blue symbols at the mean ±SEM) are on the left and females (red) are on the right in each panel. Statistical significance determined by repeated-measures ANOVA for quadratic trend.
Supplementary Material
Acknowledgments
E. Kingsley shared unpublished data. D. Stern, P. Andolfatto and A. Kitzmiller helped implement Multiplexed Shotgun Genotyping; V. Bajic with anchoring genomic scaffolds; M. Khadraoui with allele-specific expression analysis; K. Turner with ddRAD library construction. Computations were run on the Odyssey cluster supported by the Harvard FAS Research Computing Group. R. Hellmiss provided advice on figures. C. Bargmann and P. McGrath provided comments on the manuscript. This work was supported by a Helen Hay Whitney Foundation Postdoctoral Fellowship and NIH K99 award HD084732 to A.B., a Harvard Museum of Comparative Zoology Grants in Aid and Harvard Undergraduate Research and Fellowships to Y.M.K, a European Molecular Biology Organization (ALTF 379-2011), Human Frontier Science Program and the Belgian American Educational Foundation fellowships to J.M.L, NIH training grant GM008313 (M.X.H.), National Philanthropic Trust grant (RFP-12-03) to A.B. and H.E.H, a Harvard Mind Brain Behavior Award and Harvard Brain Science Initiative Grant to H.E.H. C.D. and H.E.H. are investigators of the Howard Hughes Medical Institute.
Footnotes
Supplementary Information is linked to the online version of the paper at www.nature.com/nature.
Author contributions
A.B. and H.E.H. conceived and designed the study. A.B. and Y.M.K. collected and analysed behavioural data. A.B., Y-M.K. and C.L.L. generated ddRAD-Seq libraries. B.K.P. created the pipeline for reference-guided mapping of ddRAD-Seq data. B.K.P. and A.B. wrote code to track animal behaviour from videos. A.B. and M.X.H. made a chromosome-level map of the Peromyscus genome. A.B. performed genetic mapping, pharmacology and chemogenetics experiments. A.B. and J-M.L. collected and analysed the RNAseq data. C.L.L. blind scored behavioural assays. S.Y. made the Avp-Cre transgenic mice. A.B., Y-M.K., J-M.L., C.D. and H.E.H analysed and interpreted results. A.B. and H.E.H. wrote the paper with input from all authors.
Competing financial interests
The authors declare no competing financial interests.
References
- 1.Lukas D, Clutton-Brock TH. The evolution of social monogamy in mammals. Science. 2013;341:526–30. doi: 10.1126/science.1238677. [DOI] [PubMed] [Google Scholar]
- 2.Lim MM, et al. Enhanced partner preference in a promiscuous species by manipulating the expression of a single gene. Nature. 2004;429:754–7. doi: 10.1038/nature02539. [DOI] [PubMed] [Google Scholar]
- 3.Okhovat M, Berrio A, Wallace G, Ophir AG, Phelps SM. Sexual fidelity trade-offs promote regulatory variation in the prairie vole brain. Science. 2015;350:1371–4. doi: 10.1126/science.aac5791. [DOI] [PubMed] [Google Scholar]
- 4.Wang Z, Ferris CF, De Vries GJ. Role of septal vasopressin innervation in paternal behavior in prairie voles (Microtus ochrogaster) Proc Natl Acad Sci USA. 1994;91:400–4. doi: 10.1073/pnas.91.1.400. [DOI] [PMC free article] [PubMed] [Google Scholar]
- 5.Bosch OJ, Neumann ID. Both oxytocin and vasopressin are mediators of maternal care and aggression in rodents: From central release to sites of action. Horm Behav. 2012;61:293–303. doi: 10.1016/j.yhbeh.2011.11.002. [DOI] [PubMed] [Google Scholar]
- 6.Dulac C, O’Connell LA, Wu Z. Neural control of maternal and paternal behaviors. Science. 2014;345:765–70. doi: 10.1126/science.1253291. [DOI] [PMC free article] [PubMed] [Google Scholar]
- 7.Scott N, Prigge M, Yizhar O, Kimchi T. A sexually dimorphic hypothalamic circuit controls maternal care and oxytocin secretion. Nature. 2015;525:519–22. doi: 10.1038/nature15378. [DOI] [PubMed] [Google Scholar]
- 8.Turner LM, et al. Monogamy evolves through multiple mechanisms: evidence from V1aR in deer mice. Mol Biol Evol. 2010;27:1269–78. doi: 10.1093/molbev/msq013. [DOI] [PubMed] [Google Scholar]
- 9.Birdsall DA, Nash D. Occurrence of successful multiple insemination of females in natural populations of deer mice (Peromyscus maniculatus) Evolution (NY) 1973;27:106–10. doi: 10.1111/j.1558-5646.1973.tb05922.x. [DOI] [PubMed] [Google Scholar]
- 10.Dewsbury DA. Aggression, copulation, and differential reproduction of deer mice (Peromyscus maniculatus) in a semi-natural enclosure. Behaviour. 1984;91:1–23. [Google Scholar]
- 11.Dewsbury DA, Lovecky DV. Copulatory behavior of old-field mice (Peromyscus polionotus) from different natural populations. Behav Genet. 1974;4:347–55. doi: 10.1007/BF01066155. [DOI] [PubMed] [Google Scholar]
- 12.Foltz DW. Genetic evidence for long-term monogamy in a small rodent, Peromyscus polionotus. Am Nat. 1981;117:665–75. [Google Scholar]
- 13.Dewsbury DA. An exercise in the prediction of monogamy in the field from laboratory data on 42 species of muroid rodents. Biologist. 1981;63:138–62. [Google Scholar]
- 14.Peterson BK, Weber JN, Kay EH, Fisher HS, Hoekstra HE. Double digest RADseq: an inexpensive method for de novo SNP discovery and genotyping in model and non-model species. PLoS One. 2012;7:e37135. doi: 10.1371/journal.pone.0037135. [DOI] [PMC free article] [PubMed] [Google Scholar]
- 15.Andolfatto P, et al. Multiplexed shotgun genotyping for rapid and efficient genetic mapping. Genome Res. 2011;21:610–7. doi: 10.1101/gr.115402.110. [DOI] [PMC free article] [PubMed] [Google Scholar]
- 16.Royle NJ, Smiseth PT, Kölliker M. The Evolution of Parental Care. OUP; Oxford: 2012. [Google Scholar]
- 17.Choi Y, Sims GE, Murphy S, Miller JR, Chan AP. Predicting the functional effect of amino acid substitutions and indels. PLoS One. 2012;7:e46688. doi: 10.1371/journal.pone.0046688. [DOI] [PMC free article] [PubMed] [Google Scholar]
- 18.Lagoutte E, et al. Oxidation of hydrogen sulfide remains a priority in mammalian cells and causes reverse electron transfer in colonocytes. Biochim Biophys Acta - Bioenerg. 2010;1797:1500–11. doi: 10.1016/j.bbabio.2010.04.004. [DOI] [PubMed] [Google Scholar]
- 19.Seth RB, Sun L, Ea CK, Chen ZJ. Identification and characterization of MAVS, a mitochondrial antiviral signaling protein that activates NF-kappaB and IRF 3. Cell. 2005;122:669–82. doi: 10.1016/j.cell.2005.08.012. [DOI] [PubMed] [Google Scholar]
- 20.Renella R, et al. Codanin-1 mutations in congenital dyserythropoietic anemia type 1 affect HP1 localization in erythroblasts. Blood. 2011;117:6928–38. doi: 10.1182/blood-2010-09-308478. [DOI] [PubMed] [Google Scholar]
- 21.Lindfors PH, Lindahl M, Rossi J, Saarma M, Airaksinen MS. Ablation of persephin receptor glial cell line-derived neurotrophic factor family receptor α4 impairs thyroid calcitonin production in young mice. Endocrinology. 2006;147:2237–44. doi: 10.1210/en.2005-1620. [DOI] [PubMed] [Google Scholar]
- 22.Numan M. Medial preoptic area and maternal behavior in the female rat. J Comp Physiol Psychol. 1974;87:746–59. doi: 10.1037/h0036974. [DOI] [PubMed] [Google Scholar]
- 23.Insel TR, Harbaugh CR. Lesions of the hypothalamic paraventricular nucleus disrupt the initiation of maternal behavior. Physiol Behav. 1989;45:1033–41. doi: 10.1016/0031-9384(89)90234-5. [DOI] [PubMed] [Google Scholar]
- 24.Insel TR. The challenge of translation in social neuroscience: a review of oxytocin, vasopressin, and affiliative behavior. Neuron. 2010;65:768–79. doi: 10.1016/j.neuron.2010.03.005. [DOI] [PMC free article] [PubMed] [Google Scholar]
- 25.Kramer KM, Yamamoto Y, Hoffman GE, Cushing BS. Estrogen receptor alpha and vasopressin in the paraventricular nucleus of the hypothalamus in Peromyscus. Brain Res. 2005;1032:154–61. doi: 10.1016/j.brainres.2004.10.070. [DOI] [PubMed] [Google Scholar]
- 26.Neumann ID, Landgraf R. Balance of brain oxytocin and vasopressin: implications for anxiety, depression, and social behaviors. Trends Neurosci. 2012;35:649–59. doi: 10.1016/j.tins.2012.08.004. [DOI] [PubMed] [Google Scholar]
- 27.Bult A, van der Zee EA, Compaan JC, Lynch CB. Differences in the number of arginine-vasopressin-immunoreactive neurons exist in the suprachiasmatic nuclei of house mice selected for differences in nest-building behavior. Brain Res. 1992;578:335–8. doi: 10.1016/0006-8993(92)90266-c. [DOI] [PubMed] [Google Scholar]
- 28.Bendesky A, Bargmann CI. Genetic contributions to behavioural diversity at the gene–environment interface. Nat Rev Genet. 2011;12:809–20. doi: 10.1038/nrg3065. [DOI] [PubMed] [Google Scholar]
- 29.De Vries GJ. Minireview: sex differences in adult and developing brains: compensation, compensation, compensation. Endocrinology. 2004;145:1063–68. doi: 10.1210/en.2003-1504. [DOI] [PubMed] [Google Scholar]
- 30.Tinbergen N. The hierarchical organization of nervous mechanisms underlying instinctive behaviour. Symp Soc Exp Biol. 1950;4:305–12. [Google Scholar]
- 31.Kennedy A, et al. Internal states and behavioral decision-making: toward an integration of emotion and cognition. Cold Spring Harb Symp Quant Biol. 2014;79:199–210. doi: 10.1101/sqb.2014.79.024984. [DOI] [PubMed] [Google Scholar]
- 32.Devidze N, Lee AW, Zhou J, Pfaff DW. CNS arousal mechanisms bearing on sex and other biologically regulated behaviors. Physiol Behav. 2006;88:283–93. doi: 10.1016/j.physbeh.2006.05.030. [DOI] [PubMed] [Google Scholar]
- 33.Wu Z, Autry AE, Bergan JF, Watabe-Uchida M, Dulac CG. Galanin neurons in the medial preoptic area govern parental behaviour. Nature. 2014;509:325–30. doi: 10.1038/nature13307. [DOI] [PMC free article] [PubMed] [Google Scholar]
- 34.Insel TR, Gelhard R, Shapiro LE. The comparative distribution of forebrain receptors for neurohypophyseal peptides in monogamous and polygamous mice. Neuroscience. 1991;43:623–30. doi: 10.1016/0306-4522(91)90321-e. [DOI] [PubMed] [Google Scholar]
- 35.Donaldson ZR, Young LJ. Oxytocin, vasopressin, and the neurogenetics of sociality. Science. 2008;322:900–4. doi: 10.1126/science.1158668. [DOI] [PubMed] [Google Scholar]
- 36.Dawson WD. Fertility and size inheritance in a Peromyscus species cross. Evolution (N Y) 1965;19:44–55. [Google Scholar]
- 37.Li H, Durbin R. Fast and accurate short read alignment with Burrows-Wheeler transform. Bioinformatics. 2009;25:1754–60. doi: 10.1093/bioinformatics/btp324. [DOI] [PMC free article] [PubMed] [Google Scholar]
- 38.Lunter G, Goodson M. Stampy: a statistical algorithm for sensitive and fast mapping of Illumina sequence reads. Genome Res. 2011;21:936–9. doi: 10.1101/gr.111120.110. [DOI] [PMC free article] [PubMed] [Google Scholar]
- 39.Van der Auwera GA, et al. From FastQ data to high confidence variant calls: the Genome Analysis Toolkit best practices pipeline. Curr Protoc Bioinforma. 2013;11:11.10.1–33. doi: 10.1002/0471250953.bi1110s43. [DOI] [PMC free article] [PubMed] [Google Scholar]
- 40.Painter TS. A comparative study of the chromosomes of mammals. Am Nat. 1925;59:385–409. [Google Scholar]
- 41.Greenbaum IF, et al. Cytogenetic nomenclature of deer mice, Peromyscus (Rodentia): revision and review of the standardized karyotype. Report of the Committee for the Standardization of Chromosomes of Peromyscus. Cytogenet Cell Genet. 1994;66:181–95. doi: 10.1159/000133696. [DOI] [PubMed] [Google Scholar]
- 42.Fraley C, Raftery A. mclust Version 4 for R: normal mixture modeling for model-based clustering, classification, and density estimation. Department of Statistics, University of Washington. 2012 [Google Scholar]
- 43.Broman KW. R/qtlcharts: interactive graphics for quantitative trait locus mapping. Genetics. 2015;199:359–61. doi: 10.1534/genetics.114.172742. [DOI] [PMC free article] [PubMed] [Google Scholar]
- 44.Kenney-Hunt J, et al. A genetic map of Peromyscus with chromosomal assignment of linkage groups (a Peromyscus genetic map) Mamm Genome. 2014;25:160–79. doi: 10.1007/s00335-014-9500-8. [DOI] [PMC free article] [PubMed] [Google Scholar]
- 45.Li H, et al. The Sequence Alignment/Map format and SAMtools. Bioinformatics. 2009;25:2078–9. doi: 10.1093/bioinformatics/btp352. [DOI] [PMC free article] [PubMed] [Google Scholar]
- 46.Cande J, Andolfatto P, Prud’homme B, Stern DL, Gompel N. Evolution of multiple additive loci caused divergence between Drosophila yakuba and D. santomea in wing rowing during male courtship. PLoS One. 2012;7:e43888. doi: 10.1371/journal.pone.0043888. [DOI] [PMC free article] [PubMed] [Google Scholar]
- 47.Lynch M, Walsh B. Genetics and Analysis of Quantitative Traits. Sinauer; 1998. [Google Scholar]
- 48.Broman KW, Wu H, Sen S, Churchill GA. R/qtl: QTL mapping in experimental crosses. Bioinformatics. 2003;19:889–90. doi: 10.1093/bioinformatics/btg112. [DOI] [PubMed] [Google Scholar]
- 49.Zapala MA, et al. Adult mouse brain gene expression patterns bear an embryologic imprint. Proc Natl Acad Sci U S A. 2005;102:10357–62. doi: 10.1073/pnas.0503357102. [DOI] [PMC free article] [PubMed] [Google Scholar]
- 50.Dobin A, et al. STAR: ultrafast universal RNA-seq aligner. Bioinformatics. 2013;29:15–21. doi: 10.1093/bioinformatics/bts635. [DOI] [PMC free article] [PubMed] [Google Scholar]
- 51.Rozowsky J, et al. AlleleSeq: analysis of allele-specific expression and binding in a network framework. Mol Syst Biol. 2011;7:522. doi: 10.1038/msb.2011.54. [DOI] [PMC free article] [PubMed] [Google Scholar]
- 52.Li B, Dewey CN. RSEM: accurate transcript quantification from RNA-Seq data with or without a reference genome. BMC Bioinformatics. 2011;12:323. doi: 10.1186/1471-2105-12-323. [DOI] [PMC free article] [PubMed] [Google Scholar]
- 53.Ritchie ME, et al. limma powers differential expression analyses for RNA-sequencing and microarray studies. Nucleic Acids Res. 2015;43:e47. doi: 10.1093/nar/gkv007. [DOI] [PMC free article] [PubMed] [Google Scholar]
- 54.Law CW, Chen Y, Shi W, Smyth G. K voom: Precision weights unlock linear model analysis tools for RNA-seq read counts. Genome Biol. 2014;15:R29. doi: 10.1186/gb-2014-15-2-r29. [DOI] [PMC free article] [PubMed] [Google Scholar]
- 55.Robinson MD, Oshlack A. A scaling normalization method for differential expression analysis of RNA-seq data. Genome Biol. 2010;11:R25. doi: 10.1186/gb-2010-11-3-r25. [DOI] [PMC free article] [PubMed] [Google Scholar]
- 56.Benjamini Y, Hochberg Y. Controlling the false discovery rate: a practical and powerful approach to multiple testing. J R Stat Soc Ser B. 1995;57:289–300. [Google Scholar]
- 57.Cingolani P, et al. A program for annotating and predicting the effects of single nucleotide polymorphisms, SnpEff. Fly (Austin) 2012;6:80–92. doi: 10.4161/fly.19695. [DOI] [PMC free article] [PubMed] [Google Scholar]
- 58.Clark RG, Jones PM, Robinson ICAF. Clearance of vasopressin from cerebrospinal fluid to blood in chronically cannulated Brattleboro rats. Neuroendocrinology. 1983;37:242–47. doi: 10.1159/000123552. [DOI] [PubMed] [Google Scholar]
- 59.Diamant M, De Wied D. Differential effects of centrally injected AVP on heart rate, core temperature, and behavior in rats. Am J Physiol - Regul Integr Comp Physiol. 1993;264:R51–61. doi: 10.1152/ajpregu.1993.264.1.R51. [DOI] [PubMed] [Google Scholar]
- 60.Pedersen CA, Ascher JA, Monroe YL, Prange AJ. Oxytocin induces maternal behavior in virgin female rats. Science. 1982;216:648–50. doi: 10.1126/science.7071605. [DOI] [PubMed] [Google Scholar]
- 61.Fahrbach SE, Morrell JI, Pfaff DW. Oxytocin induction of short-latency maternal behavior in nulliparous, estrogen-primed female rats. Horm Behav. 1984;18:267–86. doi: 10.1016/0018-506x(84)90016-3. [DOI] [PubMed] [Google Scholar]
- 62.Winslow JT, Hastings N, Carter CS, Harbaugh CR, Insel TR. A role for central vasopressin in pair bonding in monogamous prairie voles. Nature. 1993;365:545–8. doi: 10.1038/365545a0. [DOI] [PubMed] [Google Scholar]
- 63.Kessler MS, Bosch OJ, Bunck M, Landgraf R, Neumann ID. Maternal care differs in mice bred for high vs. low trait anxiety: Impact of brain vasopressin and cross-fostering. Soc Neurosci. 2011;6:156–68. doi: 10.1080/17470919.2010.495567. [DOI] [PubMed] [Google Scholar]
- 64.Bosch OJ, Neumann ID. Brain vasopressin is an important regulator of maternal behavior independent of dams’ trait anxiety. Proc Natl Acad Sci USA. 2008;105:17139–44. doi: 10.1073/pnas.0807412105. [DOI] [PMC free article] [PubMed] [Google Scholar]
- 65.Kuroda KO, Tachikawa K, Yoshida S, Tsuneoka Y, Numan M. Neuromolecular basis of parental behavior in laboratory mice and rats: with special emphasis on technical issues of using mouse genetics. Prog Neuropsychopharmacol Biol Psychiatry. 2011;35:1205–31. doi: 10.1016/j.pnpbp.2011.02.008. [DOI] [PubMed] [Google Scholar]
- 66.Xu X, et al. Modular genetic control of sexually dimorphic behaviors. Cell. 2012;148:596–607. doi: 10.1016/j.cell.2011.12.018. [DOI] [PMC free article] [PubMed] [Google Scholar]
Associated Data
This section collects any data citations, data availability statements, or supplementary materials included in this article.
Supplementary Materials
Data Availability Statement
RNAseq data have been deposited in the NCBI Sequence Read Archive (BioProject PRJNA376410). Other data sets reported in this study are provided as Source Data and Supplementary Data Files.