

Abstract
INTRODUCTION
The brain-derived neurotrophic factor (BDNF) interacts with important genetic Alzheimer’s disease (AD) risk factors. Specifically, variants within the SORL1 gene determine BDNF’s ability to reduce Aβ in vitro. We sought to test whether functional BDNF variation interacts with SORL1 genotypes to influence expression and downstream AD-related processes in humans.
METHODS
We analyzed postmortem brain RNA-sequencing and neuropathological data for 441 subjects from the Religious Orders Study/Memory and Aging Project, and molecular and structural neuroimaging data for 1 285 subjects from the Alzheimer’s Disease Neuroimaging Initiative.
RESULTS
We found one SORL1 RNA transcript strongly regulated by SORL1-BDNF interactions in elderly without pathological AD, and showing stronger associations with diffuse than neuritic Aβ plaques. The same SORL1-BDNF interactions also significantly influenced Aβ load as measured with [18F]Florbetapir PET.
DISCUSSION
Our results bridge the gap between risk and resilience factors for AD, demonstrating interdependent roles of established SORL1 and BDNF functional genotypes.
Keywords: Alzheimer’s disease, epistasis, RNA sequencing, amyloid, BDNF, SORL1, PET imaging
1. Background
Genetic epistasis may be a major contributor to the “missing heritability” of late-onset Alzheimer’s disease (AD) [1], and recent efforts have demonstrated the importance of evaluating gene-gene interactions among AD risk variants using integrative approaches [2]. Variants within the sortilin-related receptor (SORL1, SORLA, LR11) gene are among the most highly-replicated genetic risk factors for late-onset Alzheimer’s disease (AD); they have been associated with AD diagnosis in candidate studies [3], genome-wide association studies [4], and meta-analyses [5]. While studies have implicated SORL1 genotypes independently in gene expression [6], the transcriptional control of SORL1 also depends on extragenous factors, particularly levels of the brain-derived neurotrophic factor (BDNF) [7]. Accordingly, it was recently shown that BDNF administration in iPSC-derived neuron cultures up-regulates SORL1 expression in a SORL1-genotype dependent manner [8]. The BDNF Val66Met polymorphism determines the activity-dependent secretion of BDNF [9] and also the function of the BDNF pro-peptide in facilitating neuroplasticity (LTD) [10]. As such, BDNF Val66Met may serve as a functional assay for BDNF activity in the brain. Effects of BDNF Val66Met have been shown on early AD phenotypes, such as structural [11] and functional [12] neuroimaging, and cognition [13]. These effects may be downstream consequences of BDNF’s stimulation of SORL1 activity [14], and therefore may be subject to modulation by both BDNF and SORL1 genotypes interdependently. Studying the interaction of functional BDNF and SORL1 genotypes in large, well-characterized samples may provide insight into the nature of this transcriptional regulatory mechanism and risk vs. resilience for AD.
We have previously shown a main effect of SORL1 genotype on levels of prefrontal SORL1 mRNA in postmortem brain [15] using microarray technology that was unable to detect specific SORL1 transcript isoforms. Since previous reports show differential SORL1 transcript expression both in AD [16] and as a result of SORL1 genotype [6], microarray analyses may have missed crucial transcript-specific information. RNA-sequencing (RNA-seq) offers distinct advantages over probe-based methodologies as it allows for the alignment of assembled transcript reads to any sequence template and the estimation of isoform expression based on these reads. We have also previously shown age-dependent effects of the BDNF Val66Met polymorphism on white matter microstructure, cortical thickness, and episodic memory performance in healthy adults [17], suggesting that as-of-yet unidentified factors may act to influence BDNF’s protective effects on neurodegeneration and cognitive aging.
Given the regulatory interaction of BDNF protein with SORL1 genotype in human iPSC-derived neurons [8], we hypothesized that common SORL1 gene variants may interact with BDNF Val66Met to influence the expression of SORL1 transcripts. Further, given the functions of SORL1 within the amyloidogenic cascade, we hypothesized that genetic interactions predicting altered SORL1 expression may affect amyloid neuropathology as well as brain structures at risk in the early stages of AD. To test this, we performed an unbiased locus-wide gene-gene interaction analysis of SORL1 SNPs with BDNF Val66Met to model the expression of multiple SORL1 transcripts, quantified by RNA-seq of postmortem brain tissue, in 441 subjects from the Religious Orders Study and Memory and Aging Project (ROS/MAP). Transcripts showing significant evidence for regulation by SORL1-BDNF interactions were also tested for effects on postmortem neuropathology in the same subjects. We then tested significant SNP-SNP interactions for effects on in vivo frontal amyloid load, as measured by [18F]Florbetapir PET, in 710 subjects from the Alzheimer’s Disease Neuroimaging Initiative (ADNI). Finally, to explore potential downstream effects of these SNP-SNP interactions on brain structure, we examined 1 285 subjects from ADNI and 172 subjects from ROS/MAP with MRI estimates of entorhinal cortex volume, and 185 subjects from ADNI 2 with diffusion tensor imaging (DTI) data for tracts implicated in AD.
2. Methods
2.1 Religious Orders Study and Memory and Aging Project (ROS/MAP)
2.1.1 Study Participants
A total of 441 subjects with genomic, RNA sequencing, and neuropathological data were included in the present study. All participants were from ROS [18] and MAP [18]; two large ongoing cohort studies enrolling non-AD subjects at baseline, centered at the Rush Alzheimer’s Disease Center at Rush University in Chicago, IL. Both studies were approved by the Institutional Review Board of Rush University Medical Center.
2.1.2 Genetics
Genotyping of all subjects was performed using the Affymetrix (Santa Clara, CA, USA) Genechip 6.0 platform. APOE (rs7412 and rs429358) genotypes were imputed from MACH (version 1.0.16a) and HapMap release 22 CEU (build 36), as previously described [19]. Common variants within 10kb of the SORL1 locus (chr. 11, position 121,312,912 – 121,514,471; GRCh37 coordinates) were extracted using PLINK (v1.90b) [20]. Variants were pruned for minor allele frequency (MAF>0.1) and Hardy-Weinberg Equilibrium (HWE p>0.001), resulting in a final set of 160 for analysis.
2.1.3 Postmortem SORL1 Isoform Expression
RNA-seq data (50 million paired-end reads of 101 bp) were generated from frozen dorsolateral prefrontal cortex tissues following the construction of complementary DNA libraries, as previously published [21]. Expression abundance was calculated as fragments per kilobase of exon per million reads mapped (FPKM) (See Supplementary Methods).
2.1.4 Postmortem Neuropathology
A board-certified neuropathologist blinded to age and all clinical data established neuropathologic diagnoses for each subject. Five types of AD pathology were quantified for ROS/MAP subject samples: mid-frontal neuritic plaques and diffuse plaques, total amyloid, paired helical filament tau, and neurofibrillary tangles (see supplementary Methods).
2.1.5 In Vivo Structural MRI
High resolution structural T1 images were acquired for a subset of n=172 ROS/MAP subjects (overlap of n=5 with subjects from expression dataset) [22] and entorhinal cortex volumes (mm3) were estimated for each subject using Freesurfer (http://surfer.nmr.mgh.harvard.edu) (see Supplementary Methods).
2.2 Alzheimer’s Disease Neuroimaging Initiative (ADNI)
2.2.1 Study Participants
The Alzheimer’s Disease Neuroimaging Initiative (ADNI; phases 1, GO, and 2 – see Supplementary Methods) is a multi-center collaboration enrolling elderly subjects at various stages of cognitive impairment. All subjects are administered clinical evaluations at time of study enrollment by trained physicians as previously described [23]. See supplementary Methods for details.
2.2.2 Genetics
ADNI subjects were genotyped using the HumanOmniExpress BeadChip (Illumina Inc., San Diego, CA). Genetic quality control was conducted using PLINK (v1.90b). Imputation was performed using IMPUTE2 (v2.3.1) [24], with the 1000 Genomes Phase1 integrated haplotypes as the reference panel. SNPs with an IMPUTE2 info score of less than 0.5, HWE p<0.001, and MAF <0.01 were excluded from further analyses.
2.2.3 In Vivo Structural MRI and DTI
A total of 1 285 subjects from ADNI 1, GO, and 2 underwent structural MRI protocols to generate estimates of entorhinal cortex volume. Entorhinal cortex and total intracranial volumes were estimated using FreeSurfer (v4.3) [25]. Diffusion-weighted images were acquired for a subset of 185 subjects from ADNI 2 using an optimized protocol and rigorous quality control [26]. Estimates of fractional anisotropy (FA) were generated for specific white matter tracts according to the JHU “Eve” white matter atlas labels (see Supplementary Methods).
2.2.4 In Vivo Aβ [18F]Florbetapir PET
PET imaging data were available for 710 subjects from ADNI 2. Details of brain Aβ [18F]Florbetapir PET imaging and preprocessing in ADNI have been described elsewhere [27]. Signal from [18F]Florbetapir within cortical subregions were not standardized and so we co-varied for signal from a composite reference region (see Supplementary Methods).
2.3 Statistical Analysis
Analyses were performed using R (v3.1.1) statistical software (http://www.r-project.org/) [28]. Haploview (v4.2) [29] was used for calculations of LD structure. Based on lack of expression, data for three transcripts could not be analyzed: SORL1-003, SORL1-004, SORL1-007 (See Figure S1 for size and position of all transcripts). All 10 remaining transcripts showed heavily right-skewed FPKM distributions (skewness ranging from 0.71–5.3, all D’Agostino test p<1.3×10⁻⁵) that could not be coerced to normal (using Box-Cox power transformations) and thus were evaluated as binary outcomes (expressed above 0 FPKM vs. 0 FPKM, or median split where the median>0). Each of 160 SNPs within the SORL1 locus were tested for interaction with BDNF Val66Met, with each transcript as outcome using logistic regression, co-varying for technical and demographic factors.
To correct for multiple testing accounting for LD structure across SORL1 SNPs, we first calculated the effective number of independent SNPs across the SORL1 locus (as in Replogle et al. [30]); of the 160 SORL1 tested, six independent SNPs captured the haplotypic diversity at this locus (strong LD structure shown in Figure S2). Considering 10 SORL1 transcripts, the final experiment-wise Bonferroni corrected significance threshold was p<8.33×10⁻⁴ (α=0.05 / 6 independent SNPs / 10 transcripts).
Transcripts that showed significant evidence for interactive regulation by SORL1 variants and BDNF Val66Met were analyzed for effects on neuropathology. Pathology levels were square-root transformed and analyzed using linear regression, and, since SORL1-005 expression was evaluated as a continuous predictor, influential observations (evaluated using dfbetas and Cook’s distance) were removed from these analyses (final n=439).
SNP-SNP interactions from expression analyses that remained significant after correction for multiple testing were carried forward to test for effects on in vivo Aβ [18F]Florbetapir PET. To maintain regional specificity, average amyloid loads across seven bilateral frontal cortical regions of interest were analyzed as outcomes for each gene-gene interaction using linear regression. Interaction p-values were corrected for multiple testing using the False Discovery Rate (FDR) procedure (q=0.05).
Finally, to examine potential downstream consequences of altered amyloid pathology on brain structure, the same set of SNP-SNP interactions identified by expression analyses were explored for effects on entorhinal cortex volume (one of the earliest brain regions to be affected by AD pathological lesions and atrophy [31]), and white matter FA across five bilateral tracts.
See Supplementary Methods for details.
3. Results
3.1 SORL1 Transcript Expression and Postmortem Neuropathology
Sample demographics for ROS/MAP are summarized in Table 1. Out of a total 1 600 tests, 36 remained significant after correction for multiple testing and all of these 36 modeled the same transcript, SORL1-005 (ENST00000534286), as the outcome (Figure 1). The SNP showing the strongest interaction effect with BDNF Val66Met was rs12364988 (Wald X21=19.09, p=1.25×10⁻⁵, n=441), where the rs12364988T allele reduced likelihood of SORL1-005 expression in the BDNFVal homozygotes (ORTT:CC=0.38, C.I95%=[0.18,0.80]), but greatly increased likelihood of expression among BDNFMet carriers (ORTT:CC=7.03, C.I95%=[2.42,20.46]) (see Figure 2A). Rs12364988, within the 5′ region of SORL1, was in moderate to strong linkage disequilibrium (LD) with the remaining 35 SNPs that showed significant interaction with BDNF Val66Met in the ROS/MAP sample (D′ range=0.80–1, r2 range=0.35–1).
Table 1.
ROS/MAP Sample Demographics
| ROS/MAP expression (n=441) | Non-AD (n=179) | PathoAD (n=179) | Diff (p)1 | ||
|---|---|---|---|---|---|
| Sex (F/M) | 107 F, 72 M | 171 F, 91 M | 0.027 | ||
| Age at death (y(SD)) | 86.6 (7.2) | 89.8 (5.9) | <0.0001 | ||
| Education (y(SD)) | 16.3 (3.6) | 16.6 (3.4) | 0.47 | ||
| MMSE (SD) | 25.1 (6.8) | 19.1 (9.4) | <0.0001 | ||
| RIN (SD) | 7.2 (1.0) | 7.1 (0.9) | 0.21 | ||
| PMI (SD) | 6.8 (4.1) | 7.3 (5.4) | 0.25 | ||
| APOE ε4 status (−/+) | 153−, 26+ (15%+) | 168−, 94+ (36%+) | <0.0001 | ||
| BDNF genotype (valval/met carrier) | 116Val, 63M | 170Val, 92M | 1 | ||
| ROS/MAP MRI (n=172) | CN (n=112) | MCI (n=41) | AD (n=13) | Other2 (n=6) | Diff (p)1 |
| Sex (F/M) | 81 F, 31 M | 30 F, 11 M | 12 F, 1 M | 3 F, 3 M | 0.25 |
| Age at scan (y(SD)) | 83.3 (6.7) | 85.3 (5.1) | 85.8 (3.8) | 86 (2.8) | 0.072 |
| Education (y(SD)) | 15.6 (3.3) | 15.22 (3.1) | 15.9 (2.4) | 14.7 (2.4) | 0.82 |
| MMSE (SD) | 28.3 (1.5) | 26.9 (2.1) | 19.2 (6) | 22.7 (4.5) | <0.0001 |
| APOE ε4 status (−/+) | 95−/17+ (15%+) | 29−/12+ (29%+) | 8−/5+ (38%+) | 5−/1+ (17%+) | 0.084 |
| BDNF genotype (valval/met carrier) | 77/35 | 29/12 | 7/6 | 4/2 | 0.81 |
Note:
p-values are two-sided and derived from Fisher’s exact test (for sex, APOE ε4 status, and BDNF genotype) and either two-sample t-tests (in expression dataset for age at death, education, MMSE, RIN, and PMI) or ANOVA (in imaging dataset for age at scan, education, and MMSE). ROS/MAP = Religious Orders Study / Memory and Aging Project; CN = cognitively normal; non-AD = non-neuropathologically-confirmed Alzheimer’s disease; pathoAD = neuropathologically-confirmed Alzheimer’s disease; MMSE = Mini Mental Status Exam score at last visit before death; Val = Val/Val homozygotes; Met = Met allele carriers; F = female; M = male; y = years; SD = standard deviation; R = right; L = left.
Figure 1.
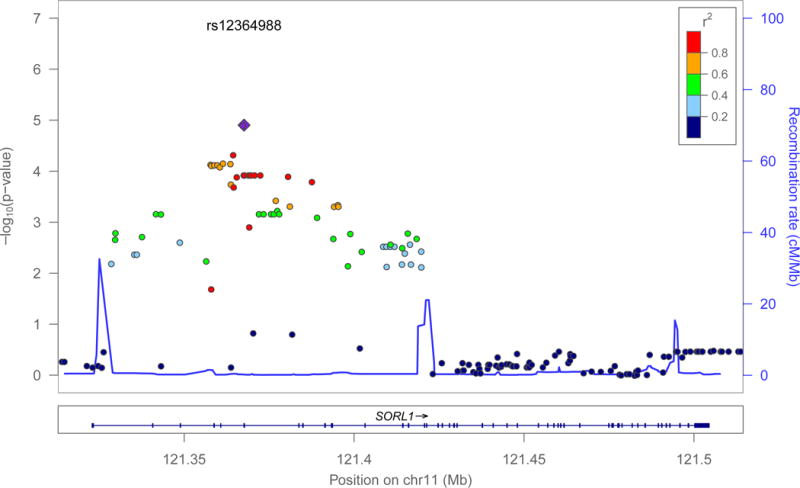
Log(p-values) for interaction terms of SNPs across the SORL1 locus with BDNF Val66Met in logistic regression models for expression of SORL1-005 (ENST00000534286). The top interacting SNP was rs12364988 (Wald X21=19.09, p=1.25×10⁻⁵, n=441). Colour coding shows LD structure in the region (according to 1000 Genomes hg19 EUR reference), with red indicating high LD (r2>0.8) and dark blue indicating low LD (r2<0.2) with respect to rs12364988. Plot was generated with LocusZoom [53].
Figure 2.
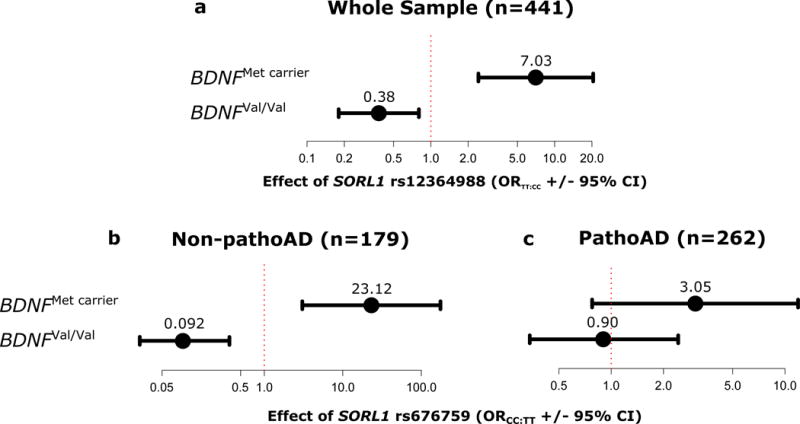
Top interaction effects of SORL1 variants (rs12364988 and rs676759) and BDNF Val66Met on prefrontal mRNA expression of SORL1-005 (ENST00000534286) in A) the whole ROS/MAP sample (Wald X21=19.09, p=1.25×10⁻⁵, n=441), B) only non-pathologically confirmed AD (non-pathoAD) subjects (Wald X21=19.27, p=1.14×10⁻⁵, n=179), and C) pathologically confirmed AD (pathoAD) subjects (Wald X21=1.99, p=0.16, n=262).
Post-hoc tests in diagnostic subgroups revealed different patterns of effect in non-AD vs. pathologically-confirmed AD subjects. In the non-AD subgroup (n=179), 44 tests showed interaction p-values below our threshold for multiple testing. As in the overall sample, all significant models predicted SORL1-005 expression as outcome, though with much stronger effect sizes observed for the top interacting SORL1 SNP (rs676759, Wald X21=19.27, p=1.14×10⁻⁵) in the BDNFVal homozygote (ORCC:TT=0.093, C.I.95%=[0.026,0.34]) and BDNFMet carrier groups (ORCC:TT=23.12, C.I.95%=[3.04,175.36]) (see Figure 2B). In the pathologically-confirmed AD subset (n=262), no test survived correction for multiple testing (for rs676759, interaction p=0.16, see Figure 2C), suggesting that the interaction effect is specific to individuals without confirmed AD.
Since all interactions showed regulatory effects on the same transcript, SORL1-005, we evaluated the effect of SORL1-005 expression on five measures of postmortem neuropathology in the ROS/MAP sample. Across diagnostic groups, there was a modest effect of SORL1-005 on diffuse plaques, whereby increased levels of SORL1-005 were associated only with increased number of plaques SORL1-005 (F1,428=4.91, p=0.027, n=439), though this result did not survive correction for multiple testing (see Supplementary Results). No effects were observed for any other pathology at praw<0.05.
3.2 In Vivo Neuroimaging
Sample demographics for ADNI subjects are summarized in Table 2. A total of 36 SNP-SNP interactions surviving correction for multiple testing in SORL1 expression analyses were analyzed across seven bilateral frontal cortical regions of interest for in vivo Aβ using [18F]Florbetapir PET, resulting in a total of 252 significant tests before correction. After FDR correction, 44 models remained significant. Between these 44 models, 18 different SORL1 SNPs demonstrated significant interaction with BDNF Val66Met to predict levels of frontal Aβ across five regions of interest (see Supplementary Results). The top SNP showing interaction was rs618874 (F1,649=12.12, praw=5.3×10⁻⁴, n=710); the rs618874T allele was associated with decreased amyloid burden in BDNFVal homozygotes, but increased amyloid in BDNFMet carriers (see Figure 3). This is in alignment with effects observed on gene expression and neuropathology in ROS/MAP, whereby the rs12364988T allele, which is strongly linked to rs618874T (ADNI r2=0.73; ROS/MAP r2=0.74), resulted in BDNFMet-dependent increases in SORL1-005.
Table 2.
ADNI Sample Demographics
| ADNI 1/GO/2 MRI (n=1 285) | CN (n=335) | SMC (n=82) | EMCI (n=235) | LMCI (n=407) | AD (n=226) | Diff (p)1 |
|---|---|---|---|---|---|---|
| Study phase (1, GO, 2) | 193 (1), 142 (2) | 82 (2) | 111 (GO), 124 (2) | 291 (1), 116 (2) | 131 (1), 95 (2) | <0.0001 |
| Sex (F/M) | 159 F, 176 M | 51 F, 31 M | 101 F, 134 M | 155 F, 252 M | 102 F, 124 M | 0.0012 |
| Age (y(SD)) | 74.7 (5.4) | 71.7 (5.4) | 71.0 (7.1) | 73.3 (7.4) | 74.3 (8.1) | <0.0001 |
| Education (y(SD)) | 16.2 (2.7) | 16.7 (2.6) | 16.1 (2.6) | 15.8 (2.9) | 15.2 (2.9) | <0.0001 |
| MMSE (SD) | 29 (1.1) | 29 (1.2) | 28.4 (1.6) | 27.1 (1.8) | 23.1 (2.1) | <0.0001 |
| APOE ε4 status (−/+) | 251−/84+ (25%+) | 53−/29+ (35%+) | 132−/103+ (44%+) | 175−/232+ (57%+) | 68−/158+ (70%+) | <0.0001 |
| BDNF genotype (valval/met carrier) | 231/104 | 54/28 | 159/76 | 271/136 | 154/72 | 0.96 |
| ADNI GO/2 Amyloid Sample (n=710) | CN (n=136) | SMC (n=88) | EMCI (n=244) | LMCI (n=121) | AD (n=121) | Diff (p)1 |
| Study phase (GO, 2) | 136 (2) | 88 (2) | 106 (GO), 138 (2) | 121 (2) | 121 (2) | <0.0001 |
| Sex (F/M) | 66 F, 70 M | 55 F, 33 M | 107 F, 137 M | 55 F, 66 M | 50 F, 71 M | 0.024 |
| Age (y(SD)) | 73.9 (5.9) | 72.2 (5.8) | 71.4 (7.4) | 72.5 (7.5) | 74.3 (8.5) | 0.001 |
| Education (y(SD)) | 16.5 (2.5) | 16.8 (2.6) | 16 (2.6) | 16.5 (2.6) | 15.8 (2.6) | 0.016 |
| MMSE (SD) | 29.1 (1.2) | 29 (1.3) | 28.3 (1.6) | 27.7 (1.8) | 23.1 (2.1) | <0.0001 |
| APOE ε4 status(−/+) | 104−/32+ (24%+) | 60−/28+ (32%+) | 130−/114+ (47%+) | 51−/70+ (58%+) | 43−/78+ (64%+) | <0.0001 |
| BDNF genotype (valval/met carrier) | 95/41 | 58/30 | 167/77 | 89/32 | 79/42 | 0.66 |
Note:
p-values are two-sided and derived from Fisher’s exact test (for study phase, sex, APOE ε4 status, and BDNF genotype) and ANOVA (for age, education, and MMSE). ADNI = Alzheimer’s Disease Neuroimaging Initiative; CN = cognitively normal; SMC = some memory concern; EMCI; early mild cognitive impairment; LMCI = late mild cognitive impairment; AD = Alzheimer’s disease; MMSE = Mini Mental Status Exam score; Val = Val/Val homozygotes; Met = Met allele carriers; F = female; M = male; y = years; SD = standard deviation.
Figure 3.
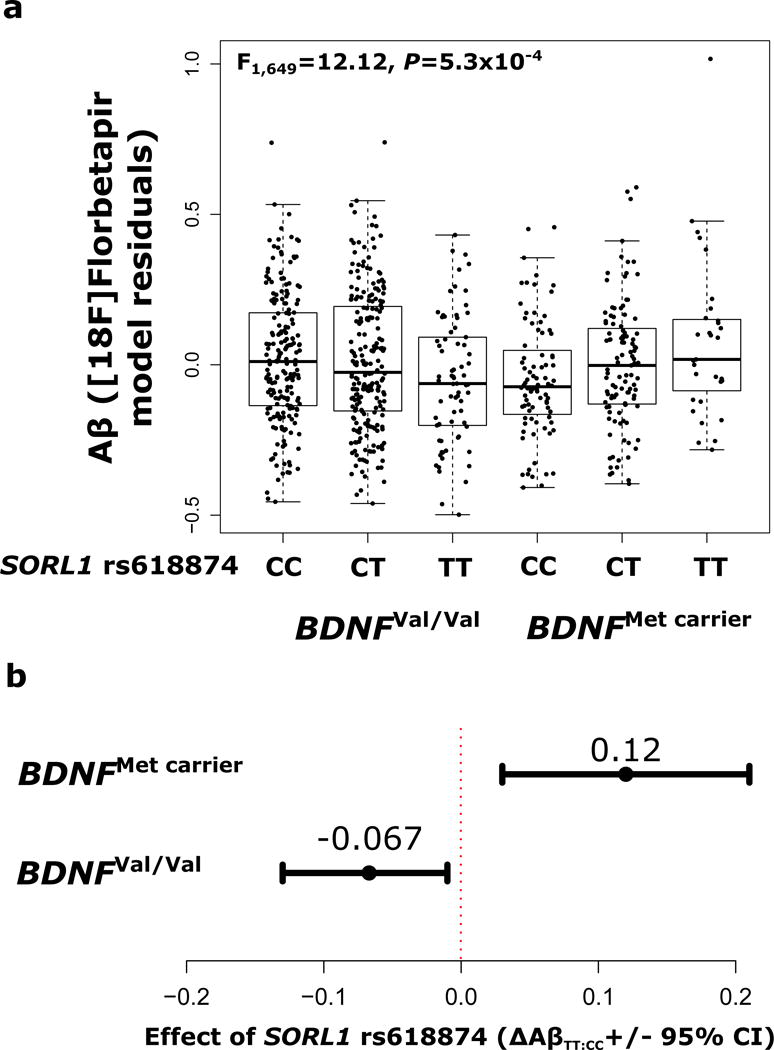
SORL1-BDNF interaction effect on in vivo Aβ in the pars orbitalis measured by [18F]Florbetapir PET in the ADNI 2 sample (n=710). A) Residual amyloid load according to SORL1 rs618874 and BDNF Val66Met groups. B) Effect of SORL1 rs618874 within BDNFVal homozygote and BDNFMet carrier groups separately, adjusted for co-variates, with 95% confidence intervals. Rs618874T was associated with decreased amyloid burden in BDNFVal homozygotes (ΔAβTT:CC=−0.067, C.I.95%= [−0.13,−0.01]), but increased amyloid in BDNFMet carriers (ΔAβTT:CC=0.12, C.I.95%= [0.03,0.21]). Results were not impacted by removal of observations lying beyond 1.5*interquartile range of mean binding.
Structural imaging analyses revealed similar patterns of SORL1-BDNF interaction at p<0.05; however, effects did not survive correction for multiple testing (see Supplementary Results; Figure S3).
4. Discussion
We found that linked SORL1 variants interacted with BDNF Val66Met to regulate prefrontal expression of one SORL1 transcript, SORL1-005 (ENST00000534286), and that this isoform was weakly associated with increased diffuse amyloid plaques in midfrontal tissue from the same subjects. We then demonstrated that the same genetic interactions regulating SORL1-005 expression determined frontal amyloid deposition in vivo using PET imaging. The gene variant that most significantly interacted with BDNF Val66Met to influence SORL1-005 expression, rs12364988, is part of the same highly-linked haplotype block recently shown to interact with BDNF in human iPSC-derived neurons to regulate SORL1 mRNA expression [8]. By combining layers of genetic, transcriptomic, and neuroimaging data, we have shown that BDNF Val66Met status may determine the background on which SORL1 risk variants exert their effects (results across phenotypes are summarized in Table S1). Through this lens, BDNF’s modulation of resilience via cognitive reserve [32] is also clarified; depending on SORL1 genotype, the effects of Val66Met may influence protection against AD by promoting diffuse plaque deposition preferentially over neuritic.
SORL1 is a member of the Vps10p-domain (Vps10p-D) family of neuronal receptors [33], several of which have been shown to interact directly with BDNF. Sortilin, another Vps10p receptor, is responsible for intracellular trafficking of newly synthesized proBDNF via its physical interaction with the region of BDNF pro-domain in which the Val66Met substitution resides [34]. BDNF Val66Met has been associated with risk for AD [35] and AD-related intermediate phenotypes [36], albeit inconsistently, and is thought to be an important factor in modulating neuroplasciticty [10]. Our results may provide insight into the inconsistent literature on the effects of BDNF Val66Met (i.e. why it has not been identified by GWAS for AD); the vast majority of studies in this area have not accounted for SORL1 genotype and thus may be missing crucial information determining the direction and magnitude of BDNF’s effects. The mechanisms via which BDNF Val66Met influences downstream risk for AD are complex and not yet understood; recently it was shown that BDNF Val66Met alters the expression of miR-146 in humanized BDNF knockin mice [37], suggesting that this variant may influence the expression of multiple target genes simultaneously.
SORL1-005 is a putative protein-coding transcript (UniProt ID: E9PP43) of 3 501bp, containing 25 exons (compared to 48 in the full length transcript), and lacking the Vps10p domain found in full length SORL1 protein. The lack of this domain could potentially interrupt the function of SORL1-005 protein within the amyloid cascade and contribute to the accumulation of pathogenic Aβ species [3], consistent with our observations of concomitant increases in diffuse plaques postmortem and amyloid burden in vivo. A second mechanism via which increased SORL1-005 may exert pathological effects on brain structure is regulated intramembrane proteolysis [38]; SORL1 has been shown to undergo sequential cleavage by alpha and gamma-secretase enzymes [39], liberating protein fragments that are internalized to the nucleus and play roles in gene regulation. It is possible that altered recognition of SORL1-005 by gamma-secretase results in the absence of SORL1 COOH-terminal fragments that may preserve pathologically-protective gene regulation; such absence is also seen in cells co-transfected with FAD-linked PS1 mutations [39]. In either case, given SORL1’s dual roles in recycling APP [3] and lysosomal targeting of Aβ [40], alternative splicing causing loss-of-function would be expected to influence amyloid levels in the direction observed in our study.
While functional annotations of SORL1 variants within our top interacting SORL1 haplotype block (which lie approximately 50kb 5′ exon 25 of the full length transcript; Figure S4) do not directly reveal an underlying mechanism related to alternative splicing (See Supplementary Materials), it has been shown that a functional SORL1 rare variant (rs117260922, E270K), which is located only one base pair from our top SNP, rs12364988, is responsible for a conformational change in SORL1 that results in failure to interact with APP at the cell surface [41]. In addition, another nearby variant in high LD with rs12364988 – rs923893 – is a cis-eQTL for SORL1 expression in human brain tissue [42].
Our observation that SORL1-BDNF interactions influenced SORL1-005 expression in non-pathological AD subjects may be due to the interruption or masking of transcriptional mechanisms by AD-related neuropathology: it has been shown that Aβ oligomers are capable of inducing gene expression changes across diverse functional classes in human brain tissue [43], and that genes involved in intracellular trafficking specifically show marked down-regulation in postmortem AD brain [44]. These findings may have implications for identifying gene regulatory mechanisms in AD brain, as the effects of transcriptional machinery may be altered depending on levels of cellular pathology.
The weak association of SORL1-005 with only diffuse plaques of midfrontal cortex may suggest a differential contribution of the SORL1-BDNF interaction to diffuse vs. neuritic plaque pathology. Diffuse plaques account for the majority of plaque pathology in human brain [45], are associated with AD diagnosis [46], but are also found frequently in so-called “normal” aging [47], suggesting that they may be indicative of the early, pre-symptomatic stages of disease or even just a non-pathological form of aging. It has been shown that Aβ plays crucial roles in neuroplasticity [48], and may be produced as part of a neuroprotective response to synaptic pathology in AD [49]; Aβ1–28 has been shown to promote growth and survival of hippocampal neurons [50]. As a result, it is possible that the regulatory action of SORL1 and BDNF may act on amyloid pathways in such a way that influences both neuritic plaque (neurotoxic) and diffuse plaque (neuroprotective) pathologies. Particularly, the interactive effects of variants identified by our study may influence the latter pathway to the greatest degree; hence why genetic effects are only observed in the non-AD group. Further, [18F]Florbetapir has been shown to measure both neuritic and diffuse plaque burden in the brain [51], meaning that our in vivo Aβ findings may be reflective of SORL1-005’s effect on diffuse plaques in postmortem frontal cortex. Taken together, we suggest that the interaction between BDNF and SORL1 may provide links between AD risk and the healthy aging process by influencing the expression of a transcript that is not related to AD risk, but nonetheless modulates diffuse amyloid deposition postmortem and in vivo.
The present study has several limitations. First, the decision to analyze gene expression as a binary outcome necessarily introduces a level of bias into the analyses; it is possible that by splitting the distributions of transcript expression into expressed vs. not expressed, we missed quantitative information that here we would have been unable to test without violating statistical assumptions. Second, the expression of SORL1 has been shown to be cell-type specific [52], whereby some individuals with AD have loss of expression in neurons, but not glia. We are unable to test this directly in our sample, as the ROS/MAP expression data are derived from tissue homogenate of the prefrontal cortex. We took steps to maintain regional specificity in our analyses by analyzing frontal pathology, which should help mitigate some concerns over differences between regions. Third, as with any RNA sequencing experiment, alignment error must be considered as a potential confounder. Fourth, BDNF’s effects on amyloid pathology [8] as well as TrkB-dependeng trophic signaling [14] have been shown to depend on SORL1, and in this study we used the functional Val66Met variant as an indirect proxy for brain BDNF activity [9]. However, due to inconsistency in the literature surrounding the influence of Val66Met on BDNF protein and mRNA expression in blood and brain tissue, we acknowledge the uncertainty in this assumption. Finally, we acknowledge that mRNA levels of SORL1 may not be reliable indicators of protein levels. Unfortunately, we did not measure protein directly in our experiments. Future studies will need to measure protein directly in the tissues. In fact, proteomic projects are currently underway in the ROS/MAP cohort that will include both SORL1 and BDNF. However, there are also limitations to targeted proteomics; for example, it cannot capture individual post-translational modifications. Thus, ultimately, a variety of approaches, including the mRNA approach used in the present study, are useful for identifying genes and proteins important in the pathogenesis of AD.
In conclusion, we have demonstrated a novel interaction between two AD-associated genes that determines the isoform-specific expression of SORL1, and impacts levels of amyloid deposition in two large samples. We believe that this interaction may provide insight into the convergence of prototypical neurotoxic Aβ deposition and the brain reserve found in aged individuals who are resilient to AD. This work has implications for the way that genetic association studies of SORL1 and BDNF are interpreted and may be of use in determining specific groups of genetically at-risk individuals in future clinical trials of novel therapies directed toward amyloidogenic and neuroplastic mechanisms.
Supplementary Material
Highlights.
BDNF Val66Met interacts with SORL1 variants to impact expression of SORL1-005.
SORL1-005 may influence diffuse rather than neuritic amyloid pathology in postmortem brain.
The BDNF-SORL1 interaction effect is present in individuals without confirmed Alzheimer’s disease.
In vivo amyloid, measured by PET imaging, is also impacted by the BDNF-SORL1 interaction.
Research in Context.
Systematic review
Authors reviewed relevant literature using traditional sources (e.g., Pubmed) and meeting abstracts and presentations. SORL1 is a major risk factor for Alzheimer’s disease and several studies have demonstrated its interactions with other genes and proteins within neuroplastic and canonical Alzheimer’s-related pathways.
Interpretation
We demonstrate that there is a genetic interaction between SORL1 and BDNF that influences SORL1 isoform expression and amyloid deposition both postmortem and in vivo. This result is convergent with previous reports of SORL1-dependent aspects of Alzheimer’s disease biology.
Future directions
We find that one SORL1 isoform, SORL1-005, is an interactively regulated transcript and should be a focus of future studies. In addition, the relative impact of SORL1- and BDNF-related mechanisms on diffuse and neuritic amyloid accumulation should be explored further.
Acknowledgments
Work from Rush was supported in part by grants P30AG10161, R01AG15819, R01AG17917, R01AG30146, R01NS084965, the Illinois Department of Public Health, and the Translational Genomics Research Institute. We would like to thank all of the study participants and acknowledge the essential contributions of Chaya Gopin and Kimberly Cameron to the recruitment and clinical assessments of those participants. We are indebted to the participants in the Religious Orders Study and the Rush Memory and Aging Project. We thank the staff of the Rush Alzheimer’s Disease Center.
AV is supported in part by the CAMH Foundation thanks to the Kimel Family, Koerner New Scientist Award, and Paul E. Garfinkel New Investigator Catalyst Award, as well as the Canadian Institutes of Health Research (CIHR), American Psychiatric Association,and the Ontario Mental Health Foundation. DF is supported by a CIHR Postdoctoral Fellowship.
Footnotes
Publisher's Disclaimer: This is a PDF file of an unedited manuscript that has been accepted for publication. As a service to our customers we are providing this early version of the manuscript. The manuscript will undergo copyediting, typesetting, and review of the resulting proof before it is published in its final citable form. Please note that during the production process errors may be discovered which could affect the content, and all legal disclaimers that apply to the journal pertain.
References
- 1.Ebbert MTW, Ridge PG, Kauwe JSK. Bridging the Gap between Statistical and Biological Epistasis in Alzheimer’s Disease. BioMed Res Int. 2015;2015:e870123. doi: 10.1155/2015/870123. [DOI] [PMC free article] [PubMed] [Google Scholar]
- 2.Hohman TJ, Bush WS, Jiang L, Brown-Gentry KD, Torstenson ES, Dudek SM, et al. Discovery of gene-gene interactions across multiple independent data sets of late onset Alzheimer disease from the Alzheimer Disease Genetics Consortium. Neurobiol Aging. 2016;38:141–50. doi: 10.1016/j.neurobiolaging.2015.10.031. [DOI] [PMC free article] [PubMed] [Google Scholar]
- 3.Rogaeva E, Meng Y, Lee JH, Gu Y, Kawarai T, Zou F, et al. The neuronal sortilin-related receptor SORL1 is genetically associated with Alzheimer disease. Nat Genet. 2007;39:168–77. doi: 10.1038/ng1943. [DOI] [PMC free article] [PubMed] [Google Scholar]
- 4.Lambert J-C, Ibrahim-Verbaas CA, Harold D, Naj AC, Sims R, Bellenguez C, et al. Meta-analysis of 74,046 individuals identifies 11 new susceptibility loci for Alzheimer’s disease. Nat Genet. 2013;45:1452–8. doi: 10.1038/ng.2802. [DOI] [PMC free article] [PubMed] [Google Scholar]
- 5.Reitz C, Cheng R, Rogaeva E, Lee JH, Tokuhiro S, Zou F, et al. Meta-analysis of the association between variants in SORL1 and Alzheimer disease. Arch Neurol. 2011;68:99–106. doi: 10.1001/archneurol.2010.346. [DOI] [PMC free article] [PubMed] [Google Scholar]
- 6.Caglayan S, Bauerfeind A, Schmidt V, Carlo A-S, Prabakaran T, Hübner N, et al. Identification of Alzheimer disease risk genotype that predicts efficiency of SORL1 expression in the brain. Arch Neurol. 2012;69:373–9. doi: 10.1001/archneurol.2011.788. [DOI] [PubMed] [Google Scholar]
- 7.Rohe M, Synowitz M, Glass R, Paul SM, Nykjaer A, Willnow TE. Brain-derived neurotrophic factor reduces amyloidogenic processing through control of SORLA gene expression. J Neurosci Off J Soc Neurosci. 2009;29:15472–8. doi: 10.1523/JNEUROSCI.3960-09.2009. [DOI] [PMC free article] [PubMed] [Google Scholar]
- 8.Young JE, Boulanger-Weill J, Williams DA, Woodruff G, Buen F, Revilla AC, et al. Elucidating Molecular Phenotypes Caused by the SORL1 Alzheimer’s Disease Genetic Risk Factor Using Human Induced Pluripotent Stem Cells. Cell Stem Cell. 2015 doi: 10.1016/j.stem.2015.02.004. [DOI] [PMC free article] [PubMed] [Google Scholar]
- 9.Egan MF, Kojima M, Callicott JH, Goldberg TE, Kolachana BS, Bertolino A, et al. The BDNF val66met polymorphism affects activity-dependent secretion of BDNF and human memory and hippocampal function. Cell. 2003;112:257–69. doi: 10.1016/s0092-8674(03)00035-7. [DOI] [PubMed] [Google Scholar]
- 10.Mizui T, Ishikawa Y, Kumanogoh H, Lume M, Matsumoto T, Hara T, et al. BDNF pro-peptide actions facilitate hippocampal LTD and are altered by the common BDNF polymorphism Val66Met. Proc Natl Acad Sci U S A. 2015;112:E3067–3074. doi: 10.1073/pnas.1422336112. [DOI] [PMC free article] [PubMed] [Google Scholar]
- 11.Wang C, Zhang Y, Liu B, Long H, Yu C, Jiang T. Dosage effects of BDNF Val66Met polymorphism on cortical surface area and functional connectivity. J Neurosci Off J Soc Neurosci. 2014;34:2645–51. doi: 10.1523/JNEUROSCI.3501-13.2014. [DOI] [PMC free article] [PubMed] [Google Scholar]
- 12.Lisiecka DM, O’Hanlon E, Fagan AJ, Carballedo A, Morris D, Suckling J, et al. BDNF Val66Met polymorphism in patterns of neural activation in individuals with MDD and healthy controls. J Affect Disord. 2015;184:239–44. doi: 10.1016/j.jad.2015.06.002. [DOI] [PubMed] [Google Scholar]
- 13.Dincheva I, Glatt CE, Lee FS. Impact of the BDNF Val66Met Polymorphism on Cognition: Implications for Behavioral Genetics. Neurosci Rev J Bringing Neurobiol Neurol Psychiatry. 2012;18:439–51. doi: 10.1177/1073858411431646. [DOI] [PMC free article] [PubMed] [Google Scholar]
- 14.Rohe M, Hartl D, Fjorback AN, Klose J, Willnow TE. SORLA-mediated trafficking of TrkB enhances the response of neurons to BDNF. PloS One. 2013;8:e72164. doi: 10.1371/journal.pone.0072164. [DOI] [PMC free article] [PubMed] [Google Scholar]
- 15.Felsky D, Szeszko P, Yu L, Honer WG, De Jager PL, Schneider JA, et al. The SORL1 gene and convergent neural risk for Alzheimer’s disease across the human lifespan. Mol Psychiatry. 2014;19:1125–32. doi: 10.1038/mp.2013.142. [DOI] [PMC free article] [PubMed] [Google Scholar]
- 16.Grear KE, Ling I-F, Simpson JF, Furman JL, Simmons CR, Peterson SL, et al. Expression of SORL1 and a novel SORL1 splice variant in normal and Alzheimers disease brain. Mol Neurodegener. 2009;4:46. doi: 10.1186/1750-1326-4-46. [DOI] [PMC free article] [PubMed] [Google Scholar]
- 17.Voineskos AN, Lerch JP, Felsky D, Shaikh S, Rajji TK, Miranda D, et al. The brain-derived neurotrophic factor Val66Met polymorphism and prediction of neural risk for Alzheimer disease. Arch Gen Psychiatry. 2011;68:198–206. doi: 10.1001/archgenpsychiatry.2010.194. [DOI] [PubMed] [Google Scholar]
- 18.Bennett DA, Schneider JA, Arvanitakis Z, Wilson RS. Overview and findings from the religious orders study. Curr Alzheimer Res. 2012;9:628–45. doi: 10.2174/156720512801322573. [DOI] [PMC free article] [PubMed] [Google Scholar]
- 19.Chibnik LB, Shulman JM, Leurgans SE, Schneider JA, Wilson RS, Tran D, et al. CR1 is associated with amyloid plaque burden and age-related cognitive decline. Ann Neurol. 2011;69:560–9. doi: 10.1002/ana.22277. [DOI] [PMC free article] [PubMed] [Google Scholar]
- 20.Purcell S, Neale B, Todd-Brown K, Thomas L, Ferreira MAR, Bender D, et al. PLINK: A Tool Set for Whole-Genome Association and Population-Based Linkage Analyses. Am J Hum Genet. 2007;81:559–75. doi: 10.1086/519795. [DOI] [PMC free article] [PubMed] [Google Scholar]
- 21.Yu L, Chibnik LB, Srivastava GP, Pochet N, Yang J, Xu J, et al. Association of Brain DNA methylation in SORL1, ABCA7, HLA-DRB5, SLC24A4, and BIN1 with pathological diagnosis of Alzheimer disease. JAMA Neurol. 2015;72:15–24. doi: 10.1001/jamaneurol.2014.3049. [DOI] [PMC free article] [PubMed] [Google Scholar]
- 22.Arfanakis K, Fleischman DA, Grisot G, Barth CM, Varentsova A, Morris MC, et al. Systemic inflammation in non-demented elderly human subjects: brain microstructure and cognition. PLoS ONE. 2013;8:e73107. doi: 10.1371/journal.pone.0073107. [DOI] [PMC free article] [PubMed] [Google Scholar]
- 23.Petersen RC, Aisen PS, Beckett LA, Donohue MC, Gamst AC, Harvey DJ, et al. Alzheimer’s Disease Neuroimaging Initiative (ADNI) clinical characterization. Neurology. 2010;74:201–9. doi: 10.1212/WNL.0b013e3181cb3e25. [DOI] [PMC free article] [PubMed] [Google Scholar]
- 24.Howie BN, Fuchsberger C, Stephens M, Marchini J, Abecasis GR. Fast and accurate genotype imputation in genome-wide association studies through pre-phasing. Nat Genet. 2012;44:955–9. doi: 10.1038/ng.2354. [DOI] [PMC free article] [PubMed] [Google Scholar]
- 25.Fischl B. FreeSurfer. NeuroImage. 2012;62:774–81. doi: 10.1016/j.neuroimage.2012.01.021. [DOI] [PMC free article] [PubMed] [Google Scholar]
- 26.Jahanshad N, Zhan L, Bernstein MA, Borowski BJ, Jack CR, Toga AW, et al. Diffusion tensor imaging in seven minutes: Determining trade-offs between spatial and directional resolution. 2010 IEEE Int Symp Biomed Imaging Nano Macro. 2010:1161–4. doi: 10.1109/ISBI.2010.5490200. [DOI] [Google Scholar]
- 27.Landau SM, Breault C, Joshi AD, Pontecorvo M, Mathis CA, Jagust WJ, et al. Amyloid-β imaging with Pittsburgh compound B and florbetapir: comparing radiotracers and quantification methods. J Nucl Med Off Publ Soc Nucl Med. 2013;54:70–7. doi: 10.2967/jnumed.112.109009. [DOI] [PMC free article] [PubMed] [Google Scholar]
- 28.R Core Team. R: A language and environment for statistical computing. Vienna, Austria: R Foundation For Statistical Computing Vienna, Austria; 2014. [Google Scholar]
- 29.Barrett JC, Fry B, Maller J, Daly MJ. Haploview: analysis and visualization of LD and haplotype maps. Bioinformatics. 2005;21:263–5. doi: 10.1093/bioinformatics/bth457. [DOI] [PubMed] [Google Scholar]
- 30.Replogle JM, Chan G, White CC, Raj T, Winn PA, Evans DA, et al. A TREM1 variant alters the accumulation of Alzheimer-related amyloid pathology. Ann Neurol. 2015;77:469–77. doi: 10.1002/ana.24337. [DOI] [PMC free article] [PubMed] [Google Scholar]
- 31.Braak H, Thal DR, Ghebremedhin E, Del Tredici K. Stages of the pathologic process in Alzheimer disease: age categories from 1 to 100 years. J Neuropathol Exp Neurol. 2011;70:960–9. doi: 10.1097/NEN.0b013e318232a379. [DOI] [PubMed] [Google Scholar]
- 32.Ward D, Summers MJ, Saunders NL, Ritchie K, Summers JJ, Vickers JC. The BDNF Val66Met polymorphism moderates the relationship between cognitive reserve and executive function. Transl Psychiatry. 2015;5:e590. doi: 10.1038/tp.2015.82. [DOI] [PMC free article] [PubMed] [Google Scholar]
- 33.Willnow TE, Petersen CM, Nykjaer A. VPS10P-domain receptors - regulators of neuronal viability and function. Nat Rev Neurosci. 2008;9:899–909. doi: 10.1038/nrn2516. [DOI] [PubMed] [Google Scholar]
- 34.Chen Z-Y, Ieraci A, Teng H, Dall H, Meng C-X, Herrera DG, et al. Sortilin controls intracellular sorting of brain-derived neurotrophic factor to the regulated secretory pathway. J Neurosci Off J Soc Neurosci. 2005;25:6156–66. doi: 10.1523/JNEUROSCI.1017-05.2005. [DOI] [PMC free article] [PubMed] [Google Scholar]
- 35.Fehér A, Juhász A, Rimanóczy A, Kálmán J, Janka Z. Association between BDNF Val66Met polymorphism and Alzheimer disease, dementia with Lewy bodies, and Pick disease. Alzheimer Dis Assoc Disord. 2009;23:224–8. doi: 10.1097/WAD.0b013e318199dd7d. [DOI] [PubMed] [Google Scholar]
- 36.Lim YY, Villemagne VL, Laws SM, Ames D, Pietrzak RH, Ellis KA, et al. BDNF Val66Met, Aβ amyloid, and cognitive decline in preclinical Alzheimer’s disease. Neurobiol Aging. 2013;34:2457–64. doi: 10.1016/j.neurobiolaging.2013.05.006. [DOI] [PubMed] [Google Scholar]
- 37.Hsu P-K, Xu B, Mukai J, Karayiorgou M, Gogos JA. The BDNF Val66Met variant affects gene expression through miR-146b. Neurobiol Dis. 2015;77:228–37. doi: 10.1016/j.nbd.2015.03.004. [DOI] [PMC free article] [PubMed] [Google Scholar]
- 38.Brown MS, Ye J, Rawson RB, Goldstein JL. Regulated intramembrane proteolysis: a control mechanism conserved from bacteria to humans. Cell. 2000;100:391–8. doi: 10.1016/S0092-8674(00)80675-3. [DOI] [PubMed] [Google Scholar]
- 39.Nyborg AC, Ladd TB, Zwizinski CW, Lah JJ, Golde TE. Sortilin, SorCS1b, and SorLA Vps10p sorting receptors, are novel gamma-secretase substrates. Mol Neurodegener. 2006;1:3. doi: 10.1186/1750-1326-1-3. [DOI] [PMC free article] [PubMed] [Google Scholar]
- 40.Caglayan S, Takagi-Niidome S, Liao F, Carlo A-S, Schmidt V, Burgert T, et al. Lysosomal sorting of amyloid-β by the SORLA receptor is impaired by a familial Alzheimer’s disease mutation. Sci Transl Med. 2014;6:223ra20. doi: 10.1126/scitranslmed.3007747. [DOI] [PubMed] [Google Scholar]
- 41.Vardarajan BN, Zhang Y, Lee JH, Cheng R, Bohm C, Ghani M, et al. Coding mutations in SORL1 and Alzheimer disease. Ann Neurol. 2015;77:215–27. doi: 10.1002/ana.24305. [DOI] [PMC free article] [PubMed] [Google Scholar]
- 42.Ramasamy A, Trabzuni D, Guelfi S, Varghese V, Smith C, Walker R, et al. Genetic variability in the regulation of gene expression in ten regions of the human brain. Nat Neurosci. 2014;17:1418–28. doi: 10.1038/nn.3801. [DOI] [PMC free article] [PubMed] [Google Scholar]
- 43.Sebollela A, Freitas-Correa L, Oliveira FF, Paula-Lima AC, Saraiva LM, Martins SM, et al. Amyloid-β oligomers induce differential gene expression in adult human brain slices. J Biol Chem. 2012;287:7436–45. doi: 10.1074/jbc.M111.298471. [DOI] [PMC free article] [PubMed] [Google Scholar]
- 44.Small SA, Kent K, Pierce A, Leung C, Kang MS, Okada H, et al. Model-guided microarray implicates the retromer complex in Alzheimer’s disease. Ann Neurol. 2005;58:909–19. doi: 10.1002/ana.20667. [DOI] [PubMed] [Google Scholar]
- 45.Dickson TC, Vickers JC. The morphological phenotype of beta-amyloid plaques and associated neuritic changes in Alzheimer’s disease. Neuroscience. 2001;105:99–107. doi: 10.1016/s0306-4522(01)00169-5. [DOI] [PubMed] [Google Scholar]
- 46.Yamaguchi H, Hirai S, Morimatsu M, Shoji M, Harigaya Y. Diffuse type of senile plaques in the brains of Alzheimer-type dementia. Acta Neuropathol (Berl) 1988;77:113–9. doi: 10.1007/BF00687420. [DOI] [PubMed] [Google Scholar]
- 47.Morris JC, Storandt M, McKeel DW, Rubin EH, Price JL, Grant EA, et al. Cerebral amyloid deposition and diffuse plaques in “normal” aging Evidence for presymptomatic and very mild Alzheimer’s disease. Neurology. 1996;46:707–19. doi: 10.1212/WNL.46.3.707. [DOI] [PubMed] [Google Scholar]
- 48.Parihar MS, Brewer GJ. Amyloid beta as a modulator of synaptic plasticity. J Alzheimers Dis JAD. 2010;22:741–63. doi: 10.3233/JAD-2010-101020. [DOI] [PMC free article] [PubMed] [Google Scholar]
- 49.Lee H, Zhu X, Castellani RJ, Nunomura A, Perry G, Smith MA. Amyloid-beta in Alzheimer disease: the null versus the alternate hypotheses. J Pharmacol Exp Ther. 2007;321:823–9. doi: 10.1124/jpet.106.114009. [DOI] [PubMed] [Google Scholar]
- 50.Whitson JS, Selkoe DJ, Cotman CW. Amyloid beta protein enhances the survival of hippocampal neurons in vitro. Science. 1989;243:1488–90. doi: 10.1126/science.2928783. [DOI] [PubMed] [Google Scholar]
- 51.Choi SR, Schneider JA, Bennett DA, Beach TG, Bedell BJ, Zehntner SP, et al. Correlation of amyloid PET ligand florbetapir F 18 (18F-AV-45) binding with β-amyloid aggregation and neuritic plaque deposition in postmortem brain tissue. Alzheimer Dis Assoc Disord. 2012;26:8–16. doi: 10.1097/WAD.0b013e31821300bc. [DOI] [PMC free article] [PubMed] [Google Scholar]
- 52.Scherzer CR, Offe K, Gearing M, Rees HD, Fang G, Heilman CJ, et al. Loss of apolipoprotein E receptor LR11 in Alzheimer disease. Arch Neurol. 2004;61:1200–5. doi: 10.1001/archneur.61.8.1200. [DOI] [PubMed] [Google Scholar]
- 53.Pruim RJ, Welch RP, Sanna S, Teslovich TM, Chines PS, Gliedt TP, et al. LocusZoom: regional visualization of genome-wide association scan results. Bioinformatics. 2010;26:2336–7. doi: 10.1093/bioinformatics/btq419. [DOI] [PMC free article] [PubMed] [Google Scholar]
Associated Data
This section collects any data citations, data availability statements, or supplementary materials included in this article.