BACKGROUND
Attention-deficit/hyperactivity disorder (ADHD) is a common neurobehavioral condition in childhood.1 Of the 3–10% of children diagnosed with ADHD, it is thought that approximately one- to two-thirds (1–6% of the general population) will continue to have ADHD symptoms in adult life1
According to the American Psychiatric Association’s Diagnostic and Statistical Manual, fifth edition (DSM-5), ADHD is characterized by a persistent pattern of inattention, hyperactivity, and impulsivity that interferes with functioning or development2
In general, adults diagnosed with ADHD have been shown to have more impairments related to their work/school and social lives than matched samples of adults without ADHD.3–8 These impairments are key components of the diagnosis of ADHD, according to the DSM-5.2 Symptoms necessary for this diagnosis include impairments in interpersonal communication, irritability/mood, lability, and cognition (including attention, executive function, or memory)2
Various scales and instruments, such as the Behavior Rating Inventory of Executive Function-Adult version (BRIEF-A) assessments or the Brown Attention-Deficit Disorder Scale (BADDS), have also been used to assess the impairments in functioning commonly associated with ADHD9–11
However, these scales and DSM-5 criteria may not fully characterize the manifestation of adult ADHD symptoms in the work/school, home, and/or social settings across all times of the day
In addition, the degree of impairment in daily life experienced by adults with ADHD being treated with medication has not been well characterized3
OBJECTIVE
The aim of this study was to characterize the type and degree of impairments in daily life of adults reporting ADHD who are also being treated with pharmacotherapy. To characterize the true burden of ADHD, the daily life impairments were compared with those reported by a general-population sample of adults without ADHD
METHODS
A cross-sectional, online survey was conducted among adults who reported ADHD and among adults without ADHD (normative sample)
The online survey was developed following a series of qualitative interviews with adults who have ADHD (n =31) used to elicit concepts and impairments specific to the ADHD population
After providing informed consent, the participants were interviewed by a trained interviewer who used a semistructured interview guide to elicit information regarding the participants’ experiences with ADHD, focusing on identifying burden and unmet needs
A draft survey was then tested on a small sample of adults with ADHD (n =5) using cognitive interviewing methodology, and the content of the survey was finalized based on the feedback received
Participant Selection
Participants were recruited in the United States through research participant panels, according to the International Review Board-approved protocol
Participants with ADHD and those without ADHD (normative) were eligible to be included in the study if they met all the respective criteria at the time of screening (Table 1)
Non-ADHD (normative) participants were recruited to match the ADHD sample with regard to gender
Participants received financial remuneration for the time spent completing the survey
TABLE 1. ENTRY CRITERIA.
| ADHD PARTICIPANTS | NON-ADHD (NORMATIVE) PARTICIPANTS |
|---|---|
|
|
Online Survey
Both normative (non-ADHD) participants and those with treated ADHD were asked questions relating to their everyday life challenges
Participants reporting ADHD completed a 30-minute online survey. The survey included sociodemographic and clinical questions, along with questions relating to the participants’ experiences with ADHD treatment and their everyday activities
The normative participants completed a shorter version of the online survey, which lasted approximately 15 minutes. The survey included sociodemographic questions and questions related to everyday activities
Data Analysis
Descriptive statistics were calculated for each survey question: mean with standard deviation (SD) or standard error (SE) for normally distributed continuous data; median with range and/or interquartile range for non-normally distributed continuous data; and frequency with percentages for categorical data
The statistical significance of differences between ADHD and non-ADHD subgroups was assessed using independent sample t-tests or Mann-Whitney tests for comparing normally and non-normally distributed continuous data, respectively. Chi-squared tests were used to compare categorical data
RESULTS
Participant Characteristics
A total of 616 adults with ADHD treated with pharmacotherapy and 200 non-ADHD (normative) adults completed the online survey
-
The majority of participants were female (70% [n =433] of the ADHD group; 70% [n =140] of the non-ADHD controls) (Table 2). The treated ADHD participants were
○ younger than the non-ADHD participants (mean 39.0 [SD =12.4] years and mean 43.1 [SD =17.0] years, respectively; P <0.001)
○ more likely to be white (89% [n =551] vs. 84% [n =168]; P <0.05)
○ less likely to be married but more likely to be in a serious relationship (P < 0.05)
○ more likely to be employed full time (P <0.001), and
○ less likely to be unemployed (P <0.001)
TABLE 2. PARTICIPANT CHARACTERISTICS OF TREATED ADHD AND NON-ADHD (NORMATIVE) GROUPS.
| ADHD (N =616) | NON-ADHD (N =200) | |
|---|---|---|
| Age (years)** | ||
| Mean (SD) | 39.0 (12.4) | 43.1 (17.0) |
| Range | 18–74 | 18–84 |
| Gender, n (%) | ||
| Male | 183 (29.7) | 60 (30.0) |
| Female | 433 (70.3) | 140 (70.0) |
| Racial background, n (%)* | ||
| White | 551 (89.4) | 168 (84.0) |
| Other | 65 (10.6) | 32 (16.0) |
| Relationship status, n (%)* | ||
| Married | 277 (45.0) | 98 (49.0) |
| Separated | 14 (2.3) | 1 (0.5) |
| Divorced | 64 (10.4) | 22 (11.0) |
| Widowed | 5 (0.8) | 8 (4.0) |
| Living with partner | 61 (9.9) | 16 (8.0) |
| In a serious relationship | 62 (10.1) | 11 (5.5) |
| Single, not in a serious relationship | 129 (20.9) | 43 (21.5) |
| Other | 4 (0.6) | 1 (0.5) |
| Employment status, n (%)** | ||
| Employed, full time | 349 (56.7) | 84 (42.0) |
| Employed, part time | 66 (10.7) | 19 (9.5) |
| Self-employed | 37 (6.0) | 12 (6.0) |
| Student | 32 (5.2) | 23 (11.5) |
| Stay-at-home parent/homemaker | 33 (5.4) | 17 (8.5) |
| Unemployed | 24 (3.9) | 35 (17.5) |
| Retired | 27 (4.4) | 7 (3.5) |
| Disabled | 48 (7.8) | 3 (1.5) |
| Currently attending school/taking classes, n (%)* | ||
| Yes | 129 (20.9) | 22 (11.0) |
| No | 487 (79.1) | 178 (89.0) |
Notes: *P < 0.05,
**P < 0.001 treated ADHD vs. non-ADHD group.
Abbreviations: ADHD, attention-deficit/hyperactivity disorder; SD, standard deviation.
Everyday Life Functional Impairments
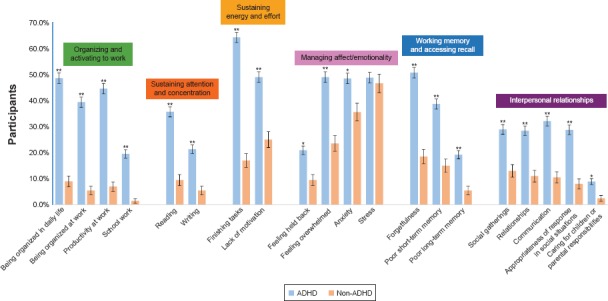
Participants with ADHD reported more impairment in their everyday life than those without ADHD. Significantly more impairments were reported in all the following categories (see Figure 1 for further details):
Figure 1.

Challenges in Everyday Life
Impairments in Home Settings
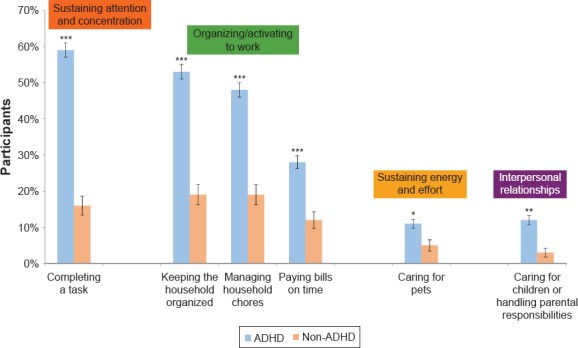
ADHD significantly impacted the participants’ home life in several areas (Figure 2)
Figure 2.

Impairments in Home Settings
Impairments in Social Settings
-
When the participants were asked if they experienced any of the following impacts on their social life, significantly more participants with treated ADHD than normative participants indicated that they:
-
○ Sustaining Attention and Concentration
■ had difficulty focusing when with friends or family (29% [n =180] vs. 6% [n =12]; P <0.0001)
■ had difficulty holding conversations (32% [n =195] vs. 10% [n =20]; P <0.0001)
-
○ Organizing and Activating to Work
■were late to social events (26% [n =162] vs. 7% [n =13]; P <0.001)
-
○ Sustaining Effort
■ could not sit through a movie (19% [n =117] vs. 7% [n =14]; P ⩽ 0.0001)
-
○ Working Memory and Recall
■ tended to forget names (38% [n =231] vs. 23% [n =46]; P = 0.0002)
■ forgot to call friends (30% [n =184] vs. 13% [n =25]; P <0.0001)
-
○Managing Affect/Emotionality
■ felt awkward (38% [n =231] vs. 23% [n =46]; P = 0.0002)
-
○Interpersonal Relationships
■ had difficulty making friends (21% [n =130] vs. 15% [n =29]; P = 0.041)
■ had difficulty maintaining friendships (22% [n =135] vs. 11% [n =22]; P =0.0007)
-
Impairments in School/Work Settings
Participants with ADHD reported significantly more difficulties at school/work than normative participants (Table 3)
TABLE 3. IMPAIRMENTS IN SCHOOL AND WORK SETTINGS REPORTED BY ADHD AND NON-ADHD PARTICIPANTS.
| School | Work | |||
|---|---|---|---|---|
| Difficulty, n (%) participants | ADHD (N =129) | NON-ADHD (N =22) | ADHD (N =452) | NON-ADHD (N =115) |
| Sustaining Attention and Concentration | ||||
| Focusing in class | 65 (50.4) | 7 (31.8) | NA | NA |
| Focusing while doing school work/tasks | 59 (45.7)* | 4 (18.2) | 228 (50.4)*** | 12 (10.4) |
| Taking notes in class/meetings | 40 (31.0)* | 2 (9.1) | 68 (15.0)** | 6 (5.2) |
| Being engaged in meetings | NA | NA | 95 (21.0)*** | 6 (5.2) |
| Organizing and Activating to Work | ||||
| Prioritizing tasks | 41 (31.8) | 4 (18.2) | NA | NA |
| Being organized | NA | NA | 191 (42.3)*** | 13 (11.3) |
| Forgetting to do simple tasks | NA | NA | 141 (31.2)*** | 9 (7.8) |
| Being productive | NA | NA | 155 (34.3)*** | 13 (11.3) |
| Substaining effort | ||||
| Taking a long time to complete tasks | 35 (27.1) | 5 (22.7) | NA | NA |
| Taking tests within allocated time | 33 (25.6) | 5 (22.7) | NA | NA |
| Being on time to class/work | 23 (17.8) | 1 (4.5) | 102 (22.6)** | 9 (7.8) |
| Completing tasks on time | NA | NA | 128 (28.3)*** | 6 (5.2) |
| Interpersonal Relationships | ||||
| Communicating with others | NA | NA | 79 (17.5) | 13 (11.3) |
| Getting along with coworkers | NA | NA | 31 (6.9) | 6 (5.2) |
| Getting along with the boss | NA | NA | 35 (7.7) | 8 (7.0) |
| Other | ||||
| Getting poor grades | 15 (11.6) | 1 (4.5) | NA | NA |
| Keeping a job | NA | NA | 37 (8.2) | 4 (3.5) |
Notes: *P < 0.05,
**P < 0.001,
***P < 0.0001 vs. non-ADHD.
Abbreviation: NA, not asked.
Impaired Relationships
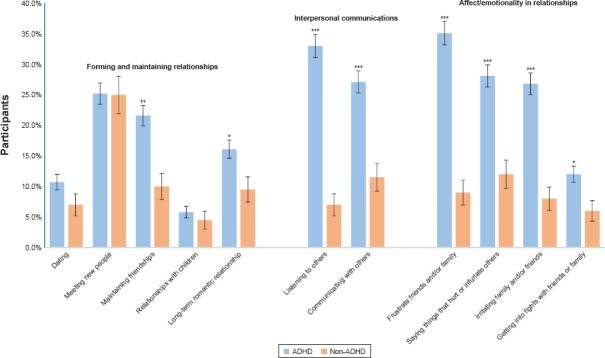
Significantly more participants with treated ADHD than normative participants indicated that they experienced difficulties in various aspects of their relationships, including aspects of affect/emotionality in relationships and interpersonal communication (Figure 2)
A significantly higher percentage of participants with ADHD than normative participants acknowledged challenges in maintaining relationships with adults, but there appeared to be no significant difference between the two groups in new or short-term relationships, such as dating (Figure 3)
Figure 3.

Impaired Relationships
Difficult Days
Significantly more participants with ADHD than normative participants indicated they had days that were more difficult than others (81% [n =499] vs. 69% [n =138]; P <0.001). The top 3 reasons for the more difficult days, reported by significantly more participants with ADHD than normative participants, were having trouble focusing (44% vs. 11%; P <0.0001), having to meet deadlines (30% vs. 12%; P <0.0001), and feeling rushed (40% vs. 24%; P <0.001) (Table 4)
TABLE 4. REASONS FOR DIFFICULT DAYS.
| N (%) PARTICIPANTS | ADHD (N =499) | NON-ADHD (N =138) |
|---|---|---|
| Trying to do too much | 284 (56.9)** | 57 (41.3) |
| Feeling bored | 122 (24.4)* | 21 (15.2) |
| Not getting everything done | 305 (61.1)** | 66 (47.8) |
| Feeling rushed | 200 (40.1)*** | 33 (23.9) |
| Feeling overwhelmed | 280 (56.1)** | 59 (42.8) |
| Having to meet deadlines | 151 (30.3)† | 16 (11.6) |
| Having trouble focusing | 222 (44.5)† | 15 (10.9) |
Note: *P < 0.05,
**P < 0.01,
***P < 0.001,
† P < 0.0001 vs. non-ADHD.
Most Challenging Time of the Day
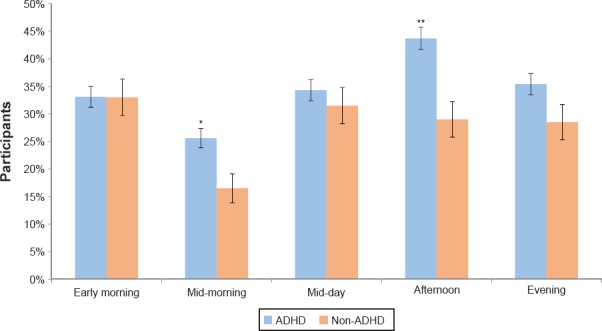
Although participants reported challenges across the day, the most challenging time of day for the greatest number of participants with ADHD was the afternoon (44%, n =269), with this time problematic for fewer (29%, n =58) normative participants (P <0.001) (Figure 3)
The evening was also a challenging time for 35% (n =218) of participants with ADHD and 29% (n =58) of normative participants
Midmorning was significantly more challenging for participants with ADHD than those without (26% [n =158] vs. 17% [n =33]; P < 0.01)
For normative participants the early morning was most challenging for the greatest number (33%, n =66); the same proportion of participants with ADHD also found the early morning the most challenging (33%, n =204) (Figure 4)
Figure 4.

Most Challenging Time of Day
IMPACT ON SLEEP
There was no significant difference between treated ADHD and the non-ADHD sample with respect to the number of participants who had difficulty getting to sleep each night (9% [n =57] vs. 6% [n =12], P . 0.05)
STUDY LIMITATIONS
-
The study had some limitations, potentially affecting the generalizability of the findings
○ The non-ADHD group was not matched with the ADHD group in every aspect; the non-ADHD group was older (mean age 43 vs. 39 years) and less likely to be employed full time (42% [n =84] vs. 57% [n =349]). In addition, both ADHD and non-ADHD groups included more women than men
○ Researchers were unable to objectively assess the percentage of respondents with ADHD receiving optimal medication management, which could impact the degree of self-reported impairments and challenges
○ There is a potential for selection bias, as participants were recruited through research participant panels
○ Because the diagnosis and treatment of ADHD were self-reported and not physician confirmed, participants may have been interviewed who did not meet the study entry criteria
CONCLUSIONS
Even with treatment, those with ADHD report substantial burdens from their ADHD symptoms. Despite receiving treatment, more adults with ADHD reported impairments and challenges in multiple aspects of their daily life than adults without ADHD. Further research is necessary to determine the extent of association between increased impairments/challenges for adults with ADHD and suboptimal management or treatment-agnostic ADHD disease burden
Individuals with ADHD reported being affected by their ADHD impairments during multiple times of the day, with the greatest challenge for most being in the afternoon and evening hours. The challenges faced by adults with ADHD receiving medication occurred at home, school, or work and also impacted patients’ social life and relationships
Given these findings, clinicians prescribing medications for adults with ADHD should monitor treatment response throughout the entire day based on each patient’s specific setting-based impairments. This can facilitate tailoring dose and timing to optimally manage ADHD impairments in adult patients
Footnotes
Presented at the American Psychiatric Association Annual Meeting, May 20–24, 2017, San Diego, CA.
Disclosures
Drs. Brown, Flood, Sarocco, Atkins, and Khachatryan have no conflict of interest to disclose in the preparation of this manuscript.
REFERENCES
- 1.Wender PH, Wolf LE, Wasserstein J. Ann NY Acad Sci. 2001;931:1–16. [PubMed] [Google Scholar]
- 2.Diagnostic and Statistical Manual of Mental Disorders. Fifth. Arlington, VA: American Psychiatric Association; 2013. American Psychiatric Association. [Google Scholar]
- 3.Bernardi S, Faraone SV, Cortese S et al. Psychol Med. 2012;42:875–887. doi: 10.1017/S003329171100153X. [DOI] [PMC free article] [PubMed] [Google Scholar]
- 4.Barkley RA. J Clin Psychiatry. 2002;63(12):10–15. Suppl. [PubMed] [Google Scholar]
- 5.Biederman J, Faraone SV, Spencer TJ et al. J Clin Psychiatry. 2006;67:524–540. doi: 10.4088/jcp.v67n0403. [DOI] [PubMed] [Google Scholar]
- 6.Barkley RA. Postgrad Med. 2008;120:48–59. doi: 10.3810/pgm.2008.09.1907. [DOI] [PubMed] [Google Scholar]
- 7.Barkley RA, Fischer M. Dev Neuropsychol. 2011;36:137–161. doi: 10.1080/87565641.2010.549877. [DOI] [PubMed] [Google Scholar]
- 8.Barkley RA, Knouse LE, Murphy KR. Psychol Assess. 2011;23:437–446. doi: 10.1037/a0022172. [DOI] [PubMed] [Google Scholar]
- 9.Adler LA, Dirks B, Deas PF et al. J Clin Psychiatry. 2013;74:694–702. doi: 10.4088/JCP.12m08144. [DOI] [PubMed] [Google Scholar]
- 10.Kooij JJS, Boonstra AM, Swinkels SH et al. J Atten Disord. 2008;11:445–458. doi: 10.1177/1087054707299367. [DOI] [PubMed] [Google Scholar]
- 11.Brown T. Brown Attention-Deficit Disorder Scales. San Antonio TX: The Psychological Corporation; 1996. [Google Scholar]


