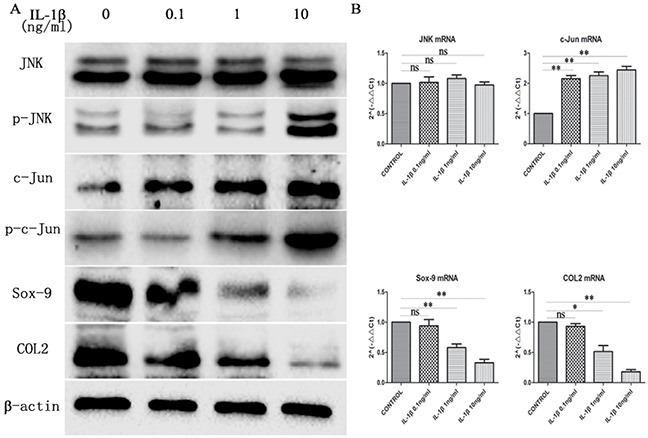
Figure 2. The expression of JNK, p-JNK, c-Jun, p-c-Jun, Sox-9 and COL2 in chondrocytes treated with different concentration of IL-1β.

(A) Western blot was used to JNK, p-JNK, c-Jun, p-c-Jun, Sox-9 and COL2 protein levels in chondrocytes treated with 0, 0.1, 1 and 10ng/ml IL-1β. Bands were quantified using Quantity One 5.0. (B) The mRNA levels of JNK, c-Jun, Sox-9 and COL2 in the chondrocytes. The 2−ΔΔCt method was adopted with GAPDH as the reference gene. Bars represent the mean ± SD of each group (n = 6). As a control, the membrane was stripped and incubated with β-actin. Significant differences between the groups are marked with asterisks (*P< 0.05, **P< 0.01); ns: no statistical significance.
