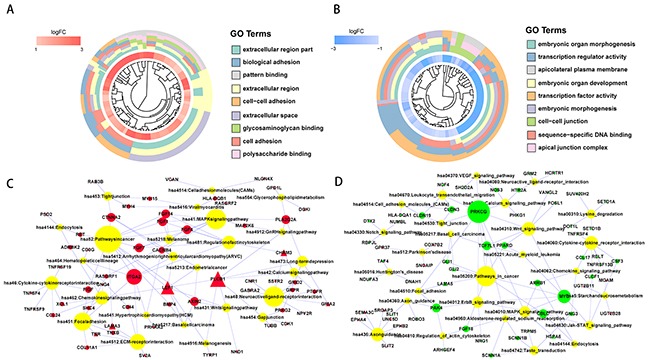
Figure 2. Functional enrichment analysis of significantly upregulated and downregulated protein-coding genes.

GOcluster plot showing a circular dendrogram of the clustering of the expression spectrum. The inner ring indicates the color-coded logFC. Red represents significantly upregulated (A) and blue represents significantly downregulated (B) protein-coding genes. The outer ring displays the assigned functional terms. KEGG pathway enrichment of significantly upregulated (C) and downregulated (D) protein-coding genes. The red node represents significantly upregulated protein-coding genes. The green node represents significantly downregulated protein-coding gene. The yellow node represents enriched pathway symbols. The triangular node represents HCC driver genes from the Driver DB V2 database. The size of the node represents the number of genes.
