

Abstract
The mechanical fingerprint of cells is inherently linked to the structure of the cytoskeleton and can serve as a label‐free marker for cell homeostasis or pathologic states. How cytoskeletal composition affects the physical response of cells to external loads has been intensively studied with a spectrum of techniques, yet quantitative and statistically powerful investigations in the form of titration assays are hampered by the low throughput of most available methods. In this study, we employ real‐time deformability cytometry (RT‐DC), a novel microfluidic tool to examine the effects of biochemically modified F‐actin and microtubule stability and nuclear chromatin structure on cell deformation in a human leukemia cell line (HL60). The high throughput of our method facilitates extensive titration assays that allow for significance assessment of the observed effects and extraction of half‐maximal concentrations for most of the applied reagents. We quantitatively show that integrity of the F‐actin cortex and microtubule network dominate cell deformation on millisecond timescales probed with RT‐DC. Drug‐induced alterations in the nuclear chromatin structure were not found to consistently affect cell deformation. The sensitivity of the high‐throughput cell mechanical measurements to the cytoskeletal modifications we present in this study opens up new possibilities for label‐free dose‐response assays of cytoskeletal modifications.
Keywords: cell mechanics, cytoskeleton, label‐free cell characterization, real‐time deformability cytometry
1. INTRODUCTION
The animal cell cytoskeleton is a highly dynamic network of protein filaments essential for numerous cell functions such as migration (Keren et al., 2008; Pollard & Cooper, 2009), proliferation (Jordan, Toso, Thrower, & Wilson, 1993; Provenzano & Keely, 2011), and phagocytosis (May & Machesky, 2001). Regulated formation and turnover of cytoskeletal structures provide the cell with spatiotemporal flexibility to reshape and adapt to its physical environment while maintaining the mechanical integrity of the cellular body to withstand external forces (Alberts et al., 2008; Fletcher & Mullins, 2010). Changes in cell state as by differentiation (Ekpenyong et al., 2012) or malignant transformation (Guck et al., 2005; Suresh, 2007) can be associated with distinct modulations in the cytoskeleton, which were identified to result in characteristic mechanical phenotypes. The mechanical properties of cells can thus provide an intrinsic marker for cell homeostasis and pathogenesis (Byun et al., 2013; Remmerbach et al., 2009; Tse et al., 2013).
The rapidly increasing number of techniques probing the mechanical response of cells to external loads clearly demonstrates the pursuit in exploiting cell mechanical phenotyping as a label‐free tool for biological research and medical applications (Guck & Chilvers, 2013; Suresh, 2007; Suresh et al., 2005). But to date, the widespread use of cell mechanical phenotyping in cell screening and medical diagnosis is still hampered by the low throughput rates of established techniques, such as atomic force microscopy (AFM) and micropipette aspiration (MPA) operating at 10–100 cells · hr−1 (Hochmuth, 2000; Sokolov, 2007). The typically large natural heterogeneities in biological specimens require novel techniques allowing for fast mechanical classification of large populations, while minimizing sample preparation time and bias from the user. To address this demand, several microfluidic techniques with throughput rates in excess of 10,000 cells · hr−1 have been introduced recently (Dudani, Gossett, Tse, & Di Carlo, 2013; Gossett et al., 2012; Lange et al., 2015; Lee & Lie, 2015; Qi et al., 2015; Rosenbluth Lam, & Fletcher 2008). So far, none of these approaches was used to exploit the statistical power of high‐throughput single‐cell mechanical measurements to quantify the effect of drug‐induced cytoskeletal modifications by comprehensive titration assays. This is possibly hindered either by low sensitivity to cytoskeletal modifications (Dudani et al., 2013; Gossett et al., 2012), insufficient throughput rates for large‐scale cell screening (Lange et al., 2015), or potential biasing effects due to direct contact between cells and microfluidic chip (Rosenbluth et al., 2008) in existing techniques.
We recently introduced a novel tool called real‐time deformability cytometry (RT‐DC) that addresses the persisting need for continuous single‐cell mechanical phenotyping of large cell populations in real‐time (Otto et al., 2015). Cells are advected by a laminar flow through a microfluidic constriction with dimensions on the order of the cell size at rates of up to 1,000 cells · s−1 (Figure 1a). Velocity gradients in the Poiseuille flow field result in shear forces on the cell periphery on the order of 1 μN that lead to deformation of the initially spherical cells into a characteristic bullet‐like shape (Mietke et al., 2015). At defined regions of interest (ROIs), a high‐speed camera acquires images of the cell shapes that are fed to a custom algorithm for on‐the‐fly data analysis. Therefore, we avoid the collection of large quantities of empty video data while being able to gate for relevant subpopulations, which in combination allows us to continuously measure quasi‐unlimited sample sizes. Consequently, RT‐DC opens up the previously unavailable possibility to perform label‐free dose–response assays based on high‐throughput cell mechanical phenotyping.
Figure 1.
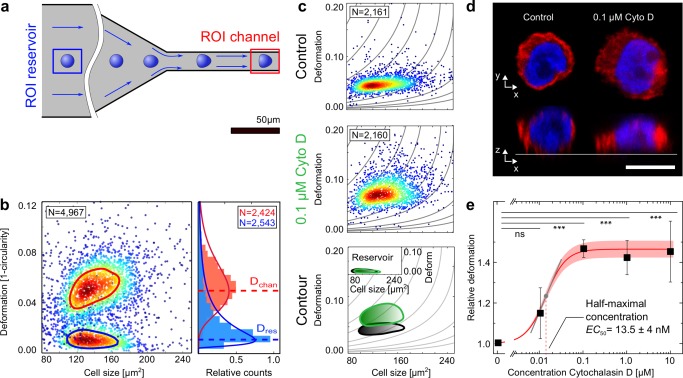
RT‐DC setup and effect of Cytochalasin D (Cyto D) on cell deformation. (a) Schematic drawing of RT‐DC microfluidic chip geometry composed of a reservoir (blue box) and a channel region (red box). Deformation of suspended cells results from hydrodynamic surface stresses in the channel region, is imaged using a high‐speed camera and analyzed in real‐time. (b) Outcome of a reservoir (blue contour) and a channel (red contour) measurement superimposed into one graph with contour lines marking 50% of the maximal event density. The right side of the graph schematically illustrates how fitting lognormal functions to the deformation histograms allow for the extraction of deformation mode values for each population. (c) Scatter plots of HL‐60 cell populations incubated without (control) and with 0.1 μM Cyto D. The contour lines compare the 50% event density of the control (black) vs Cyto D (green). The inset shows the reservoir measurement for reference. (d) Representative fluorescence images (F‐actin, red and DNA, blue) of a control cell and a cell after Cyto D treatment. Scale bar is 10 μm. (e) Dose‐response graph showing mean RD values of four experimental replicates of HL‐60 cell population treated with increasing concentrations of Cyto D. Error bars are standard error of the mean (SEM). Sigmoidal fit to the data allowed for the extraction of a half‐maximal (EC50) concentration for the effect of Cyto D treatment on the deformation of HL‐60 cells. Shaded red area indicates 95% confidence interval of the fit. Tangential slope at the inflection point of the sigmoidal fit function is 0.5 with Hill coefficient 1.89. Significance of changes in the RD mean values with respect to the control is indicated by p values of *** p ≤ 0.001, ** p ≤ 0.01, * p ≤ 0.05, and ns, not significant. All experiments were carried out at a flow rate of 0.04 μL·s−1 in a 20 × 20 × 300 μm (w × h × l) channel. [Color figure can be viewed at wileyonlinelibrary.com]
In this work, we employ RT‐DC to investigate the effect of various pharmacological reagents on the cell mechanical properties of a human myeloid precursor cell line (HL‐60). These reagents selectively alter filamentous actin (F‐actin), the microtubule network and nuclear chromatin structure. Previous studies, using established techniques such as atomic force microscopy (AFM), optical stretcher (OS), and micropipette aspiration (MPA), revealed strong influence of F‐actin and microtubule stability on the cell mechanical properties (Kasas et al., 2005; Maloney & Van Vliet, 2014; Reynolds et al., 2014). By relating RT‐DC measurements with fluorescence microscopy, we show that the F‐actin depolymerizing drug Cytochalasin D (Cyto D) leads to significantly increased cell deformation, whereas microtubule disruption by Nocodazole (Noco) strongly reduces cell deformation. Stabilization of microtubules by Paclitaxel (Pac) and F‐actin by Jasplakinolide (Jaspla) revealed a surprising increase in cell deformation with nonmonotonic concentration dependencies. Nuclear chromatin decondensation by Trichostatin A (TSA) in turn did not show a consistent effect on the cell deformation in RT‐DC. Finally, we establish titration assays for all chemicals employed over a concentration range of four orders of magnitude, allowing for extraction of statistical significance and half‐maximal concentration of the mechanical response after drug‐induced cytoskeletal alterations. RT‐DC's capability of quasi‐unlimited continuous measurements and processing times of <10 min · sample−1 allow for testing numerous experimental conditions with unprecedented statistical power. Our results constitute a comprehensive quantitative approach to cell mechanical dose–response assays comprising at least 120,000 single‐cell events per titration.
2. RESULTS
2.1. Alteration of the F‐actin network increases cell deformation in RT‐DC
Actin is a structural protein of the eukaryotic cytoskeleton and in its filamentous form (F‐actin) among others determinants for cell shape and motility (Keren et al., 2008; Rafelski & Theriot, 2004; Salbreux, Charras, & Paluch, 2012). Destabilization of F‐actin was achieved using the fungal poison Cytochalasin D, known to cap the plus ends of actin filaments and thereby leading to rapid filament depolymerization (Cooper, 1987). In contrast, Jasplakinolide lowers the critical concentration of actin monomers (G‐actin) essential for stable filament growth thus promoting F‐actin polymerization (Holzinger, 2010). The effect of Cyto D and Jaspla on the size and mechanical phenotype of a suspended human myeloid precursor cell line (HL‐60) (Steven, 1960) was investigated for at least three biological replicates each.
Size and deformation of each individual cell are acquired and quantified in real‐time using RT‐DC (Section 4). Briefly, suspended viable cells are driven through a microfluidic channel in which hydrodynamic forces lead to characteristic bullet‐like deformations of the initially spherical cells, reaching a steady state at the rear end of the channel (Figure 1a, red square). Cell deformation D is quantified based on the circularity c of each cell (D = 1 − c) as described in Section 4 [Equation 1]. As the natural unperturbed contours of HL‐60 cells are circular, cell shapes picked up by RT‐DC exhibit minimal deformation (D ∼ 0) in the environment prior to the channel entrance, which we refer to as the reservoir (Figure 1a, blue square). It serves as reference to relate the ensuing cell deformation (D > 0) inside the channel (Figure 1a, red square) to the initial shape of the cells.
For a typical RT‐DC measurement, cell deformation and size (projected cell area in μm2) of more than 2,000 single‐cell events per condition are analyzed in real time. The resulting, characteristically scattered distributions for a cell population measured in the reservoir and channel are exemplarily superimposed in Figure 1b. A clear separation between the population of unperturbed cells in the reservoir that accumulate around low deformation values (blue contour) and the cell population inside the channel exhibiting elevated deformation (red contour) can be observed. The continuous lines represent contour plots of 50% of the maximum event density to facilitate comparison. Lognormal functions fitted to the deformation histograms allow for the extraction of mode deformation values D that permit further quantitative data analysis.
Figure 1c displays the representative channel measurements of a control cell population prior (black contour) and after treatment with Cyto D (green contour). Comparison of these scatter plots reveals that exposure of the control sample to a concentration of 0.1 μM Cyto D shifts the population toward elevated deformation values. The effect is even more obvious when comparing the contour plots of both datasets superimposed in the bottom graph of Figure 1c. Grey lines in the background of each graph illustrate the functional dependence of the deformation on size for a purely elastic sphere with a fixed Young's modulus to disentangle changes in cell size from changes in cell mechanical properties (Mietke et al., 2015). Quantitative analysis of the depicted populations unveils an increase in mode deformation from D = 0.043 to D = 0.062 (corresponding to a relative change of 44%) along with elevated heterogeneity as standard deviation (SD) rises from SD = 0.024 to SD = 0.031 (increase by 31%) after Cyto D treatment. The flow rate employed for all data shown here was 0.04 μL · s−1, but also higher flow rates of 0.08 and 0.12 μL · s−1 were tested for each replicate of the respective drug. The ensuing elevated stress levels resulted in increased cell deformation in all tested cases. Additionally the mechanical effect of Cyto D treatment, leading to larger cell deformation compared to the untreated control, was conserved throughout all flow rates (Supporting Information, Figure S1). The apparent gain in cell deformation inside the channel is neither related to changes in cell size nor to initially altered cell shapes by Cyto D treatment, as cells in the reservoir exhibit nearly circular contours and comparable cross‐sectional areas for both the treated and the control populations (inset, Figure 1c). Consequently, cell sizes in the reservoir and the channel are not affected by Cyto D treatment. The observed increase in deformation could originate from F‐actin depolymerization, resulting in a loss of cell rigidity which has been reported by previous experiments using a variety of different techniques (Ekpenyong, 2012; Reynolds et al., 2014; Rotsch & Radmacher, 2000; Wu, Kuhn, & Moy, 1998). Fluorescence micrographs of fixed cells (Figure 1d, F‐actin labeled red (FITC) and DNA labeled blue (DAPI)) support this assumption as an obvious loss of the spherical cell shape presumably due to a lack of cytoskeletal integrity can be identified for a representative cell after 0.1 μM Cyto D treatment.
The high‐throughput (up to 1,000 cells · s−1) and short‐sample processing times (10 min · sample−1) of RT‐DC allow for dose–response experiments to investigate the effect of increasing Cyto D concentrations on cell deformation in large cell populations. We introduce a novel parameter termed relative deformation (RD) [Equation 2], a measure which normalizes deformation values to a control sample and takes into account potential, deformation‐independent morphological changes induced by the drug treatment (Section 4). Each data point depicted in Figure 1e represents the mean of four RD values calculated from four population mode values D of four experimental replicates. With at least 2,000 cells per population mode value D, one data point in Figure 1e is the weighted result of at least 32,000 single‐cell events, yielding a total cell number of at least 160,000 for the full titration. For simplicity, only data for the lowest flow rate of 0.04 μL · s−1 is shown, yet the data for higher flow rates of 0.08 and 0.12 μL · s−1 follow the same trend of increasing cell deformation for elevated drug concentration (full panel of all applied flow rates are shown in Supporting Information, Figures S1 and S8). Error bars are standard errors of the mean (SEM) calculated from four biological replicates. Treatment with 0.01 μM Cyto D and statistical data analysis using a bootstrapping approach did not reveal any significant effect (p > 0.05) on RD. Concentrations equal to and exceeding 0.1 μM Cyto D in turn resulted in significantly (p < 0.001) increased RD values, which reach a plateau around RD of 1.5. A half‐maximal concentration (EC50) for the effect of Cyto D treatment on the deformation of HL‐60 cells of 13.5 ± 4 nM was obtained from a sigmoidal fit to the data (R 2 = 0.99). To quantify the strength of the response (change in cell deformation) to the drug treatment, we extract the Hill coefficient of the sigmoidal fit function and calculate the slope at its inflection point. For visualization a tangent is plotted at the inflection point of the dose‐response curve (grey line in Figure 1e). In the case of Cyto D, the sigmoidal fit function with Hill coefficient 1.89 revealed a slope of .5. In comparison to the other sigmoidal dose–response curves presented in this study, this slope indicates a strong response of cell deformation to the disruption of filamentous actin for Cyto D concentrations around 13.5 nM.
Surprisingly, the F‐actin stabilizing drug Jasplakinolide (Jaspla) did not introduce decreasing HL‐60 cell deformation as naively expected; yet a less continuous elevation in RD than for Cyto D was observed. Treatment with 0.1 μM Jaspla increased mode deformation values from D = 0.048 (Control, black) to D = 0.076 (0.1 μM Jaspla, green) corresponding to a relative change of approximately 58% (Figure 2a). Dispersion of the population in the deformation domain seemed not to be largely affected as the SD exhibited only a minor increase from 0.030 to 0.036. Yet, an apparent increase in the size by approximately 15% of the projected cell areas inside the channel that followed Jaspla treatment shifts the population mean from 148.85 ± 51.22 to 170.48 ± 55.16 μm2. Fluorescence micrographs of a representative cell exposed to 0.1 μM Jaspla display a cell shape that deviates slightly from the spherical contours of a representative control cell (Figure 2b). We argue that Jaspla treatment possibly affects the cell morphology by compromising the molecular dynamics of F‐actin, which is known to play a crucial role in cell morphogenesis (Cramer, 1999; Keren et al., 2008).
Figure 2.
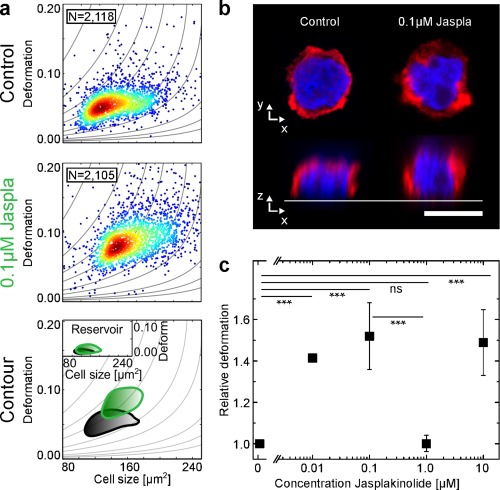
Effect of Jasplakinolide (Jaspla) on cell deformation. HL‐60 cells were incubated with increasing concentrations of Jaspla and cell deformation was observed using RT‐DC. (a) Scatter plots of HL‐60 cell populations incubated without (Control) and with 0.1 μM Jaspla. The contour lines compare the 50% event density of the control (black) vs Jaspla (green). The inset shows the reservoir for reference. (b) Representative fluorescence images (F‐actin, red and DNA, blue) of a control cell and a cell after Jaspla treatment. Scale bar is 10 μm. (c) Dose–response graph showing mean RD values of three replicates of HL‐60 cell population treated with increasing concentrations of Jaspla. Error bars are standard error of the mean (SEM). All experiments were carried out at a flow rate of 0.04 μL·s−1 in a 20 × 20 × 300 μm (w × h × l) channel. p values denote *** p ≤ 0.001, and ns, not significant. [Color figure can be viewed at wileyonlinelibrary.com]
Dose–response experiments over four orders of magnitude show significantly (p < 0.001) increased RD values already at concentrations of 0.01 and 0.1 μM Jaspla (Figure 2c). For a concentration of 0.1 μM, RD values around 1.52 that are comparable to the titration of Cyto D, are consistently observed. Surprisingly, we detect a significant (p < 0.001) drop in RD from 1.52 to 1.00 for a concentration of 1 μM Jaspla. For this concentration, the mechanical phenotype of the treated population is indistinguishable from the control (p ≫ 0.05). The small SEM error bars demonstrate the reproducibility of the effect over at least three measurements of biological replicates performed on different days. Further increase of Jaspla concentration to 10 μM leads to elevation of RD values to the level of deformation observed for 0.1 μM. The full panel (Supporting Information, Figures S3 and S8) shows the same trend for all investigated flow rates, yet exhibits a less pronounced but still significant increase in RD for 0.01 and 0.1 μM Jaspla. However, the distinct reduction in RD for 1 μM Jaspla is conserved for all flow rates. As the dose–response graph for Jaspla does not follow a sigmoidal curve, no half‐maximum concentration could be extracted.
2.2. Modified microtubule stability leads to inverse mechanical responses
Microtubules are a main constituent of the animal cells' cytoskeleton, crucial for intracellular transport (Alberts et al., 2008), cell division (Brugués, Nuzzo, Mazur, & Needleman, 2012), migration, and morphogenesis (Rodriguez et al., 2003). These long, rigid cylindrical biopolymers of assembled tubulin dimers were found to resist contractile forces (Valentine, Perlman, Mitchison, & Weitz, 2005) and interact with other cytoskeletal polymers to stabilize the cytoskeleton (Brangwynne et al., 2006). In this study, we employ commercially available reagents to interfere with the molecular dynamics of the microtubules, such that filament disassembly is impeded or promoted. For this work, we used Paclitaxel (Pac), a drug known to stabilize microtubule filaments by binding to β–tubulin in a binding pocket formed by α‐helices and β‐strands (Schiff, Fant, & Horwitz, 1979; Nogales, Wolf, Khan, Luduena, & Downing, 1995). Nocodazole (Noco) was employed to induce rapid filament decomposition by binding free‐tubulin subunits, thus hindering microtubule assembly and promoting filament depolymerization (Ireland Gull, Gutteridge, & Pogson, 1979).
Figure 3 summarizes the effect of microtubule‐disrupting drug Noco on HL‐60 cells. RT‐DC measurements of an untreated control population (black) are shown in comparison to a population treated with 1 μM Noco (green, Figure 3a). Despite generally elevated heterogeneity in deformation, cells of the treated population surprisingly accumulated toward smaller deformation values with respect to the control. This is confirmed by direct comparison of the superimposed 50% event density lines at the bottom of Figure 3a and further statistical analysis, which indicated a decrease in deformation after Noco treatment from mode deformation D = 0.048 to D = 0.039 ( 23%). While mean cell areas only decreased slightly from 143.8 ± 52.9 to 139.15 ± 53.4 μm2 after Noco, the treated populations exhibit greater heterogeneity in the deformation distribution (SD = 0.057) relative to the control (SD = 0.032). Inside the reservoir cell shapes before (D = 0.011) and after (D = 0.019) Noco treatment deviate from each other, which is an effect that contributes to the decreasing RD values reported in Figure 3c. Fluorescence micrographs of a representative control and a cell exposed to 1 μM Noco with microtubules colored in green (Cy5‐Antibody staining) and DNA in blue (DAPI) fortify this observation, revealing rather irregular cell shapes after Noco treatment (Figure 3b).
Figure 3.
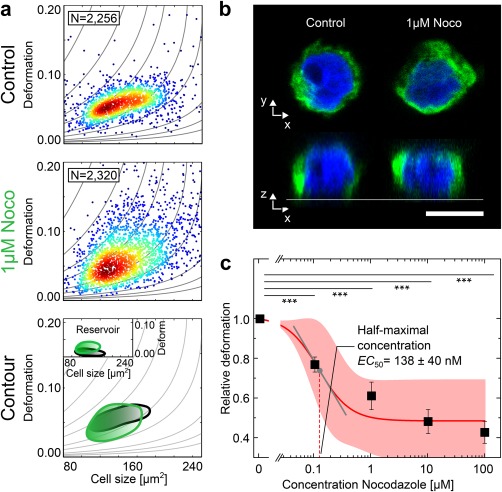
Effect of Nocodazole (Noco) on cell deformation. HL‐60 cells were incubated with various concentrations of Noco and cell deformation was observed using RT‐DC. (a) Scatter plots of HL‐60 cell populations incubated without (Control) and with 1 μM Noco. The contour lines compare the 50% event density of control (black) vs Noco (green). The inset shows the reservoir measurements for reference. (b) Representative fluorescence images (Microtubule, green and DNA, blue). Scale bar is 10 μm. (c) Dose–response graph showing mean RD values of three replicates of HL‐60 cell population treated with increasing concentrations of Noco that allowed for the extraction of a half‐maximal concentration (EC50) for the effect of Noco on cell deformation. Error bars are standard error of the mean (SEM). Shaded red area indicates 95% confidence interval of the fit. Tangential slope at the inflection point of the sigmoidal fit function is 0.5 with Hill Coefficient 1.49. All experiments were carried out at a flow rate of 0.04 μL·s−1 in a 20 × 20 × 300 μm (w × h × l) channel. p values denote *** p ≤ 0.001. [Color figure can be viewed at wileyonlinelibrary.com]
RT‐DC measurements of cell populations exposed to increasing Noco concentrations led to significantly (p < 0.001) decreased RD values for all investigated conditions (Figure 3c). This effect of Noco on cell deformation is conserved for all investigated flow rates shown in Supporting Information, Figures S4 and S8. The consistency of this observation throughout three biological replicates on different days is reflected in the small SEM. A sigmoidal fit to the data (R 2 = 0.96) allowed for the extraction of a half‐maximal concentration of 138 ± 40 nM for the effect of Noco treatment on the deformation of HL‐60 cells. A slope of 0.5 at the inflection point of the sigmoidal fit function (Hill coefficient 1.49) indicates a strong relative response of cell deformation to the disruption of microtubules for Noco concentrations around 138 nM.
Next, we examined the impact of Pac‐induced microtubule stabilization on cell deformation. The results are depicted in Figure 4a and show elevated deformation levels following 1 μM Pac treatment. Quantitative analyses revealed a 58% increase in mode cell deformation from D = 0.045 of the control to D = 0.0715 of the treated population in concert with SD rising from 0.028 to 0.044 (57%). Comparing contour profiles of the cells in the reservoir, the larger mean cross‐sectional areas (160.83 ± 52.30 μm2 control vs 171.85 ± 53.35 μm2 treatment) and more irregular contours (D = 0.007 control vs D = 0.016 after treatment) of cells exposed to 1 μM Pac become apparent (inset, Figure 4a) and correspond to an increase of approximately 7% and 120%, respectively. Fluorescence micrographs (Figure 4b) with DNA in blue (DAPI) contribute to this observation, as thick microtubule bundles, accentuated in green (Cy5‐Antibody staining), are visible in a representative cell exposed to 1 μM Pac. These structures seem to compromise cell shape such that cells appear clearly elongated in the axis of the aligned microtubule bundles. As bundles of stabilized microtubules are long rigid structures (Hawkins, Sept, Mogessie, Straube, & Ross, 2013; Mickey & Howard, 1995), we argue that microtubule stabilization could compromise the overall cell shape and serve as a possible reason for the ellipsoid cell contours and noticeably larger projected cell areas we observed in the reservoir. Elongated cell shapes can furthermore promote microtubule self‐arrangement along the long axis of the cells (Kim & Rejniak, 2014), as observed in the fluorescence micrographs in Figure 4b. These shape inhomogeneities in the reservoir were observed throughout all measurements. Because shear stresses on the cell surface inside microfluidic channels depend on the relative cell size and shapes, statements about the effect of Pac on the mechanical response of the cells need to be made with caution (Mietke et al., 2015).
Figure 4.
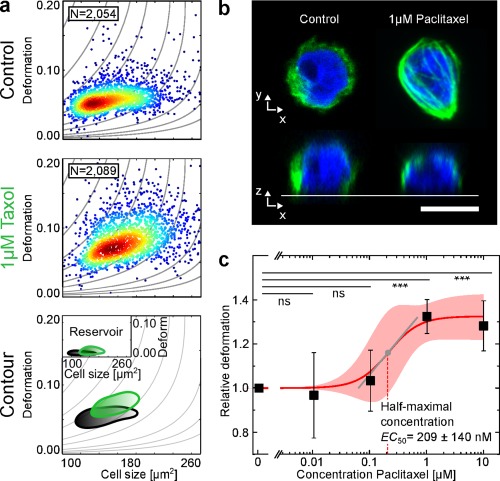
Effect of Paclitaxel (Pac) on cell deformation. HL‐60 cells were incubated with varying concentrations of Pac and cell deformation was observed using RT‐DC. (a) Scatter plots of HL‐60 cell populations incubated without (Control) and with 1 μM Pac. The contour lines compare the 50% event density of the control (black) vs Pac (green). The inset shows the reservoir measurement for reference. (b) Representative fluorescence images (microtubule, green and DNA, blue). Scale bar is 10 μm. (c) Dose–response graph showing mean RD values of three replicates of HL‐60 cell population treated with increasing concentrations of Pac that allowed for the extraction of a half‐maximal concentration (EC50) for the effect of Pac on the deformation of HL‐60 cells. Shaded red area indicates 95% confidence interval of the fit. Tangential slope at the inflection point of the sigmoidal fit function is 0.3 with Hill Coefficient 1.61. Error bars are standard error of the mean (SEM). All experiments were carried out at a flow rate of 0.04 μL·s−1 in a 20 × 20 × 300 μm (w × h × l) channel. p values denote ***p ≤ 0.001 and ns, not significant. [Color figure can be viewed at wileyonlinelibrary.com]
Titration assays of three biological replicates shown in Figure 4c yielded fluctuating RD mean values for concentrations below 1 μM, resulting in large SEM and no statistical significant effect of the treatment. For concentrations equal to and exceeding 1 μM Pac, a significant (p ≤ 0.001) increase in RD was measured, which saturates around RD values of 1.3. The titration curves of the other investigated flow rates of 0.08 and 0.12 μL · s−1 shown in Supporting Information, Figures S5 and S8 tightly follow the course of Figure 4c. A half‐maximal concentration of 209 ± 140 nM for the effect of Pac on the deformation of HL‐60 cells was extracted from a sigmoidal fit (Hill coefficient 1.61) to the data (R 2 = 0.97). At the inflection point of the sigmoidal fit function, a slope of 0.3 was calculated, indicating a moderate response of cell deformation to microtubule stabilization relative to the other sigmoidal dose–response curves presented in this study.
2.3. Chromatin decondensation has no significant effect on cell mechanics in RT‐DC
The nucleus is the biggest organelle in eukaryotic cells and was found to contribute to the cell mechanical phenotype under large strains in other microfluidic applications (Gossett et al., 2012). To investigate the influence of the nuclear structure to the moderate cell deformations predominant in RT‐DC, Trichostatin A (TSA) was applied to decondensate nuclear chromatin. TSA induces hyperacetylation of the histone tails associated with an overshoot of negative charges, which leads to repellent electrostatic forces that drive decondensation of the nuclear chromatin (Yoshida, Kijima, Akita, & Beppu, 1990). The ensuing structural transition of the chromatin was found to take place for sub‐micro‐molar concentrations of TSA (Johnstone, 2002) and resulted in reduced nuclear rigidity (Chalut et al., 2012; Krause, Te Riet, & Wolf, 2013) and altered migration times of invasive cancer cells through microchannels (Fu, Chin, Bourouina, Liu, & VanDongen, 2012; Taubenberger, 2016).
Using RT‐DC, we observed substantial, yet inconsistent effects of TSA treatment on the cell mechanical properties among experimental replicates. Representative data shown in Figure 5a reveals decreasing deformation levels for cells treated with 0.1 μM TSA (green) relative to the control (black). Mode deformation values in the channel declined prominently (by 37%) from D = 0.049 for the control to D = 0.031 after exposure to 0.1 μM TSA, while the heterogeneity of the population increased as SD changed from 0.034 to 0.043 (increase by 26%). Mean cell size increased from 160.96 ± 55.82 to 172.15 ± 57.29 μm2 (7.5%) after exposure to TSA. Higher flow rates did lead to greater cell deformation as expected from the larger stresses on the cell surfaces but followed the same response to TSA treatment as observed for 0.04 μL · s−1 (Supporting Information, Figures S6 and S8). Confocal micrographs of cells with DAPI labeled DNA (blue) and TRITC labeled actin (red) could not reveal structural changes of the cell nucleus after TSA treatment (Figure 5b). However, the magnitude and direction of the observed effects could not be reproduced with subsequent measurements. This is reflected in the large SEM of the dose‐response measurements in Figure 5c. Employing higher flow rates that correspond to elevated stress levels, this trend was confirmed and no notable changes in cell RD were observed. Full panel of all applied flow rates are shown in Supporting Information, Figures S6 and S8, which combines all replicates (overall 100,000 cells). No significant concentration dependence is visible, which indicates that the moderate strains at which RT‐DC operates are not sufficient to reveal effects of chromatin decondensation on the mechanical phenotype.
Figure 5.
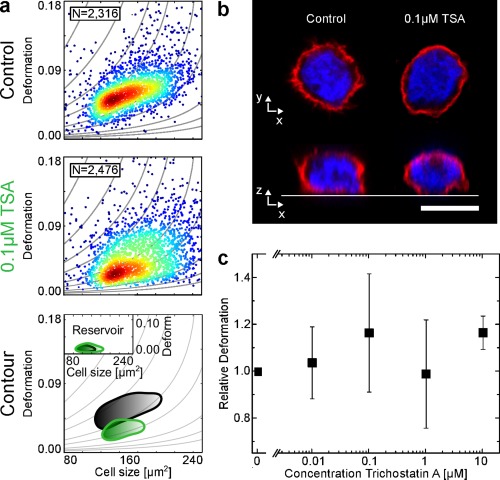
Effect of Trichostatin A (TSA) on cell deformation. HL‐60 cells were incubated with varying concentrations of TSA and cell deformation was observed using RT‐DC. (a) Scatter plots of HL‐60 cell populations incubated without (Control) and with 0.1 μM TSA. The contour lines compare the 50% event density of the control (black) vs TSA (green). The inset shows the reservoir measurement for reference. (b) Representative fluorescence images (F‐actin, red and DNA, blue). Scale bar is 10 μm. (c) Dose–response graph showing mean RD values of four replicates of HL‐60 cell population treated with increasing concentrations of TSA. Error bars are standard error of the mean (SEM). All experiments were carried out at a flow rate of 0.04 μL·s−1 in a 20 × 20 × 300 μm (w × h × l) channel. [Color figure can be viewed at wileyonlinelibrary.com]
3. DISCUSSION
RT‐DC introduces a completely novel approach for mechanical single cell phenotyping of large cell populations by combining continuous high‐throughput measurements of up to 1,000 cells · s−1 with online data analysis. This facilitates comprehensive titration studies of quasi‐unlimited sample size. In fact, the number of single‐cell mechanical measurements per experiment is only limited by the sample volume. By chemically altering the structure of the F‐actin, the microtubule network and the nuclear chromatin, we investigated the ensuing modifications in the deformations of suspended HL‐60 cells. We relate the observed changes in cell deformation to internal restructuring of the cytoskeleton using fluorescent confocal microscopy. Dose–response assays over four orders of magnitude in drug concentration involving up to 160,000 single‐cell events allow for the extraction of half‐maximal drug concentrations and significance assessment of the observed effects.
F‐actin depolymerization by Cytochalasin D (Cyto D) resulted in substantially increased cell deformation associated with a loss of cell shape. Titration assays revealed an increase in relative deformation for Cyto D concentrations up to 0.1 μM reaching a plateau around RD values of 1.5, possibly indicating complete F‐actin disruption above this concentration. Our observations are in agreement with previous studies of F‐actin depolymerization in suspended and adherent cells using the optical stretcher and atomic force microscopy that revealed cell softening and fluidization upon Cyto D treatment (Ekpenyong, 2012; Maloney & Van Vliet, 2014; Reynolds et al., 2014; Rotsch & Radmacher, 2000; Wakatsuki, Schwab, Thompson, & Elson, 2000; Wu et al., 2000). A half‐maximal concentration (EC50) for the effect of Cyto D on cell mechanics of 13.5 nM could be extracted, which compares to values reported in literature of 10 nM for F‐actin depolymerization in purified actin solutions (Brown & Spudich, 1979), yet is in contrast to the 0.25 μM reported for the softening of adherent fibroblasts (Wakatsuki et al., 2000). This discrepancy by a factor of 20 could be explained by the lack of F‐actin stress fibers in suspended cells, such as HL‐60 used in this study, which makes them more sensitive to F‐actin depolymerization (Lautenschläger, 2011).
Next, we subjected HL‐60 cells to Jasplakinolide (Jaspla), a drug which is thought to stabilize F‐actin (Holzinger, 2010). Interestingly, RT‐DC experiments showed a non‐continuous rise of relative deformation associated with increasingly irregular cell shapes, which is in agreement with previous studies. Although the increasing cell deformation observed upon Jaspla treatment appears counterintuitive, cytoplasmic softening upon chemical F‐actin stabilization has been previously reported in Xenopus laevis egg extract (Valentine et al., 2005). In cells, however, contradictory observations of both F‐actin disruption and filament stabilization by Jaspla are reported in the literature (Bubb, Senderowicz, Sausville, Duncan, & Korn, 1994; Murray et al., 1995; Schulze et al., 2010). Particularly for 1 μM Jaspla, reference cell areas are small and exhibit pronounced nonspherical contours associated with decreased cell deformation inside the channel leading to an abrupt drop in relative deformation. Further elevation of Jaspla concentration continued the previous trend of increased relative deformation. Both cell stiffening and softening after Jaspla treatment are reported in the literature across a bandwidth of techniques and concentrations (Lautenschläger, 2011; Rotsch & Radmacher, 2000; Sheikh, Gratzer, Pinder, & Nash, 1997). While our observations suggest that the contradictory results previously reported for Jaspla could possibly originate from a non‐monotonic concentration dependency, experimental time‐scales will also be relevant. RT‐DC probes cell mechanical properties by assessing their steady‐state elasticity over the course of milliseconds (Mietke et al., 2015). Being a nonlinear viscoelastic material, cells will respond differently when a mechanical stress is applied over seconds or minutes.
Microtubule depolymerization by Nocodazole (Noco) and stabilization using Paclitaxel (Pac) resulted in significant, yet counterintuitive mechanical responses of the treated cell populations. For Noco, strongly decreased cell deformation was measured with RT‐DC, which is in agreement with findings in literature of increased cell rigidity upon microtubule depolymerization (Tsai, Waugh, & Keng, 1998; Wu et al., 2000). In our measurement, we pinpointed two proximate causes that account for the consistently observed decreasing RD values after Noco treatment in the dose‐response assay. First, cells inside the channel deformed less with increasing drug concentrations while their sizes were not affected by the treatment. Second, also the initial irregular cell shapes that emerge in the reservoir after Noco application contributed considerably to the effect of decreasing RD as highlighted by Equation (2). Thus, we speculate that secondary mechanisms could be of importance, compensating the loss of integrity in the microtubule network. It was already shown that microtubule disruption can lead to F‐actin assembly which might act as a redundancy mechanism to the loss of microtubules (Tsai et al., 1998; Verin et al., 2001). Dose–response assays of three biological replicates allowed the extraction of an EC50 value of 115 nM for the effect of Noco treatment on the deformation of HL‐60 cells. Comparison to values in the literature is not possible, as the effects of Noco treatment on cell mechanics has to our knowledge not previously been studied in a dose‐dependent way. Slightly lower EC50 values of 42 nM for arresting cells in mitosis and 22 nM for inhibition of cell division by Noco treatment have been reported in the literature (Anderson, Coleman, Andersen, & Roberge, 1997; Jordan, Thrower, & Wilson, 1992), suggesting that cell function might be more sensitive to alterations in the cytoskeleton than the mechanical phenotype of the cell.
Microtubule stabilization by Paclitaxel generated increasing cell deformations for concentrations equal and exceeding 1 μM associated with elongated cell shapes and larger cell areas. Possibly microtubules partly counterbalance the baseline prestress exerted by the F‐actin cytoskeleton onto the cell periphery, such that stabilization of microtubules could shift the mechanical balance to decreased cell rigidity (Stamenović, 2005). However, as cell sizes and shapes are compromised by the Pac treatment, the hydrodynamic stress profile acting on each cells inside the channel possibly differs between the treated and control population (Mietke et al., 2015). An EC50 value was deduced from titration assays yielding a Pac concentration of 209 nM. Again, the comparison to values in the literature is not possible, as the effects of Pac treatment on cell mechanics has to our knowledge not previously been studied in a dose‐dependent way. Yet, half‐maximal Pac concentrations of 80 nM for the stabilized microtubule mass and 8 nM for inhibiting cell proliferation and cell arrest in mitotic metaphase was determined in HeLa cells (Mann, Toso, Thrower, & Wilson, 1993). Pac is a drug used in chemotherapy (Marupudi et al., 2007) because it arrests the cell cycle in mitosis and thus hinders proliferation of rapidly dividing cells. In this context, a half‐maximal Pac concentration of 7 nM for halting cell cycle progression in human MCF‐7 (breast cancer) cells and concentrations between 2.5 and 7.5 nM for inducing apoptosis in several human tumor cell lines after 24 hr incubation were reported (Anderson et al., 1997; Liebmann et al., 1993). Again, these much lower EC50 values suggest that cell function might be more sensitive to alterations in the cytoskeleton than the mechanical phenotype of the cell.
Nuclear chromatin decondensation by deacetylase inhibitor TSA resulted in non‐reproducible effects on cell deformation. This observation might originate from the strain levels employed in this study being on the order of 40%–50% and thus insufficient to probe the mechanical response of the nucleus. In contrast, the technique introduced Gossett et al. (2012) induces strains more than twice as large as observed in RT‐DC and has shown sensitivity toward nuclear architecture. Consequently, putative secondary effects of the drug in the cytoplasm may have dominated the cell deformation we observed in RT‐DC. It was shown earlier that the effect of the nuclear structure on the mechanical properties of cells can be masked by the general state of the cytoskeleton (Panagiotakopoulou, 2016).
Our results highlight the dominant role of the F‐actin cortex and microtubule network for the mechanical response of cells subjected to the hydrodynamic deformations on a millisecond timescale in RT‐DC. Our findings are in line with previously published work, studying the connection between cell mechanics and cytoskeletal composition (Ananthakrishnan et al., 2006; Tsai et al., 1998). With the high‐throughput and sensitivity of RT‐DC to distinct alterations in the cytoskeleton, we go beyond the scope of previous research by establishing comprehensive titration studies of large cell populations. Further investigations relating distinct alterations in the mechanical fingerprint of individual cell types to disease and malignant cell states yield a high potential for RT‐DC as a versatile tool for biological research and large‐scale medical drug screenings.
4. MATERIALS AND METHODS
4.1. Real‐time deformability cytometry
Real‐time deformability cytometry (RT‐DC) for high‐throughput cell mechanical assays has been published previously (Otto et al., 2015). Briefly, the experimental setup consists of a PDMS‐based (polydimethylsiloxane, Sylgard 184, VWR) microfluidic chip (custom made using soft‐lithography) assembled on the xy‐stage of an inverted microscope (Axiovert 200M, Zeiss, Germany). The general chip layout contains a central cell flow and sheath flow for hydrodynamic focusing of the cells while the detection volume consists of a 300 μm long channel with 20 × 20 μm squared cross‐section. Inside this constriction zone (Figure 1a), cells are being deformed due to hydrodynamic interaction without making physical contact to the channel walls. Fluid flow was established using a flow controlled NemeSys syringe pump (Cetoni, Germany). In all experiments we applied flow rates of 0.04, 0.08, and 0.12 μL · s−1. We used disposable chips to avoid cross‐contamination.
4.2. RT‐DC measurement procedure
All experiments were carried out using cells from the human myeloid precursor cell line (HL‐60, generous donation of Donald and Ada Olins) during log‐phase 36 hr after splitting. Prior to an experiment, cells were extracted from cell culture medium (RPMI‐1640 with 10% fetal calf serum (FCS), 1% penicillin/streptavidin, kept in a standard incubator at 37 °C and 5% CO2) by centrifugation at 114 × g for 5 min (Eppendorf 5805 R, Eppendorf) and resuspended in 0.5% w/v methyl cellulose (Sigma Aldrich) in PBS‐(without Mg2+ and Ca2+) (MC‐PBS) to increase shear viscosity to 15 mPa s and reduce cell sedimentation. Final cell concentration was adjusted to >1 Mio cells · mL−1 to reduce experimental duration. Cell suspension was drawn into a 1 mL syringe and connected to a microfluidic chip by polymer tubing (Postnova Analytics, Germany). The computer‐controlled syringe pump established a constant flow rate inside the chip, which was stabilized for 2 min before initiation of the measurement. All experiments were carried out at a constant room temperature of 22 °C in our standard MC‐PBS. All data acquisition was performed at the rear end of the 20 × 20 × 300 μm (w × h × l) channel where the cell deformation reached a steady state and in the reservoir for reference. Filter structures in the reservoir of the microfluidic chip ensured that debris did not reach the central channel. For each experimental condition, approximately 2,000 cells were analyzed.
4.3. Drug treatments
HL‐60 cells were treated with different concentrations of Cytochalasin D, Jasplakinolide, Nocodazole, Paclitaxel, and Trichostatin A (all purchased from Sigma Aldrich, Germany). Concentrations of drugs known to mediate reversible effects in the cytoskeleton were directly adjusted in the cell–MC–PBS buffer suspension used for all RT‐DC measurements. If cytotoxicity forbid exposure times longer than incubation, respective drugs were added to the cell culture medium for incubation and washed out directly before the RT‐DC experiment. High‐throughput rates of 1,000 cells · s−1 decrease the time needed to complete an experiment to <10 min per condition (comprising sample preparation, mounting, measurement of flow rates of 0.04, 0.08, and 0.12 μL · s−1 and reservoir measurements), ensuring best comparability of drug‐induced effects during the measurement.
Cytochalasin D was added to a suspension of 3 Mio cells · mL−1 in MC‐PBS buffer and incubated for 10 min prior to the experiment in a 37 °C water bath. Cytochalasin D remained in cell suspension throughout the experiments due to the reversibility of its effect (Stevenson & Begg, 1994). The presented study was performed using 0.01, 0.1, 1, and 10 μM Cytochalasin D dissolved in dimethyl sulfoxide (DMSO, Sigma Aldrich, Germany), yielding a final DMSO concentration of 0.0025%, 0.025%, 0.25%, and 2.5% (v/v) in the respective sample.
Jasplakinolide was added to the cell culture medium and incubated for 30 min in a 37 °C water bath. Owing to its cytotoxicity, Jasplakinolide (Bubb et al., 1994) was extracted from the cell suspension after incubation by centrifugation for 5 min at 114 × g and discarding the supernatant. Cells were resuspended in the standard MC‐PBS buffer for measurement. As the effect of Jasplakinolide is reversible on timescales of hours (Cramer, 1999), experimental times were limited to 15 min after incubation. The presented study was performed using 0.01, 0.1, 1, and 10 μM Jasplakinolide dissolved in DMSO, yielding a final concentration of 0.007%, 0.07%, 0.7%, and 7% (v/v) in the respective sample.
Nocodazole concentrations were adjusted in a cell suspension of 3 Mio cells · mL−1 in MC‐PBS. The drug concentration was kept constant throughout the incubation time of 60 min (37 °C water bath) and during the experiment. The presented study was performed using 0.1, 1, 10, and 100 μM Nocodazole dissolved in DMSO, yielding a final concentration of 0.0003%, 0.003%, 0.03%, and 0.3% (v/v) in the respective sample.
Paclitaxel was introduced to the cell suspension in culture medium and incubated for 60 min in a 37 °C water bath and washed out by discarding the supernatant after centrifugation. Cells were resuspended in our standard MC‐PBS buffer for RT‐DC measurement. The presented study was performed using 0.01, 0.1, 1, and 10 μM paclitaxel dissolved in DMSO, yielding a final concentration of 0.0002%, 0.002%, 0.02%, and 0.2% (v/v) in the respective sample.
Trichostatin A (TSA) was applied to the cells in culture medium and incubated for 180 min in an incubator at 37 °C and 5% CO2. By this we ensure that the observed changes in cell deformations originate exclusively from the effect of TSA and neither from a lack of CO2 nor due to temperature changes during the long incubation time necessary to ensure the passage of sufficient amount of TSA molecules inside of the nucleus to considerably inhibit histone deacetylation. After incubation period and centrifugation, TSA was discarded together with the supernatant. The remaining pellet of the cells was resuspended in our standard MC‐PBS buffer for measurement. The presented study was performed using 0.1, 1, 10, and 100 μM Nocodazole dissolved in DMSO, yielding a final concentration of 0.0015%, 0.015%, 0.15%, and 1.5% (v/v) in the respective sample.
4.4. Fluorescence staining and imaging
Confocal images of treated and reference cells were obtained with an inverted confocal laser‐scanning microscope (LSM 700, Zeiss). Cells were kept in suspension at a concentration of 1 Mio cells · mL−1 and fixed in 4% paraformaldehyde (PFA, Sigma‐Aldrich) followed by several washing steps with PBS. Subsequently, 50 μL of cell suspension were placed on a Superfrost Gold plus microscope slide (Gerhard Menzel GmbH) for firm anchoring of the cells to the coated glass slide surface after sedimentation. Cells were permeabilized by applying a 0.2% Triton X‐100 (G‐Bioscience) solution for 5 min. Attentive washing steps of the adhered cells were performed using PBS–buffer solution (in‐house media kitchen) followed after each step. In the next steps, cells were incubated for 1 hr with 50 µL of bovine serum albumin (BSA, Sigma Aldrich), followed by several washing steps with PBS and 1 hr incubation with 50 µL (1:200) 12G10 anti‐alpha tubulin produced in mouse (Sigma Aldrich). Subsequently, cells were washed with PBS and exposed to 50 µL staining solution, containing final concentrations of 2.8 µM 4′,6‐diamidino‐2‐phenylindole (DAPI, Life Technologies), 150 nM phalloidin tetramethylrhodamine (TRITC) (Sigma‐Aldrich), and 1 µL Cy5 Goat anti‐mouse IgG (Thermo Fisher Scientific). After 1 hr incubation, the sample was carefully washed several times with PBS, supplied with one drop of ProLong antifade (Life Technologies) and ultimately sealed with a coverslip (Thermo Fisher Scientific).
4.5. DMSO control
All drugs applied in this study were solved in dimethyl sulfoxide (DMSO, Sigma Aldrich) at different concentrations. A high drug concentration in the final sample consequently exposed the cells to considerable concentration of DMSO. Therefore, we investigated the effect of DMSO on cell deformation in an independent dose–response experiment shown in Supporting Information, Figures S7 and S8. Up to a concentration of 1% (v/v) DMSO in the final sample, no effects on cell deformation were observable with respect to an untreated control. For DMSO concentrations exceeding 1% (v/v), cell deformations are decreasing significantly. Consequently, we corrected for the effect of DMSO by a control cell population exposed to the respective concentration of DMSO.
4.6. Quantification of cell deformation
The mechanical fingerprint of large cell ensembles was obtained by RT‐DC measurements at the rear end of the microfluidic channel at flow rates of 0.04, 0.08, and 0.12 μL · s−1 (red region of interest in Figure 1a). Using an analytical model by Mietke et al. (2015), shear forces on the order of 0.5, 1, and 1.5 μN can be calculated for the flow rates above. For every condition, a reference measurement of the initial cell shapes of the population was performed in the reservoir region of the chip (blue region of interest in Figure 1a). Images of cells inside the detection volume were acquired by a high‐speed CMOS camera (MC1362, Mikrotron, Germany), transferred to a standard lab computer via full camera link interface (NI‐1433 frame grabber, National Instruments, Germany) and analyzed in real time using a custom‐written C++/LabView program (Otto et al., 2015). For online data acquisition, the camera was typically run at 2,000 frames · s−1 (fps), monitoring a region of interest (ROI) of 250 × 80 pixels. The analysis algorithm is capable of performing image acquisition, shape detection, analysis, and data storage for up to 1,000 cells · s−1 in real time. The shape of each individual cell was quantified by a parameter c called circularity relating projected surface area A of a cell to its perimeter P:
| (1) |
The circularity is maximal for an ideal circular cell c = 1 and smaller for any deformation (c < 1). For the sake of clarity we introduce the parameter deformation D = 1 − c that increases with the strain of the cells. A typical result of an RT‐DC measurement is illustrated in Figure 1b and Supporting Information, Figure S2a with cell sizes plotted against cell deformation resulting in scatter plots for cell population measured at the rear end of the channel (red 50% density contour line) and in the reservoir region (blue 50% density contour line).
By definition of the deformation D, cell density distributions are skewed toward small values with the boundary 0 (projected histograms in Figure 1b and Supporting Information, Figure S2a). Consequently, a log‐normal function was used to fit the data and to extract the mode deformation value of the distribution that indicates the maximum of the probability‐density function. For dose–response assays, we first characterized the deformation of each cell population by calculating the difference between channel and reservoir mode values to correct for putative drug‐induced morphological preperturbations of the initially spherical cell shapes. Second, we normalized the effect of each treatment condition to the untreated control (exemplary shown in Supporting Information, Figure S2b), resulting in a parameter termed relative deformation RD:
| (2) |
where and are the deformations of treated cells in channel and reservoir, respectively, and and refer to the same measures of the control cells. Assessment of the drug‐induced alterations in the mechanical phenotype of whole‐cell populations was achieved by plotting mean RD values versus the drug concentration, each comprising at least three repetitions on several days with at least 2,000 cells per condition. By definition of RD, each data point in one of our dose–response titration curves is the weighted result of at least 24,000 single‐cell events.
4.7. Statistical data analysis
Assessment of the significance of the effects observed in our dose–response assays was challenging due to the skewed nature of the obtained deformation distributions (Figure 1b and Supporting Information, Figure S2a,b). This impeded the application of a standard t‐test on RT‐DC data, as it requires normally distributed sets of random variables. On the other hand, by limiting data processing to mode values only as described above, information about the heterogeneity and spread of the distribution, which might incorporate important biological features, would have been lost.
To overcome this, we utilized a resampling approach known as bootstrapping to approximate the sampling distribution of RD values from our original data sets. This sampling distribution meets the requirement of a paired t‐test of the random variable being distributed normally, having similar variances and sample sizes among various data sets. Moreover, the spread and shape of the sampling distribution can directly be linked to the heterogeneity and skew of the measured population (Hesterberg, Moore, Monaghan, Clipson, & Epstein, 2004; Maloney & Van Vliet, 2014; Xavier et al., 2016).
Deformation values of each cell population were resampled 1,000 times with replacement resulting in 1,000 distributions of deformation values, each of equal size and fairly similar, but slightly different to the initial data set. The idea behind this is that every measured sample is an estimate of the underlying population the sample was drawn from. The quality of this estimate of course scales with the size of the measured sample.
Differences among several samples drawn from the very same population should occur due to random sampling only. Consequently resampling with replacement from a sufficiently large set of experimental data is a very time effective way of generating numerous estimates of the underlying population distribution without having to repeat the same experiment 1,000 times (which even with RT‐DC would be a tedious endeavor).
From each resampled deformation distribution, the mode value was extracted as described above, resulting in 1,000 mode values for each experimental condition. By the central limit theorem, these mode values are normally distributed and peak around the respective population mode value μ (Supporting Information, Figure S2c). Finally, we calculated relative deformation (RD) values from the obtained mode values for each resampling iteration, giving rise to a normal RD‐distribution (Supporting Information, Figure S2d). This distribution could now be tested against the null hypothesis H 0 that a similar experiment would have reproduced the effect we observed due to random sampling only. The possibility β of H 0 being true is given by the number of events lying on the opposite side of the control value than the observed effect, divided by the total number of events. As these events would not trigger the rejection of H 0, their fraction of the total distribution determines the significance of the observed effect. If the fraction β is below a set confidence threshold α, H 0 is rejected stating the significance of the observed effect. p values are calculated accordingly, representing (*) a p ≤ 0.05, (**) a p ≤ 0.01, and (***) a p 0.001 chance of falsely rejecting the null hypothesis.
Supporting information
Supporting Information Figures.
ACKNOWLEDGMENTS
This work was financially supported by the Alexander von Humboldt Stiftung (Alexander von Humboldt Professorship to Jochen Guck), the Sächsische Ministerium für Wissenschaft und Kunst (TG 70 grant to Oliver Otto and Jochen Guck), and the Bundesministerium für Bildung und Forschung (ZIK grant to Oliver Otto under grant no. 03Z22CN11). The authors thank Salvatore Girardo of the BIOTEC/CRTD Microstructure Facility (partly funded by the State of Saxony and the European Fund for Regional Development ‐ EFRE) for producing the silicon masters of the microfluidic chips, Donald and Ada Olins for providing the HL‐60 cell line, Karl Hoffmann for discussions about the fitting algorithm, and Jörg Mansfeld for providing the Paclitaxel utilized in this study. The authors acknowledge support from Elke Ulbricht for guidance with the fluorescence staining, Anna Taubenberger and Angela Jacobi for their help with the viability assays, and Chii (Joseph) Chan for general assistance with the drug treatment assays. The authors finally thank the Guck Lab for a warm and open‐minded atmosphere of scientific prosperity.
CONFLICT OF INTEREST
Philipp Rosendahl and Oliver Otto are the co‐founders and Oliver Otto is the CEO of ZELLMECHANIK DRESDEN GmbH commercializing real‐time deformability cytometry.
Golfier S., Rosendahl P., Mietke A., Herbig M., Guck J., Otto O. High‐throughput cell mechanical phenotyping for label‐free titration assays of cytoskeletal modifications. Cytoskeleton. 2017;74:283–296. https://doi.org/10.1002/cm.21369
Funding information Alexander von Humboldt‐Foundation; Sächsische Ministerium für Wissenschaft und Kunst, Grant/Award Number: TG 70; Bundesministerium für Bildung und Forschung, Grant/Award Number: 03Z22CN11
REFERENCES
- Alberts, B. , Johnson, A. , Lewis, J. , Raff, M. , Roberts, K. , Walter, P. , … Hunt, T. (2008). Molecular biology of the cell. New York: Garland Science. [Google Scholar]
- Ananthakrishnan, R. , Guck, J. , Wottawah, F. , Schinkinger, S. , Lincoln, B. , Romeyke, M. , … Käs, J. A. (2006). Quantifying the contribution of actin networks to the elastic strength of fibroblasts. Journal of Theoretical Biology, 242, 502–516. [DOI] [PubMed] [Google Scholar]
- Anderson, H. J. , Coleman, J. E. , Andersen, R. J. , & Roberge, M. (1997). Cytotoxic peptides hemiasterlin, hemiasterlin A and hemiasterlin B induce mitotic arrest and abnormal spindle formation. Cancer Chemotherapy Pharmacology, 39, 223–226. [DOI] [PubMed] [Google Scholar]
- Brangwynne, C. P. , MacKintosh, F. C. , Kumar, S. , Geisse, N. A. , Talbot, J. , … Weitz D. A. (2006). Microtubules can bear enhanced compressive loads in living cells because of lateral reinforcement. Journal of Cell Biology, 173, 733–741. [DOI] [PMC free article] [PubMed] [Google Scholar]
- Brown, S. S. , & Spudich, J. A. (1979). Cytochalasin inhibits the rate of elongation of actin filament fragment. Rapid Communications, 83, 657–662. [DOI] [PMC free article] [PubMed] [Google Scholar]
- Brugués, J. , Nuzzo, V. , Mazur, E. , & Needleman, D. J. (2012). Nucleation and transport organize microtubules in metaphase spindles. Cell, 149, 554–564. [DOI] [PubMed] [Google Scholar]
- Bubb, M. R. , Senderowicz, A. M. J. , Sausville, E. A. , Duncan, K. L. K. , & Korn, E. D. (1994). Jasplakinolide, a cytotoxic natural product, induces actin polymerization and competitively inhibits the binding of phalloidin to F‐actin. Journal of Biological Chemistry, 269, 14869–14871. [PubMed] [Google Scholar]
- Byun, S. , Son, S. , Amodei, D. , Cermak, N. , Shaw, J. , Kang, J. H. , … Manalis, S. R. (2013). Characterizing deformability and surface friction of cancer cells. Proceedings of the National Academy of Sciences, 110, 7580–7585. [DOI] [PMC free article] [PubMed] [Google Scholar]
- Chalut, K. J. , Höpfler, M. , Lautenschläger, F. , Boyde, L. , Chan, C. J. , Ekpenyong, A. , … Guck, J. (2012). Chromatin decondensation and nuclear softening accompany Nanog downregulation in embryonic stem cells. Biophysical Journal, 103, 2060–2070. [DOI] [PMC free article] [PubMed] [Google Scholar]
- Cooper, J. A. (1987). Effects of cytochalasin and phalloidin on actin. Journal of Cell Biology, 105, 1473–1478. [DOI] [PMC free article] [PubMed] [Google Scholar]
- Cramer, L. (1999). Role of actin‐filament disassembly in lamellipodium protrusion in motile cells revealed using the drug jasplakinolide. Current Opinion in Cell Biology, 19, 1095–1105. [DOI] [PubMed] [Google Scholar]
- Dudani, J. S. , Gossett, D. R. , Tse, H. T. K. , & Di Carlo, D. (2013). Pinched‐flow hydrodynamic stretching of single‐cells. Lab on a Chip, 13, 3728–3734. [DOI] [PubMed] [Google Scholar]
- Ekpenyong, A. E. (2012). Viscoelastic and optical properties of blood stem cells : From differentiation to activation and infection. Cambridge, UK: University of Cambridge. [Google Scholar]
- Ekpenyong, A. E. , Whyte, G. , Chalut, K. , Pagliara, S. , Lautenschläger, F. , Fiddler, C. , … Guck, J. (2012). Viscoelastic properties of differentiating blood cells are fate‐ and function‐dependent. PloS One, 7, 45237. [DOI] [PMC free article] [PubMed] [Google Scholar]
- Fletcher, D. A. , & Mullins, R. D. (2010). Cell mechanics and the cytoskeleton. Nature, 463, 485–492. [DOI] [PMC free article] [PubMed] [Google Scholar]
- Fu, Y. , Chin, L. K. , Bourouina, T. , Liu, A. Q. , & VanDongen, A. M. J. (2012). Nuclear deformation during breast cancer cell transmigration. Lab on a Chip, 12, 3774–3778. [DOI] [PubMed] [Google Scholar]
- Gossett, D. R. , Tse, H. T. K. , Lee, S. A. , Ying, Y. , Lindgren, A. G. , Yang, O. O. , … Di Carlo, D. (2012). Hydrodynamic stretching of single cells for large population mechanical phenotyping. Proceedings of the National Academy of Sciences, 109, 7630–7635. [DOI] [PMC free article] [PubMed] [Google Scholar]
- Guck, J. , & Chilvers, E. R. (2013). Mechanics meets medicine. Science Translational Medicine, 5, 212fs41. [DOI] [PubMed] [Google Scholar]
- Guck, J. , Schinkinger, S. , Lincoln, B. , Wottawah, F. , Ebert, S. , Romeyke, M. , … Bilby, C. (2005). Optical deformability as an inherent cell marker for testing malignant transformation and metastatic competence. Biophysical Journal, 88, 3689–3698. [DOI] [PMC free article] [PubMed] [Google Scholar]
- Hawkins, T. L. , Sept, D. , Mogessie, B. , Straube, A. , & Ross, J. L. (2013). Mechanical properties of doubly stabilized microtubule filaments. Biophysical Journal, 104, 1517–1528. [DOI] [PMC free article] [PubMed] [Google Scholar]
- Hesterberg, T. , Moore, D. S. , Monaghan, S. , Clipson, A. , & Epstein, R. (2004). Bootstrap methods and permutation tests. [Google Scholar]
- Hochmuth, R. M. (2000). Micropipette aspiration of living cells. Journal of Biomechanics, 33, 15–22. [DOI] [PubMed] [Google Scholar]
- Holzinger, A. (2010). Jasplakinolide: An actin‐specific reagent that promotes actin polymerization. Methods in Molecular Biology, 586, 71–87. [DOI] [PubMed] [Google Scholar]
- Ireland, C. M. , Gull, K. , Gutteridge, W. E. , & Pogson, C. I. (1979). The interaction of benzimidazole carbamates with mammalian microtubule protein. Biochemical Pharmacology, 28, 2680–2682. [DOI] [PubMed] [Google Scholar]
- Johnstone, R. W. (2002). Histone‐deacetylase inhibitors: Novel drugs for the treatment of cancer. Nature Reviews. Drug Discovery, 1, 287–299. [DOI] [PubMed] [Google Scholar]
- Jordan, M. A. , Thrower, D. , & Wilson, L. (1992). Effects of vinblastine, podophyllotoxin and nocodazole on mitotic spindles: Implications for the role of microtubule dynamics in mitosis. Journal of Cell Science, 416, 401–416. [DOI] [PubMed] [Google Scholar]
- Jordan, M. A. , Toso, R. J. , Thrower, D. , & Wilson, L. (1993). Mechanism of mitotic block and inhibition of cell proliferation by taxol at low concentrations. Proceedings of the National Academy of Sciences, 90, 9552–9556. [DOI] [PMC free article] [PubMed] [Google Scholar]
- Kasas, S. , Wang, X. , Hirling, H. , Marsault, R. , Huni, B. , Yersin, A. , … Catsicas, S. (2005). Superficial and deep changes of cellular mechanical properties following cytoskeleton disassembly. Cell Motility and the Cytoskeleton, 62, 124–132. [DOI] [PubMed] [Google Scholar]
- Keren, K. , Pincus, Z. , Allen, G. M. , Barnhart, E. L. , Marriott, G. , Mogilner, A. , & Theriot, J. A. (2008). Mechanism of shape determination in motile cells. Nature, 453, 475–480. [DOI] [PMC free article] [PubMed] [Google Scholar]
- Kim, M. , & Rejniak, K. A. (2014). Mechanical aspects of microtubule bundling in taxane‐treated circulating tumor cells. Biophysical Journal, 107, 1236–1246. [DOI] [PMC free article] [PubMed] [Google Scholar]
- Krause, M. , Te Riet, J. , & Wolf, K. (2013). Probing the compressibility of tumor cell nuclei by combined atomic force−confocal microscopy. Physical Biology. [DOI] [PubMed] [Google Scholar]
- Lange, J. R. , Steinwachs, J. , Kolb, T. , Lautscham, L. A. , Harder, I. , Whyte, G. , & Fabry, B. (2015). Microconstriction arrays for high‐throughput quantitative measurements of cell mechanical properties. Biophysical Journal, 109, 26–34. [DOI] [PMC free article] [PubMed] [Google Scholar]
- Lautenschläger, F. (2011). Cytoskeletal origin and importance for cellular function. Cambridge, UK: University of Cambridge. [Google Scholar]
- Lee, L. M. , & Liu, A. P. (2015). A microfluidic pipette array for mechanophenotyping of cancer cells and mechanical gating of mechanosensitive channels. Lab on a Chip, 15, 264–273. [DOI] [PMC free article] [PubMed] [Google Scholar]
- Liebmann, J. E. , Cook, J. A. , Lipschultz, C. , Teague, D. , Fisher, J. , & Mitchell, J. B. (1993). Cytotoxic studies of paclitaxel (Taxol) in human tumour cell lines. British Journal of Cancer, 68, 1104–1109. [DOI] [PMC free article] [PubMed] [Google Scholar]
- Maloney, J. M. , & Van Vliet, K. J. (2014). Chemoenvironmental modulators of fluidity in the suspended biological cell. Soft Matter, 40, 8031–8042. [DOI] [PubMed] [Google Scholar]
- Marupudi, N. I. , Han, J. E. , Li, K. W. , Renard, V. M. , Tyler, B. M. , & Brem H. (2007). Paclitaxel: A review of adverse toxicities and novel delivery strategies. Expert Opinion on Drug Safety, 6, 609–621. [DOI] [PubMed] [Google Scholar]
- May, R. C. , & Machesky, L. M. (2001). Phagocytosis and the actin cytoskeleton. Journal of Cell Science, 114, 1061–1110. [DOI] [PubMed] [Google Scholar]
- Mickey, B. , & Howard, J. (1995). Rigidity of microtubules is increased by stabilizing agents. Journal of Cell Biology, 130, 909–917. [DOI] [PMC free article] [PubMed] [Google Scholar]
- Mietke, A. , Otto, O. , Girardo, S. , Rosendahl, P. , Taubenberger, A. , Golfier, S. , … Fischer‐Friedrich, E. (2015). Extracting cell stiffness from real‐time deformability cytometry: Theory and experiment. Biophysical Journal, 109, 2023–2036. [DOI] [PMC free article] [PubMed] [Google Scholar]
- Murray, D. , Senderowicz, A. M. J. , Kaur, G. , Sainz, E. , Laing, C. , Wayne, D. , … Duncan, K. L. K. (1995). Jasplakinolide's inhibition of the growth of prostate carcinoma cells in vitro with disruption of the actin cytoskeleton. Journal of the National Cancer Institute, 87, 46–51. [DOI] [PubMed] [Google Scholar]
- Nogales, E. , Wolf, S. G. , Khan, I. A. , Luduena, R. F. , & Downing, K. H. (1995). Structure of tubulin at 6.5 A and location of the taxol‐binding site. Nature, 375, 424–427. [DOI] [PubMed] [Google Scholar]
- Otto, O. , Rosendahl, P. , Mietke, A. , Golfier, S. , Herold, C. , Klaue, D. , … Guck, J. (2015). Real‐time deformability cytometry: On‐the‐fly cell mechanical phenotyping. Nature Methods, 12, 199–202. [DOI] [PubMed] [Google Scholar]
- Panagiotakopoulou, M. , Bergert, M. , Taubenberger, A. , Guck, J. , Poulikakos, D. , & Ferrari, A. (2016). A nanoprinted model of interstitial cancer migration reveals a link between cell deformability and proliferation. ACS Nano, 10, 6437–6448. [DOI] [PubMed] [Google Scholar]
- Pollard, T. D. , & Cooper, J. A. (2009). Actin, a central player in cell shape and movement. Science, 326, 1208–1212. [DOI] [PMC free article] [PubMed] [Google Scholar]
- Provenzano, P. P. , & Keely, P. J. (2011). Mechanical signaling through the cytoskeleton regulates cell proliferation by coordinated focal adhesion and Rho GTPase signaling. Journal of Cell Science, 124, 1195–1205. [DOI] [PMC free article] [PubMed] [Google Scholar]
- Qi, D. , Kaur Gill, N. , Santiskulvong, C. , Sifuentes, J. , Dorigo, O. , Rao, J. , … Rowat, A. C. (2015). Screening cell mechanotype by parallel microfiltration. Scientific Reports, 5, 17595. [DOI] [PMC free article] [PubMed] [Google Scholar]
- Rafelski, S. M. , & Theriot, J. A. (2004). Crawling toward a unified model of cell mobility: Spatial and temporal regulation of actin dynamics. Annual Review of Biochemistry, 73, 209–239. [DOI] [PubMed] [Google Scholar]
- Remmerbach, T. W. , Wottawah, F. , Dietrich, J. , Lincoln, B. , Wittekind, C. , & Guck J. (2009). Oral cancer diagnosis by mechanical phenotyping. Cancer Research, 69, 1728–1732. [DOI] [PubMed] [Google Scholar]
- Reynolds, N. H. , Ronan, W. , Dowling, E. P. , Owens, P. , McMeeking, R. M. , & McGarry, J. P. (2014). On the role of the actin cytoskeleton and nucleus in the biomechanical response of spread cells. Biomaterials, 35, 4015–4025. [DOI] [PubMed] [Google Scholar]
- Rodriguez, O. C. , Schaefer, A. W. , Mandato, C. A. , Forscher, P. , Bement, W. M. , & Waterman‐Storer, C. M. (2003). Conserved microtubule‐actin interactions in cell movement and morphogenesis. Nature Cell Biology, 5, 599–609. [DOI] [PubMed] [Google Scholar]
- Rosenbluth, J. M. , Lam, A. W. , & Fletcher, A. D. (2008). Analyzing cell mechanics in hematologic diseases with microfluidic biophysical flow cytometry. Lab on a Chip, 8, 1062–1070. [DOI] [PMC free article] [PubMed] [Google Scholar]
- Rotsch, C. , & Radmacher, M. (2000). Drug‐induced changes of cytoskeletal structure and mechanics in fibroblasts: An atomic force microscopy study. Biophysical Journal, 78, 520–535. [DOI] [PMC free article] [PubMed] [Google Scholar]
- Salbreux, G. , Charras, G. , & Paluch, E. (2012). Actin cortex mechanics and cellular morphogenesis. Trends in Cell Biology, 22, 536–545. [DOI] [PubMed] [Google Scholar]
- Schiff, P. B. , Fant, J. , & Horwitz, S. B. (1979). Promotion of microtubule assembly in vitro by taxol. Nature, 277, 665– 667. [DOI] [PubMed] [Google Scholar]
- Schulze, C. , Wetzel, F. , Kueper, T. , Malsen, A. , Muhr, G. , Jaspers, S. , … Käs, J. A. (2010). Stiffening of human skin fibroblasts with age. Biophysical Journal, 99, 2434–2442. [DOI] [PMC free article] [PubMed] [Google Scholar]
- Sheikh, S. , Gratzer, W. B. , Pinder, J. C. , & Nash, G. B. (1997). Actin polymerisation regulates integrin‐mediated adhesion as well as rigidity of neutrophils. Biochemical and Biophysical Research Communications, 238, 910–915. [DOI] [PubMed] [Google Scholar]
- Sokolov, I. (2007). Atomic force microscopy in cancer cell research. Cancer nanotechnology (pp. 1–17). [Google Scholar]
- Stamenović, D. (2005). Microtubules may harden or soften cells, depending of the extent of cell distension. Journal of Biomechanics, 38, 1728–1732. [DOI] [PubMed] [Google Scholar]
- Steven, B. (1960). The HL‐60 promyelocytic leukemia cell line: Proliferation, differentiation, and cellular oncogene ex‐ pression. Blood, 70, 1233–1244. [PubMed] [Google Scholar]
- Stevenson, B. R. , & Begg, D. A. (1994). Concentration‐dependent effects of cytochalasin D on tight junctions and actin filaments in MDCK epithelial cells. Journal of Cell Science, 107, 367–375. [DOI] [PubMed] [Google Scholar]
- Suresh, S. (2007). Biomechanics and biophysics of cancer cells. Acta Biomaterialia, 3, 413–438. [DOI] [PMC free article] [PubMed] [Google Scholar]
- Suresh, S. , Spatz, J. , Mills, J. P. , Micoulet, A. , Dao, M. , Lim, C. T. , … Seufferlein, T. (2005). Connections between single‐cell biomechanics and human disease states: Gastrointestinal cancer and malaria. Acta Biomaterialia, 1, 15–30. [DOI] [PubMed] [Google Scholar]
- Taubenberger, A. (2016). A nano‐printed model of interstitial cancer migration reveals a link between cell deformability and proliferation. ACS Nano, 10, 6437–6448. [DOI] [PubMed] [Google Scholar]
- Tsai, M. A. , Waugh, R. E. , & Keng, P. C. (1998). Passive mechanical behavior of human neutrophils: Effects of colchicine and paclitaxel. Biophysical Journal, 74, 3282–3291. [DOI] [PMC free article] [PubMed] [Google Scholar]
- Tse, H. T. K. , Gossett, D. R. , Moon, Y. S. , Masaeli, M. , Sohsman, M. , Ying, Y. , … Di Carlo, D. (2013). Quantitative diagnosis of malignant pleural effusions by single‐cell mechanophenotyping. Science Translational Medicine, 5, 212ra163. [DOI] [PubMed] [Google Scholar]
- Valentine, M. T. , Perlman, Z. E. , Mitchison, T. J. , & Weitz, D. A. (2005). Mechanical properties of Xenopus egg cytoplasmic extracts. Biophysical Journal, 88, 680–709. [DOI] [PMC free article] [PubMed] [Google Scholar]
- Verin, A. D. , Birukova, A. , Wang, P. , Liu, F. , Becker, P. , Birukov, K. , & Garcia, J. G. (2001). Microtubule disassembly increases endothelial cell barrier dysfunction : Role of MLC phosphorylation. American Journal of Physiology Lung Cellular and Molecular Physiology, 281, 565–574. [DOI] [PubMed] [Google Scholar]
- Wakatsuki, T. , Schwab, B. , Thompson, N. C. , & Elson, E. L. (2000). Effects of cytochalasin D and latrunculin B on mechanical properties of cells. Journal of Cell Science, 114, 1025–1036. [DOI] [PubMed] [Google Scholar]
- Wu, H. W. , Kuhn, T. , & Moy, V. T. (1998). Mechanical properties of L929 cells measured by atomic force microscopy: Effects of anticytoskeletal drugs and membrane crosslinking. Scanning, 20, 389–397. [DOI] [PubMed] [Google Scholar]
- Wu, Z. Z. , Zhang, G. , Long, M. , Wang, H. B. , Song, G. B. , & Cai, S. X. (2000). Comparison of the viscoelastic properties of normal hepatocytes and hepatocellular carcinoma cells under cytoskeletal perturbation. Biorheology, 37, 279–290. [PubMed] [Google Scholar]
- Xavier, M. , Rosendahl, P. , Herbig, M. , Kräter, M. , Spencer, D. , Bornhäuser, M. , … Otto, O. (2016). Mechanical phenotyping of primary human skeletal stem cells in heterogeneous populations by real‐time deformability cytometry. Integrative Biology, 8, 616–623. [DOI] [PubMed] [Google Scholar]
- Yoshida, M. , Kijima, M. , Akita, M. , & Beppu, T. (1990). Potent and specific inhibition of mammalian histone deacetylase both in vivo and in vitro by trichostatin A. Journal of Biological Chemistry, 265, 17174–17179. [PubMed] [Google Scholar]
Associated Data
This section collects any data citations, data availability statements, or supplementary materials included in this article.
Supplementary Materials
Supporting Information Figures.