

Abstract
Accumulating evidence demonstrates an association between dense infiltration of lymphocytes and prognosis in colorectal cancer (CRC), but whether this prognostic impact differs by tumour location remains unknown. This study investigated the prognostic impact of cytotoxic and regulatory T cells in CRC, with particular reference to the anatomical subsite of the primary tumour. The density of CD3+, CD8+ and FoxP3+ tumour‐infiltrating T cells was calculated in tissue microarrays with tumours from 557 incident CRC cases from a prospective population‐based cohort. Kaplan–Meier and Cox regression analyses were applied to determine the impact of high and low lymphocyte density on 5‐year overall survival, in subgroup analysis of right colon, left colon and rectum. High CD8+ cell density was a favourable prognostic factor for patients with right‐sided colon tumours (hazard ratio [HR]=0.53, 95% confidence interval [CI] 0.29–0.95), independent of age, sex, TNM stage, differentiation grade and vascular invasion, with a significant prognostic interaction between CD8+ cells and right‐sidedness (p = 0.031). High FoxP3+ cell density was an independent favourable prognostic factor only in patients with rectal tumours (HR = 0.54, 95% CI 0.30‐0.99), and CD3+ cell density was an independent favourable prognostic factor for tumours in the right colon and rectum, but there was no significant prognostic interaction between CD3+ or FoxP3+ cells and sidedness. These results demonstrate that the prognostic impact of tumour‐infiltrating lymphocytes in CRC differs by primary tumour site, further indicating that tumour location may be an important factor to take into consideration in therapeutic decisions, including eligibility for immunotherapy.
Keywords: T cells, colorectal cancer, tumour location, sidedness, prognosis
Short abstract
What's new?
In colorectal cancer, elevated levels of tumor‐infiltrating lymphocytes in the tumor and its microenvironment are associated with improved survival. Whether this prognostic benefit differs according to tumor location, however, is unknown. Here, the prognostic impacts of CD3+, CD8+ and FoxP3+ tumor‐infiltrating T cells were examined with respect to tumor location. The data link high CD8+ density with favorable prognosis for right‐sided tumors, high FoxP3+ density to improved prognosis for rectal tumors and CD3+ density with improved prognosis for right colon and rectal tumors. Knowledge of variable immune system responses by tumor location could help inform the development of immune‐modulating therapies.
Abbreviations
- CRC
colorectal cancer
- CRT
classification and regression tree
- HR
hazard ratio
- IHC
immunohistochemical
- MDCS
Malmö Diet and Cancer Study
- OS
overall survival
- TMA
tissue microarray
- Treg
regulatory T cells
With approximately 1.4 million new cases every year, colorectal cancer (CRC) is the third most common cancer globally.1 Despite advances in treatment, CRC is still the third leading cause of cancer‐related death and therefore, there is an urgent need to identify novel prognostic and predictive biomarkers.
Immuno‐oncology is a rapidly emerging field that has elicited promise in cancer therapy. High levels of tumour‐infiltrating (CD3+) T cells and cytotoxic (CD8+) T cells have been associated with auspicious clinical outcome in CRC,2, 3, 4, 5, 6, 7, 8, 9 occasionally outsmarting traditional tumour characteristics in predicating prognosis.7, 10 Paradoxically, high infiltration of FoxP3+ regulatory T cells (Tregs), suppressing effector function of cytotoxic T cells, correlates with a dismal prognosis in numerous other cancers,11 but is reported as a favourable prognostic factor in CRC.12, 13, 14, 15
Increasing evidence suggests that CRC should be considered as a heterogeneous disease, with proximal and distal CRCs showing multiple clinicopathological and molecular distinctions, including the density of some immune cells.16 However, to the best of our knowledge, no studies have hitherto investigated whether the prognostic significance of immune cell infiltration differs by primary tumour location. Therefore, the aim of this study was to examine the clinicopathological and molecular correlates and prognostic significance of the density of CD3+, CD8+ and FoxP3+ T cells in CRC, with particular reference to the anatomical subsite of the primary tumour. Reanalysis of the prognostic value of previously investigated CD20+ B cells and CD138+ and IGKC+ plasma cells17 according to primary tumour subsite was also performed.
Methods
Patients
The study cohort consists of all incident cases of CRC in the Malmö Diet and Cancer Study (MDCS) from 1991 up until December 31, 2008 (n = 626). The MDCS is a prospective population‐based cohort with the primary aim to investigate associations between various dietary factors and cancer incidence.18 The project, including nonparticipants in the European Prospective Investigation into Cancer (EPIC) cohort, enrolled 18,326 women (60.2%) and 12,120 (39.8%) men, with a total of 30,446 participants (from a background population of 74,138).
Information on CRC incidence was obtained through the Swedish Cancer Registry up until December 31, 2007, and from The Southern Swedish Regional Tumour Registry for the period of January 1, 2008–December 31, 2008. Clinical and treatment data were obtained from medical charts. Histopathological data were obtained from pathology records. TNM staging was performed according to the American Joint Committee on Cancer. Right colon was defined as appendix, caecum, ascending and 2/3 of transverse colon, whereas left colon was defined as the left colic flexure, descending and sigmoid colon, corresponding to the midgut fetal origin versus the hindgut as well as different innervation and blood supply.
Median age at diagnosis was 71 (range 50–86) years. Information on vital status and cause of death was obtained from the Swedish Cause of Death Registry up until December 31, 2013. Follow‐up began at CRC diagnosis and ended at death, emigration or December 31, 2013, whichever came first. Median follow‐up time was 5.97 (range 0–21.69) years for the full cohort (n = 626) and 10.05 (range 5.03–21.69) years for patients alive (n = 274). Microsatellite instability (MSI) screening status was assessed by immunohistochemistry as previously described,19 and KRAS and BRAF mutation status was determined by pyrosequencing as previously described.20
Ethics approval and consent to participate
All EU and national regulations and requirements for handling human samples have been fully complied with during the conduct of this project; that is, decision no. 1110/94/EC of the European Parliament and of the Council (OJL126 18,5,94), the Helsinki Declaration on ethical principles for medical research involving human subjects and the EU Council Convention on human rights and Biomedicine. Ethical permission for the MDCS (LU 90–51) and the present study (LU 530–2008) was obtained from the Ethics Committee at Lund University. Written informed consent has been obtained from each subject at study entry.
Tissue microarray construction
All tumours with available slides or paraffin blocks were histopathologically re‐evaluated on haematoxylin and eosin stained slides by a senior pathologist (KJ). Cases with an insufficient amount of tumour material were excluded, whereby a total number of 557 (89.0%) cases were available for tissue microarray (TMA) construction. Representative and non‐necrotic areas were marked, and TMAs were constructed as previously described.21 In brief, duplicate tissue cores (1 mm) were taken from each primary tumour and mounted in a recipient block, using a semi‐automated arraying device (TMArrayer, Pathology Devices, Westminister, MD). Four µm sections from this block were subsequently cut using a microtome and mounted on glass slides.
Immunohistochemistry
For immunohistochemical (IHC) analysis of CD8 and FoxP3, 4 μm TMA‐sections were pretreated using the PT Link system, and subsequently stained with the anti‐CD8 antibody (clone C8/144B, mouse; dilution, 1:50; product M7103; Dako) and the anti‐FoxP3 antibody (clone236A/E7, mouse, dilution 1:200, Abcam, Cambridge, UK) using the Autostainer Plus (Dako; Glostrup, Denmark).
For IHC analysis of CD3, 4 μm TMA‐sections were pretreated using ULTRA Cell Conditioning Solution 1, pH 8.5 (Ventana Medical Systems Inc., Tucson, AZ) for heat induced epitope retrieval, and stained in a Ventana BenchMark stainer (Ventana Medical Systems) with the anti‐CD3 antibody (clone 2GV6, prediluted, Ventana Medical Systems).
Evaluation of tumour‐infiltrating lymphocytes
The total number of CD3+ and CD8+ lymphocytes in each core was calculated by automated analysis using the colocalization algorithm within the Halo image analysis software (Indica Labs, Corrales, NM). Automated analysis of FoxP3 was not possible to undertake due to concomitant staining of the stroma, thus, the number of FoxP3 stained lymphocytes was manually counted. A mean value of the two cores was calculated and used in the analyses.
Furthermore, to validate the prognostic impact of the total number of CD3+ and CD8+ lymphocytes, an additional scoring system according to Dahlin et al.22 and Ogino et al.23 was performed. CD3+ and CD8+ lymphocyte infiltration was assessed as no/sporadic (Score 1), moderate (Score 2), abundant (Score 3) and highly abundant infiltration (Score 4) in three locations: (i) intratumoural (within the tumour nest), (ii) tumour‐adjacent (defined as within one tumour cell diameter of the tumour) and (iii) within the distant stroma (defined as more than one tumour cell diameter away from the tumour). A total score for both CD3 and CD8 was calculated as the sum of the scores intratumourally, tumour‐adjacent and within the distant stroma, generating a total score (lymphocytic reaction score) ranging from 3 to 12. A mean value of the total score from each core was calculated and used in the analysis. As FoxP3 was only sporadically expressed intratumourally and within the adjacent stroma, analysis according to lymphocytic reaction score was not meaningful.
Statistical analysis
Unadjusted nonparametric test was used to evaluate associations between infiltration of CD3+, CD8+ and FoxP3+ cells and established clinicopathological characteristics and other investigative biomarkers. Spearmans Rho test was used to analyse the interrelationship between CD3+, CD8+ and FoxP3+ cells. Classification and regression tree (CRT) analysis was used to determine the optimal prognostic cut‐off for dichotomisation into high and low infiltration of CD3+, CD8+ and FoxP3+ cells. Kaplan–Meier analysis and log rank test were applied to illustrate differences in five‐year overall survival (OS) with respect to immune cell density. Cox regression proportional hazard models were used to estimate hazard ratios (HRs) for death from CRC in both univariable and multivariable analysis, adjusted for age, sex, T‐stage, N‐stage, M‐stage, differentiation grade and vascular invasion.
The proportional hazard assumption was tested using Cox regression with a time‐dependent covariate analysis, whereby the proportional hazard assumption was considered to be satisfied when the factor × time interaction was non‐significant.
To estimate the interaction effect between tumour location and lymphocyte density, an interaction variable was constructed with tumour location (right/other, left/other or rectal/other, respectively) × lymphocyte density (low/high).
All calculations were performed using SPSS version 24.0 (SPSS, Chicago, IL). All statistical tests were two‐sided and p‐values < 0.05 were considered statistically significant.
Results
Associations of CD3+, CD8+ and FoxP3+ lymphocyte count with clinicopathological factors according to primary tumour site
Information on tumour location was available for 555 (99.6%) cases in the TMA, with 201 (36.1%) right‐sided colon tumours, 145 (26.0%) left‐sided colon tumours and 209 (37.5%) rectal tumours.
Immune cell‐specific CD3+ lymphocyte count could be determined in 530 (95.2%) cases, and CD8+ lymphocyte count in 539 (96.8%) cases. FoxP3+ lymphocyte count was assessable in 547 (98.2%) cases. Sample IHC images are shown in Figure 1.
Figure 1.
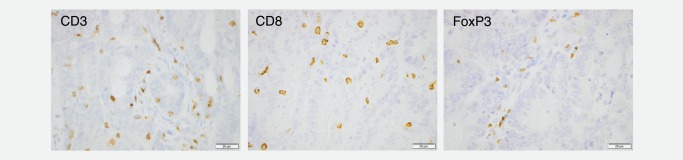
Immunohistochemical images of CD3, CD8 and FoxP3 staining in colorectal cancer. Sample images (10x magnification) representing immunohistochemical expression of CD3, CD8 and FoxP3 in colorectal cancer.
Associations between CD3+, CD8+ and FoxP3+ lymphocyte count and clinicopathological factors in the entire cohort and by tumour subsite are shown in Tables 1, 2, 3, respectively. In general, high density of all investigated T lymphocyte subsets was associated with more favourable tumour characteristics. The majority of significant associations between high lymphocyte density and favourable clinicopathological factors were seen in the right colon for all types of investigated immune cells. High CD3+, CD8+ and FoxP3+ cell infiltration were all significantly associated with MSI tumours, and only in the right colon. A significantly higher number of CD8+ cells were observed in BRAF mutated tumours in the entire cohort, but not according to tumour subsite. No significant associations were observed between immune cell density and KRAS mutation status.
Table 1.
Associations between CD3+ cell infiltration and clinicopathological and investigative factors stratified by primary tumour location
| Entire cohort | Right colon | Left colon | Rectum | |||||||||
|---|---|---|---|---|---|---|---|---|---|---|---|---|
| Factor | Median (range) | p‐value | n | Median (range) | p‐value | n | Median (range) | p‐value | n | Median (range) | p‐value | n |
| Age | ||||||||||||
| < 75 | 134.00 (0.00–1,758.50) | 369 | 276.00 (2.50–1,587.00) | 110 | 237.75 (0.00–1,758.50) | 104 | 213.50 (139.00–543.00) | 158 | ||||
| => 75 | 1,275.00 (4.50–2,280.00 | 0.090 | 165 | 278.00 (6.00–2,280.50) | 0.239 | 87 | 246.50 (4.50–974.00) | 0.634 | 36 | 265.75 (0.00–1,147.50) | 0.057 | 42 |
| Sex | ||||||||||||
| Female | 288.50 (0.00–1,758.50) | 283 | 332.50 (9.50–1,675.00) | 110 | 281.00 (10.00–1,758.50) | 75 | 362.25 (13.00–1,158.00) | 97 | ||||
| Male | 252.00 (0.00–2,280.00) | 0.153 | 256 | 253.00 (2.50–2,280.0) | 0.164 | 87 | 230.50 (0.00–886.50) | 0.372 | 64 | 275.00 (0.00–1,077.50) | 0.963 | 103 |
| T‐stage | ||||||||||||
| 1 | 419.25 (57.00–1,675.00) | 48 | 691.00 (154.50–1,675.00 | 9 | 369.75 (110.00–974.00) | 22 | 382.00 (57.00–1,158.00) | 17 | ||||
| 2 | 380.00 (90.00–2,047.50) | 63 | 388.25 (92.50–2,074.50) | 18 | 307.50 (129.50–849.50) | 9 | 405.13 (90.00–950.00) | 36 | ||||
| 3 | 0.00 (0.00–2,280.00) | 325 | 299.00 (2.50–2,280.00) | 121 | 230.25 (0.00–1,758.50) | 88 | 219.50 (0.00–1,147.50) | 115 | ||||
| 4 | 176.00 (0.00–1,283.50) | <0.001** | 80 | 192.50 (6.00–1,283.50) | <0.001 b | 46 | 184.00 (0.00–736.00) | 0.010 | 19 | 83.00 (7.00–566.00) | <0.001 b | 15 |
| N‐stage | ||||||||||||
| 0 | 287.00 (0.00–2,280.00) | 287 | 326.50 (38.50–2,280.00) | 101 | 253.50 (0.00–910.50) | 81 | 295.75 (0.00–1,136.00) | 104 | ||||
| 1 | 214.50 (4.50–1,675.00) | 123 | 263.00 (9.50–1,675.00) | 47 | 207.25 (4.50 (711.50) | 34 | 207.00 (6.50–1,147.50) | 42 | ||||
| 2 | 237.75 (0.00–1,757.50) | 0.019 a | 82 | 247.00 (2.50–1,081.00) | 0.072 | 41 | 230.50 (0.00–1,758.50) | 0.800 | 13 | 257.50 (7.00–910.00) | 0.064 | 28 |
| M‐stage | ||||||||||||
| 0 | 290.50 (0.00–2,280.00) | 441 | 356.50 (9.50–2,280.00) | 157 | 273.50 (0.00–1,758.50) | 113 | 276.00 (0.00–1,158.00) | 170 | ||||
| 1 | 158.00 (0.00–940.50) | <0.001 b | 91 | 130.00 (2.50–940.50) | <0.001 b | 38 | 167.25 (0.00–687.50) | 0.009 a | 26 | 163.00 (7.00–909.00) | 0.190 | 27 |
| Differentiation grade | ||||||||||||
| Low | 273.25 (0.00–2,074.50) | 410 | 126.00 (2.50–2,074.50) | 126 | 259.00 (0.00–1,758.00) | 115 | 272.00 (0.00–1,158.00) | 168 | ||||
| High | 234.75 (6.00–2,280.00) | 0.521 | 118 | 339.00 (6.00–2,280.00) | 0.689 | 68 | 176.50 (18.00–543.00) | 0.047 a | 23 | 234.00 (7.50–909.00) | 0.478 | 27 |
| Mucinous | ||||||||||||
| No | 284.00 (0.00–2,280.00) | 426 | 339.00 (2.50–2,280.00) | 138 | 247.50 (0.00–1,758.50) | 117 | 289.00 (0.00–1,158.00) | 171 | ||||
| Yes | 203.75 (0.00–1,130.00) | 0.004 | 106 | 233.00 (9.50–1,130.00) | 0.010* | 58 | 223.50 (0.00–886.50) | 0.338 | 23 | 162.50 (7.50–910.00) | 0.066 | 24 |
| MSI status | ||||||||||||
| Stable | 273.00 (0.00–1,758.00) | 425 | 252.50 (6.00–1,587.00) | 117 | 259.00 (0.00–1,758.50) | 127 | 290.00 (6.50–1,158.00) | 179 | ||||
| Unstable | 431.33 (33.00–2,280.00) | <0.001 | 74 | 490.75 (33.00–2,280.00) | <0.001 b | 68 | 145.75 (45.50–291.00) | 0.010 | 4 | 351.75 (124.00–579.50) | 0.983 | 2 |
| KRAS | ||||||||||||
| Wild‐type | 279.50 (0.00–2,074.50) | 322 | 323.00 (9.50–2,074.50) | 114 | 234.50 (0.00–1,758.50) | 78 | 290.00 (6.50–1,158.00) | 127 | ||||
| Mutated | 229.00 (0.00–1,587.00) | 0.111 | 186 | 241.25 (2.50–1,587.00) | 0.095 | 68 | 244.75 (0.00–886.50) | 0.946 | 56 | 209.75 (0.00–950.00) | 0.510 | 62 |
| BRAF | ||||||||||||
| Wild‐type | 269.00 (0.00–1,758.00) | 431 | 269.50 (2.50–1,587.00) | 116 | 242.00 (0.00–1,758.50) | 129 | 276.26 (0.00–1,158.00) | 186 | ||||
| Mutated | 283.00 (9.50–2,074.50) | 0.369 | 76 | 299.00 (9.50–2,074.50) | 0.699 | 67 | 213.50 (139.00–543.00) | 0.986 | 5 | 124.00 (14.00–234.00) | 0.236 | 2 |
| Tumour location | ||||||||||||
| Right | 278.00 (2.50–2,280.00) | 197 | ||||||||||
| Left | 243.75 (0.00–1,758.50) | 140 | ||||||||||
| Rectum | 275.00 (0.00–1,158.00) | 0.342 | 200 | |||||||||
Significance at the 5% level.
Significance at the 1% level. The analysis of CD3+ cell infiltration was based on total lymphocyte count.
Abbreviations: MSI: microsatellite instability.
Table 2.
Associations between CD8+ cell infiltration and clinicopathological and investigative factors stratified by primary tumour location
| Entire cohort | Right colon | Left colon | Rectum | |||||||||
|---|---|---|---|---|---|---|---|---|---|---|---|---|
| Factor | Median (range) | p‐value | n | Median (range) | p‐value | n | Median (range) | p‐value | n | Median (range) | p‐value | n |
| Age | ||||||||||||
| 75 | 266.75 (0.00–1,758.50) | 369 | 176.00 (1.50–1,130.50) | 109 | 129.50 (6.50–970.00) | 103 | 125.00 (0.00–992.00) | 155 | ||||
| => 75 | 131.00 (1.00–2,125.50) | 0.455 | 161 | 153.50 (2.00–2,125.50) | 0.239 | 83 | 102.50 (2.00–685.50) | 0.138 | 38 | 142.00 (1.00–1,093.00) | 0.402 | 40 |
| Sex | ||||||||||||
| Female | 136.00 (0.00–1,683.50) | 282 | 173.75 (1.50–1,683.50) | 110 | 128.00 (2.00–970.00) | 77 | 120.75 (0.00–1,093.00) | 94 | ||||
| Male | 132.50 (0.00–2,125.50) | 0.365 | 248 | 158.25 (2.00–2,125.50) | 0.590 | 82 | 104.25 (3.00–834.50) | 0.093 | 64 | 134.00 (0.00–875.00) | 0.489 | 101 |
| T‐stage | ||||||||||||
| 1 | 231.00 (26.00 −1,416.00) | 47 | 412.75 (165.00–1,416.00) | 8 | 199.50 (49.50–685.50) | 22 | 172.00 (26.00–929.50) | 17 | ||||
| 2 | 155.25 (10.00–2,125.50) | 64 | 246.00 (12.50–2,125.50) | 18 | 62.00 (10.00–210.00) | 9 | 162.00 (20.00–626.50) | 37 | ||||
| 3 | 129.75 (0.00–1,683.50) | 320 | 187.50 (5.50–1,683.50) | 119 | 121.50 (3.00–970.00) | 89 | 116.00 (0.00–992.00) | 111 | ||||
| 4 | 91.00 (1.00–1,016.50) | <0.001 b | 79 | 116.00 (1.50–1,016.50) | 0.002 a | 45 | 125.00 (2.00–480.50) | 0.035 | 19 | 42.50 (1.00–350.00) | <0.001 b | 15 |
| N‐stage | ||||||||||||
| 0 | 138.00 (2.00–2,125.50) | 283 | 163.00 (10.00–2,125.50) | 99 | 113.50 (2.00–834.50) | 82 | 138.00 (2.00–992.00) | 101 | ||||
| 1 | 105.20 (0.00–1,416.00) | 122 | 176.00 (4.00–1,416.00) | 45 | 123.25 (3.00–399.00) | 34 | 76.50 (0.00–498.00) | 43 | ||||
| 2 | 128.00 (0.00 −970.00) | 0.026 a | 79 | 177.00 (1.50–940.00) | 0.285 | 39 | 79.50 (32.00–970.00) | 0.823 | 13 | 128.00 (0.00–824.00) | 0.012 | 27 |
| M‐stage | ||||||||||||
| 0 | 139.00 (0.00–2,125.50) | 440 | 187.50 (6.00–2,125.50) | 155 | 128.00 (2.00–970.00) | 115 | 125.00 (0.00–992.00) | 169 | ||||
| 1 | 101.00 (1.00–1,093.00) | 0.004 a | 83 | 101.50 (1.50–757.50) | 0.001 b | 35 | 71.00 (24.50–793.50) | 0.073 | 25 | 151.00 (1.00–1,093.00) | 0.994 | 23 |
| Differentiation grade | ||||||||||||
| Low | 134.25 (0.00 −2,125.50) | 404 | 163.00 (8.00–2,125.50) | 126 | 125.00 (2.00–970.00) | 117 | 130.00 (0.00–1,093.00) | 165 | ||||
| High | 125.75 (1.50–1,646.50) | 0.835 | 116 | 213.50 (1.50–1,646.50) | 0.687 | 68 | 106.50 (32.50–390.50) | 0.929 | 22 | 90.75 (4.00–647.00) | 0.099 | 26 |
| Mucinous | ||||||||||||
| No | 134.25 (0.00–2,125.50) | 418 | 193.75 (1.50–2,125.50) | 134 | 126.00 (2.00–970.00) | 118 | 125.25 (0.00–1,093.00) | 166 | ||||
| Yes | 120.75 (4.00–932.00) | 0.618 | 104 | 117.00 (8.00–932.00) | 0.052 | 57 | 109.50 (6.50–483.00) | 0.836 | 23 | 151.00 (4.00–824.00) | 0.861 | 23 |
| MSI status | ||||||||||||
| Stable | 129.00 (0.00–1,130.50) | 418 | 126.25 (1.50–1,130.50) | 114 | 128.75 (2.00–970.00) | 128 | 129.00 (0.00–1,093.00) | 174 | ||||
| Unstable | 305.00 (13.00–2,125.50) | <0.001 b | 75 | 312.75 (13.00–2,125.50) | <0.001 b | 68 | 95.25 (52.00–191.00) | 0.515 | 4 | 571.00 (106–984.50) | 0.084 | 3 |
| KRAS | ||||||||||||
| Wild‐type | 140.00 (0.00–2,125.50) | 317 | 171.50 (1.50–2,125.50) | 113 | 114.00 (10.00–970.00) | 79 | 125.00 (0.00–984.50) | 123 | ||||
| Mutated | 127.25 (1.00–2,230.50) | 0.481 | 182 | 128.50 (2.00–2,230.50) | 0.198 | 65 | 125.25 (2.00–834.50) | 0.933 | 56 | 128.00 (1.00–1,093.00) | 0.702 | 61 |
| BRAF | ||||||||||||
| Wild‐type | 128.00 (0.00–1,683.50) | 423 | 147.00 (2.00–1,683.50) | 111 | 124.50 (2.00–970.00) | 130 | 126.75 (0.00–1,093.00) | 182 | ||||
| Mutated | 171.50 (1.50–2,125.50) | 0.049 a | 75 | 176.00 (1.50–2,125.50) | 0.530 | 67 | 109.50 (79.50–390.50) | 0.930 | 5 | 16.00 (16.00–16.00) | 0.109 | 1 |
| Tumour location | ||||||||||||
| Right | 168.25 (1.50–2,125.50) | 192 | ||||||||||
| Left | 243.75 (0.00–1,758.50) | 141 | ||||||||||
| Rectum | 275.00 (0.00–1,158.000) | 0.004 a | 195 | |||||||||
Significance at the 5% level.
Significance at the 1% level.
The analysis of CD8+ cell infiltration was based on total lymphocyte count.
Abbreviations: MSI: microsatellite instability.
Table 3.
Associations between FoxP3+ cell infiltration and clinicopathological and investigative factors stratified by primary tumour location
| Entire cohort | Right colon | Left colon | Rectum | |||||||||
|---|---|---|---|---|---|---|---|---|---|---|---|---|
| Factor | Median (range) | p‐value | n | Median (range) | p‐value | n | Median (range) | p‐value | n | Median (range) | p‐value | n |
| Age | ||||||||||||
| < 75 | 6.00 (0.00–128.00) | 375 | 6.50 (0.00–100.00) | 108 | 5.50 (0.00–101.00) | 105 | 6.00 (0.00–128.00) | 160 | ||||
| => 75 | 11.50 (0.00–140.00) | 0.002 a | 172 | 13.50 (0.00–116.00) | 0.022 a | 87 | 8.50 (0.00–140.00) | 0.499 | 39 | 10.25 (0.00–73.50) | 0.108 | 46 |
| Sex | ||||||||||||
| Female | 8.00 (0.00–140.00) | 286 | 10.00 (0.00–116.00) | 109 | 7.50 (0.00–140.00) | 77 | 7.00 (0.00–128.00) | 99 | ||||
| Male | 7.00 (0.00–109.00) | 0.425 | 261 | 8.75 (0.00–98.00) | 0.445 | 86 | 5.00 (0.00–69.00) | 0.995 | 67 | 7.00 (0.00–109.00) | 0.490 | 107 |
| T‐stage | ||||||||||||
| 1 | 13.50 (0.00–140.00) | 48 | 10.00 (0.00–116.00) | 9 | 9.00 (0.00–140.00) | 22 | 28.00 (0.00–86.00) | 17 | ||||
| 2 | 19.50 (0.00–92.00) | 64 | 29.00 (0.00–80.00) | 18 | 30.00 (2.00–92.00) | 9 | 11.00 (0.00–89.00) | 37 | ||||
| 3 | 8.00 (0.00–109.00) | 330 | 12.67 (0.00–100.00) | 119 | 5.50 (0.00–94.00) | 91 | 5.00 (0.00–109.00) | 119 | ||||
| 4 | 2.00 (0.00–108.00) | <0.001 b | 81 | 2.50 (0.00–108.00) | 0.016 a | 46 | 0.75 (0.00–23.00) | 0.003 a | 20 | 0.00 (0.00–41.50) | 0.002 a | 15 |
| N‐stage | ||||||||||||
| 0 | 9 (0.00–140.00) | 290 | 13.25 (0.00–102.00) | 98 | 5.75 (0.00–140.00) | 84 | 6.50 (0.00–128.00) | 107 | ||||
| 1 | 8.00 (0.00–116.00) | 124 | 12.00 (0.00–116.00) | 46 | 6.50 (0.00–94.00) | 34 | 6.50 (0.00–109.00) | 44 | ||||
| 2 | 3.00 (0.00–57.00) | 0.027 a | 84 | 4.75 (0.00–41.50) | 0.086 | 42 | 3.25 (0.00–39.50) | 0.623 | 14 | 1.50 (0.00–57.00) | 0.147 | 28 |
| M‐stage | ||||||||||||
| 0 | 9.00 (0.00–140.00) | 446 | 13.00 (0.00–116.00) | 154 | 8.00 (0.00–140.00) | 116 | 8.00 (0.00–128.00) | 175 | ||||
| 1 | 2.00 (0.00–108.00) | <0.001 b | 94 | 2.00 (0.00–108.00) | 0.001 b | 39 | 2.50 (0.00–64.00) | 0.055 | 27 | 1.50 (0.00–95.00) | 0.142 | 28 |
| Differentiation grade | ||||||||||||
| Low | 8.50 (0.00–140.00) | 415 | 12.00 (0.00–102.00) | 123 | 8.00 (0.00–140.00) | 115 | 8.00 (0.00–128.00) | 172 | ||||
| High | 5.00 (0.00–116.00) | 0.172 | 121 | 6.50 (0.00–116.00) | 0.388 | 69 | 2.50 (0.00–94.00) | 0.192 | 23 | 4.00 (0.00–107.00) | 0.246 | 29 |
| Mucinous | ||||||||||||
| No | 9.00 (0.00–140.00 | 433 | 13.50 (0.00–116.00) | 137 | 8.00 (0.00–140.00) | 121 | 7.00 (0.00–128.00) | 175 | ||||
| Yes | 4.75 (0.00–82.00) | 0.012 a | 106 | 5.00 (0.00–82.00) | 0.004 a | 57 | 1.50 (0.00–64.00) | 0.030 a | 23 | 9.00 (0.00–57.00) | 0.951 | 25 |
| MSI status | ||||||||||||
| Stable | 8.00 (0.00–140.00) | 432 | 8.00 (0.00–108.00) | 116 | 8.00 (0.00–140.00) | 131 | 8.00 (0.00–128.00) | 183 | ||||
| Unstable | 14.75 (0.00–116.00) | 0.010 a | 74 | 15.50 (0.00–116.00) | 0.012 a | 67 | 19.00 (0.00–30.00) | 0.619 | 4 | 0.00 (0.00–0.50) | 0.056 | 3 |
| KRAS | ||||||||||||
| Wild‐type | 8.00 (0.00–140.00) | 328 | 8.50 (0.00–116.00) | 114 | 5.50 (0.00–140.00) | 80 | 8.50 (0.00–107.00) | 132 | ||||
| Mutated | 7.00 (0.00–109.00) | 0.336 | 187 | 10.75 (0.00–100.00) | 0.410 | 66 | 7.50 (0.00–72.00) | 0.946 | 58 | 6.00 (0.00–109.00) | 0.475 | 63 |
| BRAF | ||||||||||||
| Wild‐type | 7.50 (0.00–140.00) | 437 | 10.75 (0.00–108.00) | 112 | 5.50 (0.00–140.00) | 133 | 8.00 (0.00–109.00) | 192 | ||||
| Mutated | 8.50 (0.00–116.00) | 0.145 | 77 | 8.25 (0.00–116.00) | 0.680 | 68 | 24.00 (0.00–94.00) | 0.167 | 5 | 4.25 (4.00–4.50) | 0.745 | 2 |
| Tumour location | ||||||||||||
| Right | 9.00 (0.00–116.00) | 195 | ||||||||||
| Left | 5.75 (0.00–140.00) | 144 | ||||||||||
| Rectum | 7.00 (0.00–128.00) | 0.185 | 206 | |||||||||
Significance at the 5% level.
Significance at the 1% level.
The analysis of FoxP3+ cell infiltration was based on total lymphocyte count.
Abbreviations: MSI: microsatellite instability.
The clinicopathological correlates of CD20+ B cells, and CD138+ and IGKC+ plasma cells in the full cohort have been described previously17, and was, similar to the T lymphocytes, found to be associated with more favourable tumour characteristics. Corresponding analyses according to tumour subsite for these lymphocytes are shown in Supporting Information Tables 1–3. In general, fewer significant associations with clinicopathological factors were observed for B cells and plasma cells than for T cells, and only the density of IGKC+ plasma cells was significantly higher in MSI right‐sided tumours.
There were moderate to very strong intercorrelations between all investigated T‐ and B‐lymphocytes, and plasma cells (Supporting Information Table 4).
Prognostic significance of CD3+, CD8+ and FoxP3+ cell infiltration
For the entire cohort, CRT analysis established an optimal cut‐off point for CD3+ lymphocyte count at ≤ 292.75, which was used to stratify cases into groups of low (≤292.75, n = 338) and high (>292.75, n = 203) count. Similarly, CD8+ lymphocyte count was dichotomised into groups of low (≤33.5, n = 77) and high (>33.50, n = 453) lymphocyte count. For FoxP3+ lymphocyte count, cases were divided into groups of low (≤9.25, n = 300) and high (>9.25, n = 247) count. Finally, according to the total CD3 and CD8 score, respectively, patients were divided into three groups of equal size with low (3–4), intermediate (5–6), or high (7–12) total score.
In the entire cohort, Kaplan–Meier analysis revealed significant correlations between all investigated T cell subsets and a prolonged 5‐year OS (p = 0.001 for CD3+ and CD8+, and p = 0.006 for FoxP3+, Supporting Information Fig. 1). Kaplan–Meier estimates of 5‐year OS according to tumour subsite are shown in Figure 2. The prognostic impact of the pan T cell marker CD3 was stepwise decreased from the right colon (p = 0.001, Fig. 2 a), left colon (p = 0.036, Fig. 2 b), to the rectum (p = 0.051, Fig. 2 c). High density of CD8+ cells was significantly associated with a prolonged 5‐year OS in right‐sided tumours (p < 0.001, Fig. 2 d), but was not prognostic in the left colon or in the rectum (Figs. 2 e and 2 f). FoxP3+ cells were not prognostic in either subsite (Figs. 2 g–2i).
Figure 2.
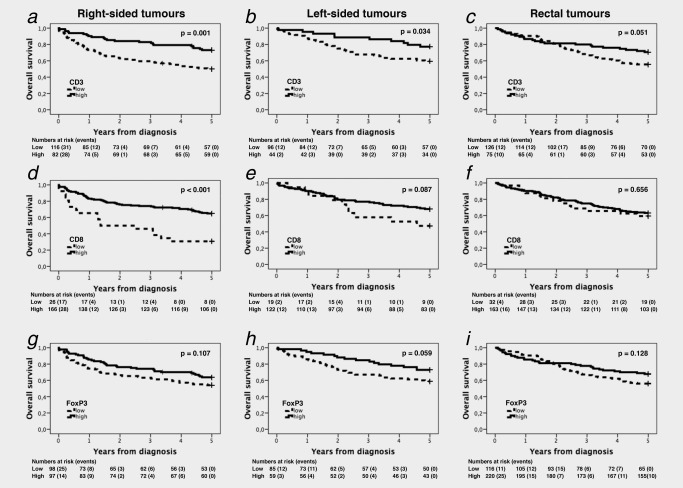
Kaplan–Meier estimates of overall survival according to CD3+, CD8+ and FoxP3+ cell infiltration and primary tumour location. Kaplan–Meier analysis of 5‐year overall survival in strata of low and high CD3+ (a, b, c), CD8+ (d, e, f) and FoxP3+ (g, h, i) lymphocyte infiltration in right‐sided (first row), left‐sided (second row) and rectal (third row) tumours.
Cox proportional hazards analyses of 5‐year OS according to lymphocyte density and tumour subsite are shown in Table 4. The time‐dependent covariate was non‐significant for all investigated T cell subsets, and therefore, the factor × time interaction term was dropped from the model. The proportional hazard assumption was also considered to be satisfied with graphical evaluation using log‐minus‐log plots (data not shown).
Table 4.
Cox proportional hazards models for 5‐year overall survival in relation to CD3+, CD8+ and FoxP3+ cell infiltration
| Entire cohort | Right colon | Left colon | Rectum | |||||||||
|---|---|---|---|---|---|---|---|---|---|---|---|---|
| HR (95% CI) | p‐value | n (deaths) | HR (95% CI) | p‐value | n (deaths) | HR (95% CI) | p‐value | n (deaths) | HR (95% CI) | p‐value | n (deaths) | |
| Univariable | ||||||||||||
| CD3 | ||||||||||||
| Low | 1.00 | 335 (152) | 1.00 | 116 (58) | 1.00 | 96 (39) | 1.00 | 126 (56) | ||||
| High | 0.51 (0.37–0.70) | <0.001 b | 203 (54) | 0.43 (0.27–0.71) | 0.001 a | 82 (22) | 0.48 (0.24–0.96) | 0.038 a | 44 (10) | 0.62 (0.38–1.01) | 0.053 | 75 (22) |
| CD8 | ||||||||||||
| Low | 1.00 | 77 (41) | 1.00 | 26 (18) | 1.00 | 19 (10) | 1.00 | 32 (13) | ||||
| High | 0.56 (0.40–0.79) | 0.001 a | 452 (157) | 0.35 (0.21–0.60) | <0.001 b | 166 (58) | 0.55 (0.27–1.10) | 0.092 | 122 (39) | 0.83 (0.48–1.59) | 0.656 | 163 (60) |
| FoxP3 | ||||||||||||
| Low | 1.00 | 299 (131) | 1.00 | 98 (45) | 1.00 | 85 (35) | 1.00 | 116 (51) | ||||
| High | 0.68 (0.51–0.90) | 0.006 a | 257 (80) | 0.70 (0.49–1.08) | 0.109 | 97 (35) | 0.57 (0.32–1.03) | 0.063 | 59 (16) | 0.70 (0.45–1.11) | 0.130 | 90 (29) |
| Multivariable | ||||||||||||
| CD3 | ||||||||||||
| Low | 1.00 | 306 (132) | 1.00 | 106 (49) | 1.00 | 91 (37) | 1.00 | 109 (46) | ||||
| High | 0.47 (0.33–0.69) | <0.001 b | 176 (40) | 0.53 (0.29–0.95) | 0.033 a | 78 (20) | 0.50 (0.21–1.19) | 0.117 | 36 (7) | 0.45 (0.22–0.94) | 0.033 a | 61 (13) |
| CD8 | ||||||||||||
| Low | 1.00 | 73 (38) | 1.00 | 26 (18) | 1.00 | 18 (9) | 1.00 | 29 (11) | ||||
| High | 0.60 (0.41–0.87) | <0.001 b | 402 (129) | 0.35 (0.19–0.65) | 0.001 b | 153 (48) | 0.61 (0.25–1.47) | 0.272 | 110 (35) | 0.98 (0.49–1.96) | 0.948 | 138 (46) |
| FoxP3 | ||||||||||||
| Low | 1.00 | 270 (115) | 1.00 | 88 (38) | 1.00 | 77 (32) | 1.00 | 105 (45) | ||||
| High | 0.67 (0.49–0.94) | 0.018 a | 218 (61) | 0.95 (0.56–1.59) | 0.835 | 93 (31) | 0.54 (0.27–1.07) | 0.075 | 54 (14) | 0.54 (0.30–0.99) | 0.048 a | 70 (16) |
| Multivariable including MSI status | ||||||||||||
| CD3 | ||||||||||||
| Low | 1.00 | 275 (121) | 1.00 | 97 (43) | 1.00 | 84 (33) | 1.00 | 94 (45) | ||||
| High | 0.49 (0.33–0.73) | <0.001 b | 173 (39) | 0.58 (0.31–1.08) | 0.085 | 78 (20) | 0.43 (0.18–1.04) | 0.060 | 35 (7) | 0.52 (0.25–1.09) | 0.083 | 59 (12) |
| CD8 | ||||||||||||
| Low | 1.00 | 62 (32) | 1.00 | 23 (15) | 1.00 | 15 (7) | 1.00 | 24 (10) | ||||
| High | 0.69 (0.46–1.03) | 0.072 | 380 (124) | 0.42 (0.21–0.82) | 0.012 a | 148 (46) | 0.69 (0.26–1.82) | 0.448 | 105 (33) | 1.13 (0.54–2.34) | 0.753 | 126 (45) |
| FoxP3 | ||||||||||||
| Low | 1.00 | 242 (104) | 1.00 | 81 (33) | 1.00 | 69 (28) | 1.00 | 92 (43) | ||||
| High | 0.74 (0.53–1.05) | 0.088 | 211 (59) | 1.19 (0.67–2.11) | 0.554 | 91 (30) | 0.55 (0.26–1.14) | 0.107 | 54 (12) | 0.81 (0.42–1.57) | 0.533 | 65 (15) |
Significance at the 5% level.
Significance at the 1% level. p values from multivariable analysis adjusted for age, sex, T‐stage (I, II, III, IV), N‐stage (0,1,2), M‐stage (0, 1), differentiation grade (high‐intermediate versus low) and vascular invasion (+/−/unknown), without and with inclusion of microsatellite instability (MSI) status. Information on age and sex was available for all cases. Cases with unknown information on TNM stage, differentiation grade and MSI status were not included in the multivariable model. The analysis of CD3+, CD8+ and FoxP3+ cell infiltration was based on total lymphocyte count.
The significant associations between CD3+, CD8+ and FoxP3+ lymphocytes and an improved 5‐year OS in the entire cohort were confirmed in univariable Cox regression analysis (HR = 0.51; 95% CI 0.37–0.70, HR = 0.56; 95% CI 0.40–0.79 and HR = 0.68; 95% CI 0.51–0.91, respectively), and all remained significant in multivariable analysis, after adjustment for age, sex, TNM stage, differentiation grade and vascular invasion (HR = 0.47; 95% CI 0.33–0.69, HR = 0.60; 95% CI 0.41–0.87 and HR = 0.67; 95% CI 0.49–0.94, respectively). In the right colon, the prognostic significance of CD3+ and CD8+ density was confirmed in univariable analysis (HR = 0.43; 95% CI 0.27–0.71, and HR = 0.35; 95% CI 0.21–0.60, respectively), and remained significant in multivariable analysis (HR = 0.53; 95% CI 0.29–0.95 and HR = 0.35; 95% CI 0.19–0.65, respectively). In the rectum, CD3+ density was not prognostic in univariable analysis, but multivariable Cox regression analysis revealed a significant association with a prolonged 5‐year OS (HR = 0.45; 95% CI 0.22–0.94). FoxP3+ density was not prognostic in either tumour subsite in univariable analysis; however, dense FoxP3+ cell infiltration was significantly associated with a prolonged 5‐year OS in the rectum (HR= 0.54; 95% CI 0.30–0.99).
When MSI status was included in the adjusted model, CD8+ cells remained an independent favourable prognostic factor in right‐sided tumours (HR = 0.42; 95% CI 0.21–0.82), however, when BRAF mutation status also was included, the association did not remain significant (HR = 0.49; 95% CI 0.24–1.02).
There was a significant interaction between tumour location in the right colon and high density of CD8+ lymphocytes (p for interaction = 0.031). No significant interactions were observed between CD3+ or FoxP3+ lymphocytes and any tumour location.
Using the lymphocytic reaction score,22, 23 Kaplan–Meier analysis revealed significantly prolonged survival for patients with right‐sided tumours displaying high CD8 lymphocytic score (p = 0.002), and for patients with left‐sided tumours displaying high CD3 (p = 0.008) and intermediate CD8 (p = 0.012) lymphocytic reaction score (Supporting Information Fig. 2). In Cox regression analysis, high and intermediate lymphocytic reaction score was included in one variable, whereby the prognostic significance of high CD8 lymphocytic score in right‐sided tumours was confirmed in univariable (HR = 0.50; 95% CI 0.31–0.79) and multivariable (HR = 0.44; 95% CI 0.25–0.78) Cox regression analysis (Supporting Information Table 6). In left‐sided tumours, the prognostic impact of high CD3 lymphocytic reaction score was confirmed in univariable (HR = 0.44, 95% CI 0.25–0.78) and multivariable (HR = 0.44, 95% CI 0.23–0.86) Cox regression analysis, whereas high CD8 lymphocytic reaction score was significant in univariable (HR = 0.46, 95% CI 0.25–0.86) but not in multivariable Cox regression analysis. There were no significant associations between neither CD3 nor CD8 lymphocytic reaction score and survival in rectal tumours.
Dense infiltration of CD20+ B cells has in the herein investigated cohort been found to be an independent favourable prognostic factor.17 Cox proportional hazards analyses of 5‐year OS according to B cell and plasma cell density and tumour subsite are shown in Supporting Information Table 5. Only high CD20+ density was found to be associated with an improved prognosis in right‐sided tumours, in both univariable (HR= 0.51; 95% CI 0.27–0.97) and multivariable (HR = 0.38; 95% CI 0.18–0.83) analysis. In left‐sided tumours, high CD20+ was significantly associated with a prolonged 5‐year OS in univariable (HR= 0.37; 95% CI 0.16–0.87) but not in multivariable analysis, whereas high CD138+ cell infiltration was significantly associated with a prolonged 5‐year OS in multivariable (HR = 0.48, 95% CI 0.48–0.96) but not in univariable analysis. No significant associations were observed between B cells or plasma cells and prognosis in rectal cancer. There were no significant associations between density of IGKC+ cells and prognosis in either tumour location.
Survival analysis in strata according to adjuvant chemotherapy in curatively treated Stage III patients revealed that the prognostic significance of CD3+ cells was only evident in untreated patients, in the entire cohort as well as in the right colon, but there was no significant treatment interaction (data not shown). The prognostic impact of the other lymphocyte subsets did not differ significantly in strata according to adjuvant chemotherapy (data not shown).
Discussion
Numerous studies have thus far examined tumour infiltration of T cells in CRC and its relation to prognosis. However, this study is, to the best of our knowledge, the first to investigate the prognostic impact of immune cell infiltrates in colorectal cancer with specific emphasis on the anatomical localisation of the primary tumour.
In the entire cohort, dense infiltration of CD3+ and CD8+ lymphocytes was independently associated with an improved prognosis, which is in concordance with previous research.24 Furthermore, high numbers of FoxP3+ Tregs was found to be an independent auspicious prognostic factor. This is in line with previous studies in CRC; however, in the majority of human carcinomas, FoxP3 has been demonstrated to be mainly associated with a dismal prognosis, as reviewed in Ref. 9. The contrasting findings in CRC have been attributed to the microbiota in the colon, that triggers a carcinogenic cascade which FoxP3+ cells inhibits.9 Furthermore, as Tregs suppress other T cells,25 they may also impair the function of pro‐tumourigenic inflammatory Th17 cells,26 thus inhibiting tumour progression. Albeit Tregs have been considered a potential target for immunotherapy,27, 28 the results from our study further indicate that Treg‐depleting treatment might be detrimental in CRC.
When taking primary tumour subsite into consideration, only CD3+ and CD8+ T cells were independent prognostic factors in right‐sided tumours, whereas FoxP3+ T cells were independently associated with an improved prognosis in rectal tumours, but not in left‐ or right‐sided tumours. A significant interaction with tumour subsite was only observed for CD8+ lymphocyte density and the righ‐sidedness. Furthermore, CD20+ B cells were independently associated with an improved prognosis for patients with right‐sided tumours, but not for those with left‐sided or rectal tumours, whereas dense CD138+ immune cell infiltration was an independent predictor of improved prognosis in left‐sided tumours, but not in right‐sided or rectal tumours. Of note, the segments in the colon have different fetal origin. The proximal part, from the appendix to the first two thirds of the transverse colon, originates from the midgut, whereas the distal part, from the left colic flexure to the rectum, originates from the hindgut. Increasing evidence suggests several differences between right‐sided and left‐sided CRC, including epidemiology, tumour characteristics and prognosis.29 Furthermore, right‐sided tumours demonstrate diverse genetic and molecular characteristics compared to left‐sided tumours,30 and these differences in biological behaviour have been suggested to induce different response to chemotherapy.31 The findings from the present study provide further evidence that proximal and distal CRC may represent distinct disease entities, wherein the impact of the inflammatory tumour microenvironment on tumour progression, prognosis and prediction differs.
Interestingly, only CD8+ T cell infiltration differed significantly according to anatomical subsite, with denser infiltration in rectal and left‐sided tumours than in right‐sided tumours. This is in contrast with a previous study, demonstrating no differences in CD8+ cell infiltration according to tumour subsite, but a denser infiltration of FoxP3+ cells in rectal than in right‐sided or left‐sided tumours.16 As right‐sided colon cancer generally carries a poorer prognosis than left‐sided colon cancer,29, 32 our findings further emphasise the positive prognostic impact of CD8+ lymphocyte infiltration.
An increased infiltration of lymphocytes has previously been found in MSI‐high tumours,33 mostly being proximally located. This was confirmed in the present study, with the vast majority of MSI tumours displaying a high density of CD3+, CD8+ and FoxP3+ cells, in the full cohort as well as in right‐sided tumours, despite the total number of lymphocytes not being higher in the latter. However, the favourable impact of CD8+ T cells was independent of MSI status in the entire cohort as well as in right‐sided tumours, further supporting that combined assessment of MSI status and tumour‐infiltrating lymphocytes will provide a more accurate prognostication, in particular in patients with right‐sided tumours. Similar findings have been observed using the immunoscore.34
Additionally, high density of CD3+, CD8+ as well as FoxP3+ T cells was found to correlate significantly with lower T‐ and M‐stage both in the entire cohort and after stratifying for tumour location. However, the associations between cytotoxic as well as regulatory T cell infiltration and lower M‐stage only remained significant in right‐sided tumours, further suggesting that dense infiltration of these lymphocytes carries a greater clinical impact in right‐sided tumours than in left‐sided or rectal tumours.
A rather large proportion of the studies investigating the differences between right‐ and left‐sided CRC have used alternative definitions, for example, defining the right colon from the appendix to the hepatic flexure and the left colon from the splenic flexure to the rectum, thus excluding the transverse colon altogether. We defined right colon as appendix, caecum, ascending and two thirds of the transverse colon, and left colon as left colic flexure, descending and sigmoid colon, corresponding to the midgut versus the hindgut fetal origin. However, research demonstrates a gradual transition through the multiple anatomic subsites, rather than abrupt changes as in the two‐colon model.35 Nonetheless, as a clinically practicable tool, the two‐colon model might still be preferable.
The prognostic relevance of tumour subsite has hitherto mainly been acknowledged in patients with metastatic CRC and in relation to chemotherapy response.32 In the present cohort, with incident cases spanning over several decades and a comparatively large proportion of curatively treated Stage II patients who did not receive adjuvant chemotherapy, no evident predictive value of any of the investigated T cells, B cells or plasma cells could be observed, neither in the entire cohort nor according to tumour subsite. However, the lack of a prognostic impact of CD3+ lymphocytes in adjuvant Stage III treated patients who received chemotherapy in contrast to those who did not, supports that assessment of tumour‐infiltrating lymphocytes may provide additional prognostic information, and, hence, be of value regarding choice of treatment in some situations.
As the study was performed retrospectively, there is an inherent risk of selection bias. Nevertheless, the herein investigated tumours are derived from a prospective, population‐based cohort with clinically and histopathologically well‐characterised incident CRC cases. Another potential weakness of the study is the use of the TMA technique. Although two 1 mm cores can be considered an adequate sampling and a plethora of validatory studies have previously concluded that findings based on large sections were fully reproducible in TMA‐based studies,36 the tumour stroma has not been specifically sampled in the herein used TMA. Future studies on the prognostic value of the inflammatory tumour microenvironment should ideally be performed on TMAs also including tissue samples from the stromal compartment. However, it should also be pointed out that the prognostic value of B‐cells and plasma cells has been shown to be concordant between studies using whole tissue sections and studies using the TMA technique, including in the herein investigated cohort.17
Conclusion
This study provides a first demonstration of the prognostic impact of cytotoxic and regulatory T cells in colorectal cancer according to primary tumour location. Whereas a high density of cytotoxic T cells was an independent prognostic factor in right‐sided tumours, but not in left‐sided or rectal tumours, regulatory T cells predicted longer survival only in patients with rectal tumours. These findings further underline that tumour location may be an important factor to take into consideration when assessing immune cell density for the purpose of prognostication and possibly also for prediction of response to immunotherapy in patients with colorectal cancer.
Competing Interests
The authors declare that they have no competing interests.
Authors' Contributions
JB performed the immunohistochemical and statistical analyses and drafted the manuscript. MCS helped draft the manuscript. KL contributed with reagents and helped draft the manuscript. BN constructed the TMAs and performed immunohistochemical stainings. PM contributed with analysis tools and assisted with the automated analysis. AHL and JE collected clinical data. KJ conceived of the study, assisted with the statistical analyses and helped draft the manuscript. All authors read and approved the final manuscript.
Supporting information
Supporting Information Figure 1.
Supporting Information Figure 2.
Supporting Information Figure 3.
Supporting Information Tables.
References
- 1. Jemal A, Bray F, Center MM, et al Global cancer statistics. CA Cancer J Clin 2011;61:69–90. [DOI] [PubMed] [Google Scholar]
- 2. Deschoolmeester V, Baay M, Van Marck E, et al Tumor infiltrating lymphocytes: an intriguing player in the survival of colorectal cancer patients. BMC Immunol 2010;11:19. [DOI] [PMC free article] [PubMed] [Google Scholar]
- 3. Galon J, Costes A, Sanchez‐Cabo F, et al Type, density, and location of immune cells within human colorectal tumors predict clinical outcome. Science 2006;313:1960–4. [DOI] [PubMed] [Google Scholar]
- 4. Naito Y, Saito K, Shiiba K, et al CD8+ T cells infiltrated within cancer cell nests as a prognostic factor in human colorectal cancer. Cancer Res 1998;58:3491–4. [PubMed] [Google Scholar]
- 5. Chiba T, Ohtani H, Mizoi T, et al Intraepithelial CD8+ T‐cell‐count becomes a prognostic factor after a longer follow‐up period in human colorectal carcinoma: possible association with suppression of micrometastasis. Br J Cancer 2004;91:1711–7. [DOI] [PMC free article] [PubMed] [Google Scholar]
- 6. Laghi L, Bianchi P, Miranda E, et al CD3+ cells at the invasive margin of deeply invading (pT3‐T4) colorectal cancer and risk of post‐surgical metastasis: a longitudinal study. Lancet Oncol 2009;10:877–84. [DOI] [PubMed] [Google Scholar]
- 7. Sinicrope FA, Rego RL, Ansell SM, et al Intraepithelial effector (CD3+)/regulatory (FoxP3+) T‐cell ratio predicts a clinical outcome of human colon carcinoma. Gastroenterology 2009;137:1270–9. [DOI] [PMC free article] [PubMed] [Google Scholar]
- 8. Mei Z, Liu Y, Liu C, et al Tumour‐infiltrating inflammation and prognosis in colorectal cancer: systematic review and meta‐analysis. Br J Cancer 2014;110:1595–605. [DOI] [PMC free article] [PubMed] [Google Scholar]
- 9. Ladoire S, Martin F, Ghiringhelli F. Prognostic role of FOXP3+ regulatory T cells infiltrating human carcinomas: the paradox of colorectal cancer. Cancer Immunol Immunother 2011;60:909–18. [DOI] [PMC free article] [PubMed] [Google Scholar]
- 10. Baxevanis CN, Papamichail M, Perez SA. Immune classification of colorectal cancer patients: impressive but how complete? Expert Opin Biol Ther 2013;13:517–26. [DOI] [PubMed] [Google Scholar]
- 11. Curiel TJ, Coukos G, Zou L, et al Specific recruitment of regulatory T cells in ovarian carcinoma fosters immune privilege and predicts reduced survival. Nat Med 2004;10:942–9. [DOI] [PubMed] [Google Scholar]
- 12. Salama P, Phillips M, Grieu F, et al Tumor‐infiltrating FOXP3+ T regulatory cells show strong prognostic significance in colorectal cancer. J Clin Oncol 2009;27:186–92. [DOI] [PubMed] [Google Scholar]
- 13. Hanke T, Melling N, Simon R, et al High intratumoral FOXP3(+) T regulatory cell (Tregs) density is an independent good prognosticator in nodal negative colorectal cancer. Int J Clin Exp Pathol 2015;8:8227–35. [PMC free article] [PubMed] [Google Scholar]
- 14. Frey DM, Droeser RA, Viehl CT, et al High frequency of tumor‐infiltrating FOXP3(+) regulatory T cells predicts improved survival in mismatch repair‐proficient colorectal cancer patients. Int J Cancer 2010;126:2635–43. [DOI] [PubMed] [Google Scholar]
- 15. Nosho K, Baba Y, Tanaka N, et al Tumour‐infiltrating T‐cell subsets, molecular changes in colorectal cancer, and prognosis: cohort study and literature review. J Pathol 2010;222:350–66. [DOI] [PMC free article] [PubMed] [Google Scholar]
- 16. Minoo P, Zlobec I, Peterson M, et al Characterization of rectal, proximal and distal colon cancers based on clinicopathological, molecular and protein profiles. Int J Oncol 2010;37:707–18. [DOI] [PubMed] [Google Scholar]
- 17. Berntsson J, Nodin B, Eberhard J, et al Prognostic impact of tumour‐infiltrating B cells and plasma cells in colorectal cancer. Int J Cancer 2016;139:1129–39. [DOI] [PubMed] [Google Scholar]
- 18. Berglund G, Elmstahl S, Janzon L, et al The Malmo Diet and Cancer Study. Design and feasibility. J Intern Med 1993;233:45–51. [DOI] [PubMed] [Google Scholar]
- 19. Wangefjord S, Brandstedt J, Lindquist KE, et al Associations of beta‐catenin alterations and MSI screening status with expression of key cell cycle regulating proteins and survival from colorectal cancer. Diagn Pathol 2013;8:10. [DOI] [PMC free article] [PubMed] [Google Scholar]
- 20. Wangefjord S, Sundstrom M, Zendehrokh N, et al Sex differences in the prognostic significance of KRAS codons 12 and 13, and BRAF mutations in colorectal cancer: a cohort study. Biol Sex differ 2013;4:17. [DOI] [PMC free article] [PubMed] [Google Scholar]
- 21. Kononen J, Bubendorf L, Kallioniemi A, et al Tissue microarrays for high‐throughput molecular profiling of tumor specimens. Nat Med 1998;4:844–7. [DOI] [PubMed] [Google Scholar]
- 22. Dahlin AM, Henriksson ML, Van Guelpen B, et al Colorectal cancer prognosis depends on T‐cell infiltration and molecular characteristics of the tumor. Mod Pathol 2011;24:671–82. [DOI] [PubMed] [Google Scholar]
- 23. Ogino S, Nosho K, Irahara N, et al Lymphocytic reaction to colorectal cancer is associated with longer survival, independent of lymph node count, microsatellite instability, and CpG island methylator phenotype. Clin Cancer Res 2009;15:6412–20. [DOI] [PMC free article] [PubMed] [Google Scholar]
- 24. Pernot S, Terme M, Voron T, et al Colorectal cancer and immunity: what we know and perspectives. World J Gastroenterol 2014;20:3738–50. [DOI] [PMC free article] [PubMed] [Google Scholar]
- 25. Fridman WH, Pages F, Sautes‐Fridman C, et al The immune contexture in human tumours: impact on clinical outcome. Nat Rev Cancer 2012;12:298–306. [DOI] [PubMed] [Google Scholar]
- 26. Stewart CA, Metheny H, Iida N, et al Interferon‐dependent IL‐10 production by Tregs limits tumor Th17 inflammation. J Clin Invest 2013;123:4859–74. [DOI] [PMC free article] [PubMed] [Google Scholar]
- 27. Rech AJ, Vonderheide RH. Clinical use of anti‐CD25 antibody daclizumab to enhance immune responses to tumor antigen vaccination by targeting regulatory T cells. Ann N Y Acad Sci 2009;1174:99–106. [DOI] [PubMed] [Google Scholar]
- 28. Kurose K, Ohue Y, Wada H, et al Phase Ia study of FoxP3+ CD4 Treg depletion by infusion of a humanized anti‐CCR4 antibody, KW‐0761, in cancer patients. Clin Cancer Res 2015;21:4327–36. [DOI] [PubMed] [Google Scholar]
- 29. Benedix F, Kube R, Meyer F, et al Comparison of 17,641 patients with right‐ and left‐sided colon cancer: differences in epidemiology, perioperative course, histology, and survival. Dis Colon Rectum 2010;53:57–64. [DOI] [PubMed] [Google Scholar]
- 30. Missiaglia E, Jacobs B, D'ario G, et al Distal and proximal colon cancers differ in terms of molecular, pathological, and clinical features. Ann Oncol 2014;25:1995–2001. [DOI] [PubMed] [Google Scholar]
- 31. Grady WM, Carethers JM. Genomic and epigenetic instability in colorectal cancer pathogenesis. Gastroenterology 2008;135:1079–99. [DOI] [PMC free article] [PubMed] [Google Scholar]
- 32. Holch JW, Ricard I, Stintzing S, et al The relevance of primary tumour location in patients with metastatic colorectal cancer: a meta‐analysis of first‐line clinical trials. Eur J Cancer 2017;70:87–98. [DOI] [PubMed] [Google Scholar]
- 33. Dolcetti R, Viel A, Doglioni C, et al High prevalence of activated intraepithelial cytotoxic T lymphocytes and increased neoplastic cell apoptosis in colorectal carcinomas with microsatellite instability. Am J Pathol 1999;154:1805–13. [DOI] [PMC free article] [PubMed] [Google Scholar]
- 34. Mlecnik B, Bindea G, Angell HK, et al Integrative analyses of colorectal cancer show immunoscore is a stronger predictor of patient survival than microsatellite instability. Immunity 2016;44:698–711. [DOI] [PubMed] [Google Scholar]
- 35. Yamauchi M, Morikawa T, Kuchiba A, et al Assessment of colorectal cancer molecular features along bowel subsites challenges the conception of distinct dichotomy of proximal versus distal colorectum. Gut 2012;61:847–54. [DOI] [PMC free article] [PubMed] [Google Scholar]
- 36. Schraml P, Kononen J, Bubendorf L, et al Tissue microarrays for gene amplification surveys in many different tumor types. Clin Cancer Res 1999;5:1966–75. [PubMed] [Google Scholar]
Associated Data
This section collects any data citations, data availability statements, or supplementary materials included in this article.
Supplementary Materials
Supporting Information Figure 1.
Supporting Information Figure 2.
Supporting Information Figure 3.
Supporting Information Tables.