Abstract
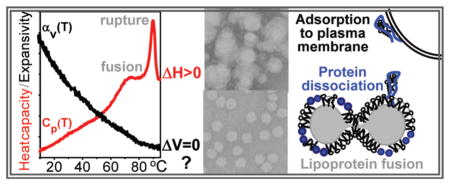
Plasma lipoproteins are assemblies of lipids and apolipoproteins that mediate lipid transport and metabolism. High-density lipoproteins (HDL) remove excess cell cholesterol and provide protection against atherosclerosis. Important aspects of metabolic HDL remodeling, including apolipoprotein dissociation and lipoprotein fusion, are mimicked in thermal denaturation. We report the first study of the protein–lipid complexes by pressure perturbation calorimetry (PPC) beyond 100 °C. In PPC, volume expansion coefficient αv(T) is measured during heating; in proteins, αv(T) is dominated by hydration. Calorimetric studies of reconstituted HDL and of human high-density, low-density, and very low-density lipoproteins reveal that apolipoprotein unfolding, dissociation, and lipoprotein fusion are endothermic transitions without detectable volume changes. This may result from the limited applicability of PPC to slow kinetically controlled transitions such as thermal remodeling of lipoproteins and/or from the possibility that this remodeling causes no significant changes in the solvent structure and, hence, may not involve large transient solvent exposure of apolar moieties. Another conclusion is that apolipoprotein A-I in solution adsorbs to the phospholipid surface; protein hydration is preserved upon such adsorption. We posit that adsorption to a phospholipid surface helps recruit free apolipoprotein to the plasma membrane and facilitate HDL biogenesis.
Graphical abstract
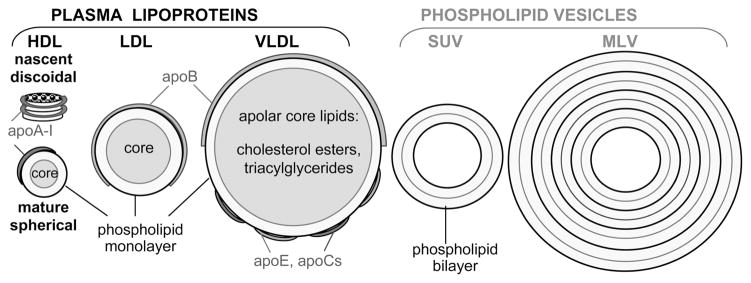
Lipids in the body are transported in the form of lipoproteins that are noncovalent macromolecular assemblies of specific proteins (termed apolipoproteins) and lipids. Mature lipoproteins are spherical nanoparticles containing a core of apolar lipids (mainly cholesterol esters and triacylglycerides) and an amphipathic surface comprised of polar lipids (mainly phospholipids and cholesterol) and apolipoproteins (refs 1 and 2 and references therein). Plasma lipoproteins form several major classes differing in particle size, density, protein and lipid composition, and function (Figure 1). High-density lipoproteins (HDLs, or “good cholesterol”, d = 8–12 nm) remove excess cell cholesterol via the reverse cholesterol transport pathway and have other cardioprotective properties (for recent reviews, see refs 1, 3, and 4). As a result, plasma concentrations of HDL, HDL cholesterol, and the major HDL protein, the exchangeable (water-soluble) apolipoprotein A-I (apoA-I, 28 kDa), correlate inversely with the risk of developing atherosclerosis (refs 5 and 6 and references therein). Low-density lipoproteins (LDL, or “bad cholesterol”, d ~ 22 nm) are the main plasma carriers of cholesterol that deliver it to the peripheral cells. Elevated plasma levels of LDL, LDL cholesterol, and the main LDL protein, the non-exchangeable (water-insoluble) apolipoprotein B (apoB, 550 kDa), are strong risk factors for atherosclerosis.7–9 Very low-density lipoproteins (VLDL, d = 40–100 nm), which contain both exchangeable (apoE and apoCs) and nonexchangeable (apoB) apolipoproteins, are direct metabolic precursors of LDL and an independent risk factor for cardiovascular disease.9–11
Figure 1.
Lipoproteins and lipid vesicles used in this work. Nascent HDL are discoidal particles (d ~ 10 nm) comprised of a phospholipid bilayer with the apolipoprotein wrapped around the disk perimeter in an α-helical double-belt conformation. Mature lipoproteins have an apolar lipid core and polar surface that is comprised of apolipoproteins embedded in a cholesterol-containing phospholipid monolayer. The major HDL protein, apoA-I (28 kDa), and other exchangeable apolipoproteins (apoE, apoCs, etc.) are highly α-helical. The major LDL protein, apoB (550 kDa), is non-exchangeable. VLDL contain comparable amounts of the nonexchangeable (apoB) and exchangeable (apoE and apoCs) apolipoproteins.
During metabolism, plasma lipoproteins undergo dynamic remodeling by lipolytic enzymes, lipid transporters, lipid transfer proteins, and lipoprotein receptors.11,12 Such remodeling involves apolipoprotein binding to and dissociation from the lipid surface, incorporation and esteriflcation of cholesterol, hydrolysis of phospholipids and triacylglycerides, etc. Previously, we showed that important aspects of this remodeling, including apolipoprotein dissociation and lipoprotein fusion and rupture, are mimicked in thermal or chemical denaturation of HDL, LDL, and VLDL.13–16 We demonstrated that the rate of HDL remodeling, which correlates with lipoprotein function,17 is determined by kinetic barriers that result, in part, from transient disruption of the protein and lipid packing interactions during protein dissociation and lipoprotein fusion (ref 18 and references therein) (Figure 2). To test whether these kinetic barriers have a significant contribution from the transient solvent exposure of the apolar moieties during lipoprotein remodeling, in this work we use pressure perturbation calorimetry (PPC) to analyze volumetric and hydration properties of all major lipoprotein classes.
Figure 2.
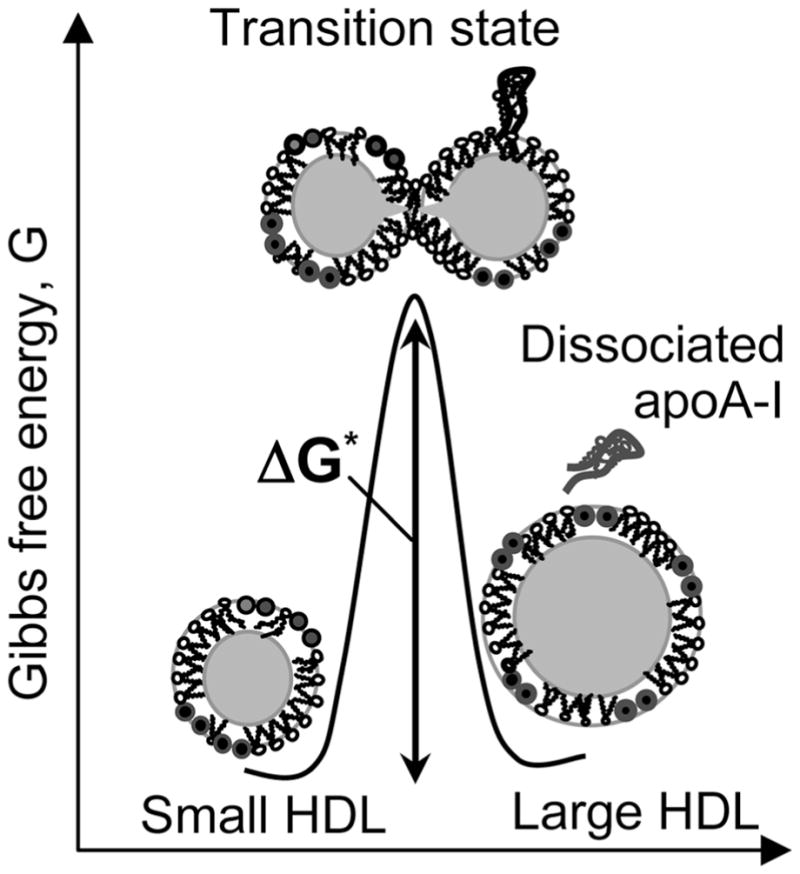
Kinetic barriers modulate HDL remodeling in vivo and in vitro. The putative high-energy transition state that involves protein dissociation and lipoprotein fusion is illustrated. Small and large spherical HDL form structurally and functionally distinct subclasses in human plasma. During reverse cholesterol transport, small HDL are remodeled into large HDL by plasma factors; such remodeling involves apoA-I dissociation and HDL fusion. Similar apoA-I dissociation and HDL fusion occur during thermal or chemical denaturation.13,14,17
PPC has been developed in conjunction with differential scanning calorimetry (DSC) to determine the volume expansion coefficient of solutes, αv(T) = 1/V(∂V/∂T)P, by measuring small heat effects resulting from sample contraction (or expansion) upon application (or release) of small ~5 bar pressures for approximately 1 min.19 In reversible reactions, these heat effects are linked to volume changes via the Maxwell equation, (∂Q/∂P)T = −T(∂V/∂T)P = −TVαv.19,20 In proteins, αv(T) is relatively small (10−4–10−3) and is dominated by hydration that is distinct for charged, polar, and apolar groups.21 Furthermore, protein unfolding upon heating involves volume expansion or contraction manifested as a positive or negative peak in αv(T). Integration of this peak yields a relative volume change upon unfolding, ΔVunf = ΔV/V, where ΔV = VU − VF is the difference in specific volume V of the unfolded (U) and folded (F) protein.22 In lipids, αv(T) depends largely on the mechanical properties of the lipid assembly and is higher than in proteins, reaching 10−2–10−1 at the chain melting transition in phosphatidylcholines (PCs).23 The existing PPC measurements of lipids have largely focused on volume changes involved in this chain melting transition in lipid vesicles.23–26
Recently, we reported the first PPC analysis of the chain melting transition in apolipoprotein–PC complexes that provide models for nascent “discoidal” HDL.27 We also conducted PPC analysis of lipid-free apoA-I in solution over a broad temperature range that encompasses protein unfolding centered at Tm = 60 °C. The results demonstrated that apoA-I unfolding involves a relatively large negative volume change (ΔVunf = −0.33%) and showed the importance of charged groups for apolipoprotein hydration.27 In this work, we analyze a variety of model and plasma lipoproteins by PPC over a temperature range that encompasses lipoprotein heat denaturation.
MATERIALS AND METHODS
Isolation of Human Lipoproteins
Lipoproteins from plasma of three healthy volunteers were used. The blood was donated at a blood bank according to the rules of the institutional review board and with written consent from the donors. Single-donor lipoproteins were isolated from fresh EDTA-treated plasma by density gradient ultracentrifugation in density ranges of 1.063–1.21 g/mL for HDL, 1.019–1.063 g/mL for LDL, and 0.94–1.006 g/mL for VLDL.28 Lipoproteins from each class migrated as a single band on the agarose and nondenaturing gels. Lipoprotein stock solutions were dialyzed against standard buffer (10 mM sodium phosphate, pH 7.5), degassed, and stored in the dark at 4 °C. The stock solutions were used in 2–3 weeks during which no protein degradation was detected by sodium dodecyl sulfate–polyacrylamide gel electrophoresis and no changes in the lipoprotein electrophoretic mobility were detected by the agarose gel.
Reconstitution of Model HDL
ApoA-I was isolated and purified from human plasma HDL and refolded as described.29 Protein concentrations were determined with a modified Lowry assay. Ultrapure lipids, including dimyristoyl PC [DMPC (14:0, 14:0)], dipalmitoyl PC [DPPC (16:0, 16:0)], palmitoyl oleoyl PC [POPC (16:0, 16:1)], and unesterified cholesterol (Ch), were from Avanti Polar Lipids. Reconstituted HDL (rHDL) comprised of apoA-I and DMPC were obtained by thin film evaporation.29,30 Briefly, DMPC was dissolved in 2 parts chloroform and 1 part methanol and dried under nitrogen to produce a uniform film. Residual solvent was removed under vacuum. The film was resuspended in standard buffer and vortexed to prepare multilamellar vesicles (MLV). The protein in standard buffer was added to MLV, and the mixture was incubated overnight at 24 °C to form rHDL. ApoA-I:DMPC molar ratios used in our experiments ranged from 1:5 to 1:50. Model rHDL comprised of apoA-I, DPPC, and cholesterol were prepared by cholate dialysis using a 1:80:4 apoA-I:DPPC:Ch molar ratio as described.30 Sodium cholate was removed by extensive dialysis against standard buffer; uncomplexed protein was removed by gel filtration. Formation of rHDL was confirmed by negative stain electron microscopy (EM) and nondenaturing gel electrophoresis (NDGE).
Preparation of Multilamellar and Small Unilamellar Vesicles (MLV and SUV, respectively)
MLV were prepared by thin film evaporation. The lipid film was dispersed in PBS (10 mM sodium phosphate buffer, 150 mM NaCl, and 0.1 mM EDTA at pH 7.5) and vortexed. To obtain SUV, the MLV suspension was sonicated on ice at 35% amplitude with a 4 s pulse by using a Branson sonicator with a microprobe. After the solution became translucent, it was centrifuged for 10 min at 12000 rpm. Negative stain EM showed that the resulting SUV were homogeneous and ranged in size from 25 to 30 nm. These SUV were used for further studies within 4 h of preparation.
Lipoprotein Characterization
Thin-layer chromatography was used for qualitative analysis of the lipid composition in rHDL. The lipids were extracted using a 2:1 chloroform/methanol mixture by the Folch method31 and dried under N2. Known amounts of dry lipids were analyzed using a methanol/water/acetic acid mixture (65:25:4:1) to separate polar lipids.
NDGE was performed using 4 to 15% gradient gels. Lipoprotein samples containing 10 μg of protein were run for 2 h at 120 V. The gels were stained with Denville protein stain (Denville Scientific). The particle diameters were assessed from comparison with the high-molecular weight standards (GE Healthcare).
Negative stain EM was performed to visualize intact and heated lipoproteins and SUV by using a CM12 transmission electron microscope (Philips Electron Optics) as described.13
Size-exclusion chromatography (SEC) was used to separate various protein-containing fractions in the protein–lipid systems. The samples were run on a Superose 6 10/300 GL column (GE Biosciences Inc., Piscataway, NJ) at a flow rate of 0.5 mL/min in standard buffer containing 150 mM NaCl. The protein size was assessed from the calibration plot (R2 = 0.95) obtained by using molecular-size markers (from Bio-Rad) that were run under the same conditions as the samples.
Circular dichroism (CD) spectroscopy was used to monitor protein unfolding in lipid-free and lipid-bound states. Heat-induced changes in CD were recorded at 222 nm for α-helical unfolding as described29 using an AVIV 400 spectropolarimeter with a thermoelectric temperature controller. Typically, far-UV CD melting data were recorded from solutions of 0.02 mg/mL protein concentration during heating and cooling at a rate of 11 °C/h. The data were normalized to protein concentration and expressed as molar residue ellipticity, [Θ]. Near-UV CD spectra (250–350 nm) were recorded from solutions of 0.5 mg/mL protein concentration placed in a 5 mm cell and are reported as molar ellipticity.
Differential Scanning and Pressure Perturbation Calorimetry
DSC and PPC data, Cp(T) and αv(T), respectively, were recorded by using a VP-DSC microcalorimeter (MicroCal) equipped with a PPC accessory. The sample and reference cells (cell volume of 0.5 mL) were filled with a degassed sample and matching buffer solutions and heated from 5 to 115 °C at a rate of 90 °C/h in DSC or at a rate of 80 °C/h in PPC. In DSC experiments, a 1.8 bar pressure was applied to the cells to prevent bubble formation; differential heat capacity Cp(T) was recorded in mid-gain mode, and the buffer–buffer baselines were subtracted from the data. In PPC experiments, 5 bar pressures were applied to the cells in a programmed regime in the context of a DSC experiment. The heat effects associated with such pressure changes were used to determine the volume expansion coefficient of the solute on an absolute scale, αv(T). Buffer–buffer, buffer–water, and water–water baselines that were used for the PPC data analysis were fitted by fourth-order polynomials. The partial specific volumes of lipoproteins, which were based on the weighted average of the partial specific volumes of the protein and lipid and/or on the published values (Table S1 of the Supporting Information), were used to calculate αv(T). The PPC data were recorded in mid-gain, low-noise mode with a 1 s filter time and a 0.5 °C temperature increment.
All experiments in this study were repeated three to five times to ensure reproducibility.
RESULTS
PPC of Human Plasma Lipoproteins
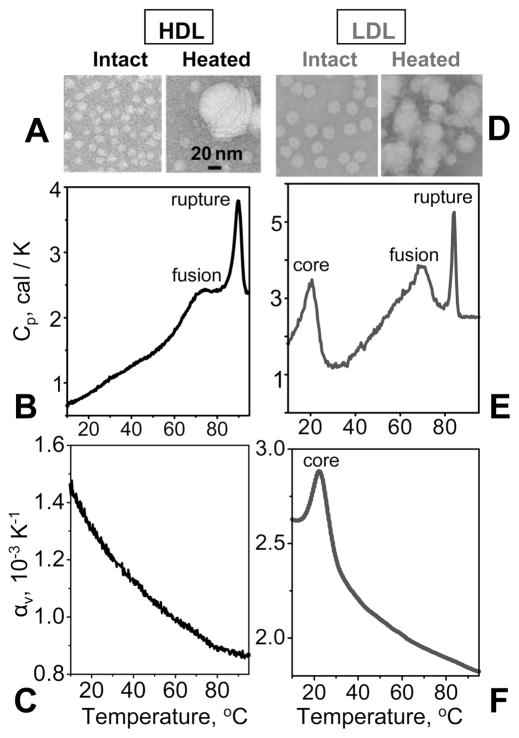
Figure 3 shows EM and calorimetric data of human HDL and LDL. Mature human HDLs undergo heat-induced remodeling that has been characterized by DSC, CD, light scattering, EM, and NDGE (refs 13 and 14 and references therein). Two irreversible transitions were observed: (i) dissociation and unfolding of a fraction of apolipoprotein and concomitant HDL fusion into larger HDL-like particles (broader heat capacity peak in Figure 3B) and (ii) additional protein unfolding and dissociation, along with lipoprotein rupture and release of core lipids that coalesce into droplets (sharper peak in Figure 3B). Remarkably, despite large changes in the particle size observed in these transitions by EM (Figure 3A), NDGE, and turbidity,14 PPC detects no changes in volume expansion coefficient αv(T) at high temperatures (Figure 3C). Hence, HDL heat denaturation in aqueous solution is an endothermic transition without detectable volume changes.
Figure 3.
Heat-induced remodeling of HDL (A–C) and LDL (D–F) analyzed by negative stain electron microscopy and calorimetry. Electron micrographs of human plasma HDL (A) and LDL (D). The lipoproteins (2 mg/mL protein in 10 mM sodium phosphate, pH 7.5) were either intact or heated in a context of a DSC experiment at a rate of 90 °C/h from 5 to 115 °C and cooled to 22 °C prior to EM analysis. DSC data of HDL are shown in panel B and those of LDL in panel E. Heat capacity peaks corresponding to irreversible lipoprotein fusion and rupture are indicated. “Core” indicates the peak corresponding to the reversible smectic-to-disorder phase transition in the core cholesterol esters in LDL.32,33 The calorimetric enthalpy of this lipid core transition is ~504 ± 100 kcal/mol per particle (an average LDL contains ~1200 molecules of cholesterol ester). Such a transition is not observed in HDL whose core is too small to form the smectic phase. PPC data of HDL (C) and LDL (F) were recorded under conditions similar to those used to record the DSC data but at a rate of 80 °C/h. The volume change ΔV/V involved in the core transition in LDL, which was determined by integration of the αv(T) peak, is 0.25 ± 0.2%. The accuracy in the determination of ΔV/V reflects small batch-to-batch variations in the lipoprotein composition that affect the absolute value of αv(T) and ΔV/V.
The results in Figure 3 reveal that, similar to HDL, heat denaturation of LDL is an endothermic transition without volume changes that can be detected by PPC. Compared to HDL, human LDL have a relatively large cholesterol ester-rich core that undergoes a reversible smectic-to-disorder phase transition at near-physiologic temperatures (refs 32 and 33 and references therein). DSC data of this and earlier studies show that this lipid core transition is endothermic, and integration of the PPC peak corresponding to this transition shows that it involves an increase in volume (ΔV/V) = 0.26 ± 0.2% (low-temperature peak in panels E and F of Figure 3). At high temperatures, LDL undergo irreversible remodeling into larger and smaller LDL-like particles followed by particle rupture, release of apolar lipid, and coalescence into droplets observed by EM (Figure 3D), which is accompanied by substantial β-sheet unfolding in apoB observed by far-UV CD.15 These endothermic LDL transitions correspond to two heat capacity peaks observed by DSC (Figure 3E). Notably, PPC shows no changes in αv(T) at high temperatures encompassing these LDL transitions (Figure 3F). Hence, despite distinct differences in the particle size and protein conformation in HDL (~80% α-helix in apoA-I) and LDL (α/structure in apoB), neither HDL nor LDL exhibit changes in αv(T) during thermal denaturation in PPC experiments.
Similar to LDL, human VLDL undergo a reversible smectic-to-disordered phase transition in the lipid core at near-physiologic temperatures.34 At higher temperatures, VLDL undergo irreversible remodeling into larger and smaller lipoprotein-like particles followed by lipoprotein rupture, release of apolar lipids, and coalescence into lipid droplets; these morphologic transitions are accompanied by partial unfolding of the VLDL proteins.16 Difficulties in the experimental analysis of these large fat-loaded particles have limited their earlier calorimetric studies to <60 °C. We obtained the first high-temperature DSC and PPC data encompassing heat denaturation of VLDL (Figure S1 of the Supporting Information). At low temperatures that encompass the smectic-to-disorder phase transition in core lipids, integration of the PPC peak from about 20 to 40 °C shows that the volume change in this transition is ΔV/V = 1.62 ± 0.5%, much larger than that in LDL (0.26%), which is consistent with the much larger core size in VLDL as compared to LDL. At high temperatures between 40 and 100 °C, the DSC and PPC data in Figure S1 of the Supporting Information clearly show that, similar to HDL and LDL, heat denaturation of VLDL is endothermic and involves no detectable changes in αv(T). Taken together, our results reveal that heat denaturation of all major classes of human plasma lipoproteins shows no detectable changes in αv(T) and, hence, no volume changes in PPC experiments.
Another result of our PPC studies is the inverse correlation between the measured value of αv(T) and the lipoprotein diameter (Table S2 of the Supporting Information). Because lipoprotein diameter increases with increasing lipid to protein ratio, this result reflects a higher content of lipid in larger lipoproteins as well as the higher αv of lipids compared to proteins.
PPC of Model Discoidal rHDL
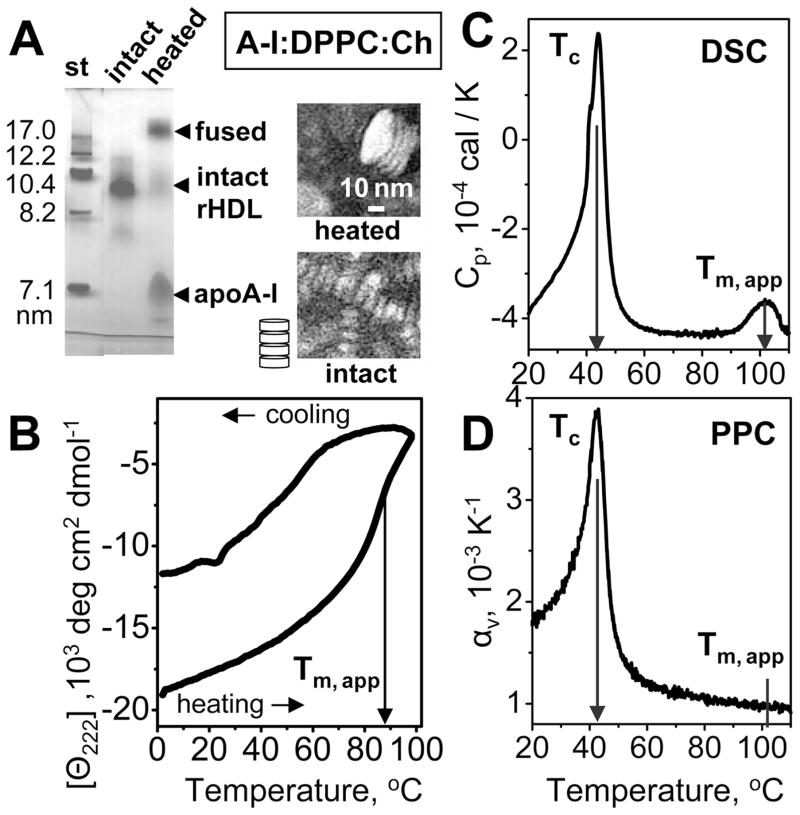
Volumetric properties of protein–lipid complexes were further explored by using model discoidal rHDL reconstituted from apoA-I and polar lipids. First, we studied apoA-I:DPPC:Ch complexes that provide a model for nascent plasma HDL that are also comprised mainly of apoA-I, diacyl PCs, and 5–10 mol % cholesterol (ref 29 and references therein). The apoA-I:DPPC:Ch complexes used in our work had diameters d~9.6 nm, as observed by NDGE and EM (Figure 4A), and contained two to three molecules of apoA-I per complex.35 Heating of these complexes led to apoA-I unfolding observed by CD (Figure 4B), along with dissociation of a fraction of apoA-I and fusion of the lipoproteins into vesicles observed by NDGE and EM (Figure 4A). SEC of the heat-denatured rHDL showed three distinct protein-containing fractions: vesicles formed upon rHDL fusion, intact rHDL, and dissociated monomolecular apoA-I (peaks 1–3, respectively, in Figure S2A of the Supporting Information). Thin-layer chromatography detected the presence of lipids in each of these fractions (Figure S2B of the Supporting Information). PPC data recorded from the isolated lipid-poor apoA-I (fraction 3) were similar to those of lipid-free apoA-I (black squares in Figure 5B) and showed large negative volume changes upon protein unfolding near 60 °C (data not shown).
Figure 4.
Heat-induced remodeling of discoidal rHDL reconstituted from human apoA-I, DPPC, and cholesterol. (A) Nondenaturing gel electrophoresis and negative stain EM of rHDL that were intact or heated to 110 °C and cooled to 22 °C. NDGE shows that such heating leads to irreversible remodeling of intact rHDL (d ~ 9.6 nm) into dissociated apoA-I and protein-containing vesicles (d ≥ 25 nm). EM shows intact rHDL as discoidal particles with 〈d〉 = 9.6 nm stacked on edge (illustrated in a cartoon), which is characteristic of the negative stain preparations. EM of the heated particles shows stacks of collapsed SUVs (d ~ 30 nm) that are products of rHDL fusion. (B) Thermal denaturation of rHDL monitored by CD at 222 nm for α-helical unfolding. The samples (0.02 mg/mL protein in 10 mM sodium phosphate, pH 7.5) were heated and cooled from 5 to 98 °C at a rate of 11 °C/h. The apparent melting temperature (Tm,app) corresponding to the inflection point in the heating curve is indicated. (C) DSC data of rHDL (1 mg/mL protein in standard buffer) were collected upon heating at a rate of 90 °C/h. Tc indicates the peak temperature of the chain melting transition in DMPC. The peak at Tm,app corresponds to thermal denaturation of rHDL. (D) PPC data of rHDL recorded under conditions similar to those used to record the DSC data. The chain melting transition in DPPC is observed at Tc; no peak in αv(T) is detected near Tm,app.
Figure 5.
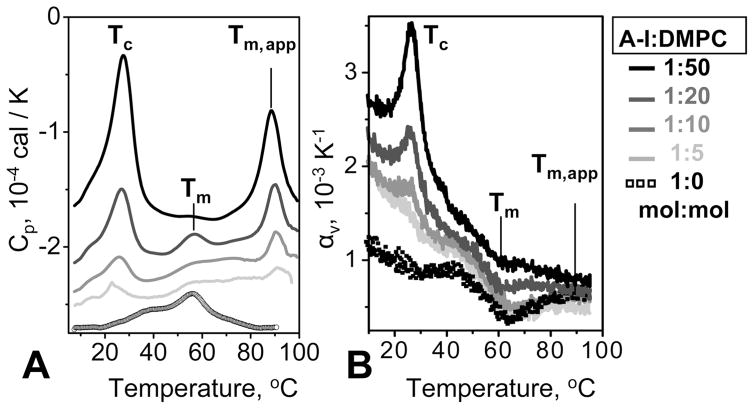
Calorimetric data of apoA-I–DMPC samples differing in protein:lipid ratios. ApoA-I:DMPC molar ratios are indicated. DSC (A) and PPC (B) data were recorded during heating from 5 to 100 °C at rates of 90 and 80 °C/h, respectively. Fresh rHDL samples containing 0.5 mg/mL protein in 10 mM sodium phosphate buffer (pH 7.5) were used in each experiment. The chain melting phase transition at Tc, lipoprotein denaturation at Tm,app, and unfolding of lipid-free and lipid-poor apoA-I at Tm are indicated.
The thermodynamic irreversibility of the heat denaturation of various rHDL, which was reported previously,17,29,36 is evident from the hysteresis in the CD melting data (Figure 4B) and from the observation of lower apparent melting temperatures (Tm,app) at slower heating rates.36 As a result, increasing the heating rate from 11 °C/h (in CD experiments) to 90 °C/h (in DSC experiments) led to an increase in the Tm,app of apoA-I:DPPC:Ch complexes from 88 to 103 °C (Figure 4B,C).
The DSC data of the apoA-I:DPPC:Ch complexes showed two endothermic transitions. The peak at 42 °C reflects the chain melting transition in DPPC,24 and the peak at 103 °C reflects thermal denaturation of rHDL (Figure 4C). The PPC data showed only one peak at 42 °C but no changes in αv(T) at higher temperatures. Thus, similar to the core-containing plasma lipoproteins but in contrast to lipid-free or lipid-poor apoA-I, thermal denaturation of the apoA-I:DPPC:Ch complexes that involves apoA-I unfolding29 shows no changes in αv(T) and, hence, no detectable volume changes. Because changes in volume upon protein unfolding in solution are dominated by protein hydration,19,21 the PPC results in Figures 3 and 4 suggest that in plasma or model lipoproteins these hydration effects may be eliminated.
What is the apolipoprotein hydration behavior in a mixture of rHDL and lipid-free apoA-I? To this end, we used binary mixtures of apoA-I and DMPC varying in protein:lipid ratio from 1:0 (lipid-free apoA-I) to 1:50 (most of apoA-I incorporated into rHDL). In contrast to DPPC (16:0, 16:0), shorter chain PCs such as DMPC (14:0, 14:0) can spontaneously reconstitute with apolipoproteins to form discoidal rHDL. The mixtures of apoA-I and DMPC were incubated overnight at 24 °C to ensure formation of the complex,30 and the size and morphology of the resulting complexes were analyzed by EM and NDGE (Figure S3 of the Supporting Information). The results were in excellent agreement with the earlier study of a similar system and showed formation of discrete populations of rHDL varying in size from ~7.7 to 10 nm (Figure S3 of the Supporting Information) and containing two to three copies of apoA-I.35 Increasing the lipid content led to a gradual increase in the rHDL population and in size redistribution toward larger particles observed by EM and NDGE (Figure S3 of the Supporting Information).
This trend was reflected in the calorimetric data shown in Figure 5. DSC data of lipid-free apoA-I showed a broad peak centered at 60 °C (Tm) corresponding to protein unfolding, while apoA-I:DMPC rHDL showed two characteristic heat capacity peaks. The peak at Tc = 26 °C reflects the chain melting transition in DMPC-containing rHDL, and the peak at 88 °C (Tm,app) reflects heat denaturation of rHDL (ref 29 and references therein). DSC data in Figure 5A show that, in agreement with the earlier study of a similar system,37 increasing the lipid:protein ratio led to a gradual conversion of lipid-free apoA-I into rHDL. PPC data showed a similar trend: an increase in the lipid:protein ratio led to a gradual reduction in the negative peak at 60 °C (Tm) corresponding to the unfolding of lipid-free apoA-I, with a concomitant increase in the positive peak at 26 °C (Tc) corresponding to the DMPC chain melting transition in rHDL (Figure 5B). At a 1:50 apoA-I:DMPC ratio when most of the protein was incorporated into rHDL, the PPC peak that reports on the unfolding of the lipid-free protein nearly disappeared. Importantly, rHDL denaturation, which was observed by DSC at 88 °C (Tm,app), was not detected in the PPC data (Figure 5A,B). Thus, in a mixture of lipid-free apoA-I and apoA-I:DMPC rHDL, changes in volume upon thermal unfolding were observed only in the lipid-free protein.
Analysis of Apolipoprotein Mixtures with Lipid Vesicles
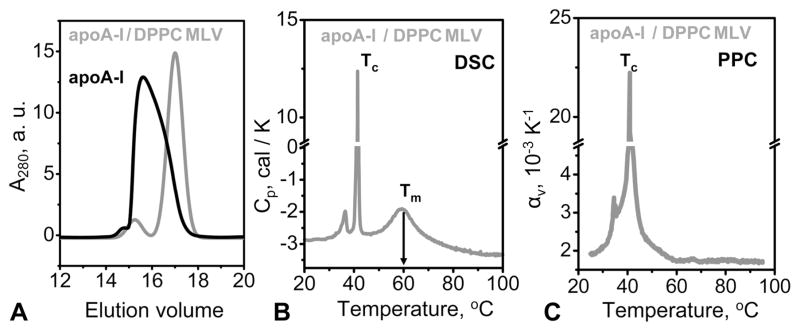
Is formation of a tight protein:lipid complex necessary to eliminate the volume changes during apolipoprotein unfolding observed by PPC? To this end, we first used a mixture of apoA-I and DPPC MLV. DPPC does not spontaneously form lipoproteins upon incubation with apoA-I, as evident from the SEC and NDGE data (Figure 6A and Figure S4A of the Supporting Information). However, SEC data recorded under conditions when apoA-I was substantially self-associated showed that addition of MLV led to a large shift in the apoA-I peak toward smaller species, suggesting dissociation of protein oligomers (black and gray lines in Figure 6A). NDGE results supported this notion and showed distinctly different migration patterns of apoA-I in the absence and presence of DPPC MLV (Figure S4A of the Supporting Information). Hence, even though apoA-I does not spontaneously form tight complexes with DPPC MLV, it creates weak interactions with the lipid surface that help disperse protein oligomers.
Figure 6.
Size-exclusion chromatography and calorimetric data of apoA-I mixed with DPPC MLV. The protein concentration is 0.5 mg/mL in 10 mM sodium phosphate buffer (pH 7.5), and the protein:lipid molar ratio is 1:100. (A) SEC profile of lipid-free apoA-I (black) and a mixture of apoA-I with DPPC MLV (gray). Lipid-free apoA-I at 0.5 mg/mL is typically self-associated.38 SEC data indicate that the protein from this batch is predominantly hexameric in solution in the absence of lipid (although the presence of higher-order oligomers cannot be excluded) but becomes largely monomeric in the presence of DPPC MLV. (B) DSC data recorded during heating from 5 to 100 °C at a rate of 90 °C/h. The peak at Tc = 42 °C with a pre-transition at 37 °C is characteristic of the chain melting transition in DPPC MLV. The peak at 60 °C (Tm) reflects apoA-I unfolding in solution. (C) PPC data recorded under conditions similar to those used to record the DSC data. Because of the large amplitude and width of the PPC peak corresponding to the chain melting transition at 42 °C (Tc), the protein unfolding transition at 60°C cannot be resolved.
To test whether these weak protein–lipid surface interactions affect protein stability, we recorded heating and cooling data of the apoA-I mixture with DPPC MLV (1:100 protein:lipid molar ratio) by CD at 222 nm to monitor α-helical unfolding (Figure S4B of the Supporting Information). These data could be superimposed with similar data recorded from lipid-free apoA-I in solution under otherwise identical conditions, indicating that the protein stability did not change in the presence of DPPC MLV. This was confirmed by DSC of the apoA-I mixture with DPPC MLV that showed two endothermic transitions (Figure 6B). The sharp heat capacity peak at 42 °C (Tc) with the pre-transition at 37 °C, which is characteristic of the chain melting transition in DPPC MLV (ref 24 and references therein), could be fully superimposed with a similar peak recorded from DPPC MLV alone (not shown). This is consistent with the absence of spontaneous remodeling of DPPC MLV by apoA-I. The broad peak centered at Tm = 60 °C (Figure 6B) reflects unfolding of lipid-free apoA-I (ref 27 and references therein). Therefore, the apoA-I unfolding assessed by CD and DSC is not affected by the presence of DPPC MLV.
The PPC data recorded from the apoA-I mixture with DPPC MLV showed only one dominant peak at Tc = 42 °C corresponding to the chain melting transition in MLV (Figure 6C). The shoulder of this large peak could potentially mask the much smaller PPC peak corresponding to apoA-I unfolding at Tm = 60 °C. To clearly resolve these two peaks by PPC, we used a mixture of lipid-free apoA-I and POPC SUV. POPC was chosen because it does not spontaneously reconstitute with apoA-I to form rHDL and has a low Tc = −4 °C, which helps resolve the lipid chain melting from the protein unfolding transition. Furthermore, POPC (16:0, 16:1) is representative of HDL phospholipids, most of which also contain 16–18 carbon acyl chains with at least one double bond in the sn-2 position. SUV were used because, in contrast to MLV, all phospholipid head-groups in SUV are solvent-exposed and available for interactions with the protein. This allowed us to use lower lipid concentrations in the PPC experiments, which helped observe the volume effects during protein unfolding (Figure 7).
Figure 7.
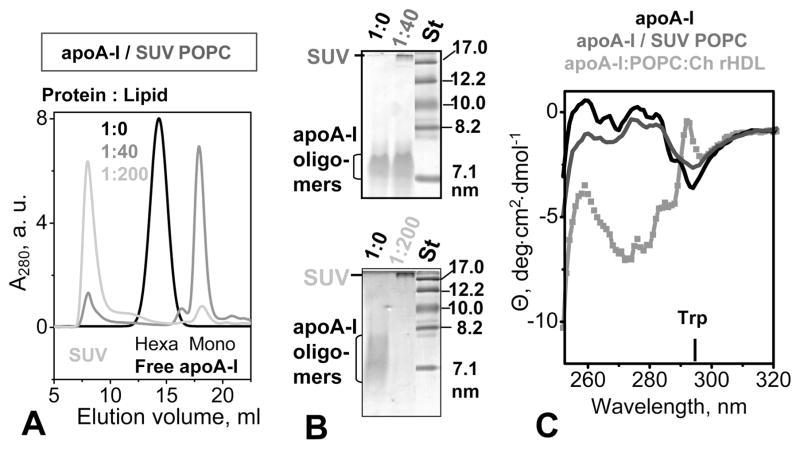
Adsorption of apoA-I to POPC SUV assessed by size-exclusion chromatography, nondenaturing gel electrophoresis, and near-UV circular dichroism. The protein concentration was 0.5 mg/mL in 10 mM sodium phosphate buffer saline (pH 7.5). Protein:lipid molar ratios are 1:0 (lipid-free protein, black), 1:40 (gray), and 1:200 (light gray). (A) SEC shows that apoA-I is self-associated (hexameric) in the lipid-free sate but becomes predominantly monomeric in the presence of SUV. An increase in POPC concentration leads to a progressive increase in the level of SUV-bound apoA-I, with a concomitant decrease in the level of the free protein. (B) NDGE (4 to 20% gradient) of two different batches of apoA-I at a 1:0, 1:40, or 1:200 protein:lipid molar ratio. Bands corresponding to lipid-free oligomeric apoA-I and SUV-associated apoA-I are indicated. (C) Near-UV CD spectra of apoA-I in solution that is lipid-free (black) or contains POPC SUV at a 1:200 protein:lipid ratio (dark gray). The spectrum of rHDL comprised of apoA-I, POPC, and cholesterol, which was recorded under similar buffer conditions and protein concentrations, is shown for comparison (light gray). The CD peak at 295 nm corresponding to Trp is indicated.
To test for protein–lipid association, we subjected the mixtures of apoA-I with POPC SUV to SEC and NDGE. The results showed that at a 1:40 apoA-I:POPC molar ratio, most of the protein was free in solution, with only a small fraction (~15%) associated with SUV (Figure 7A). In contrast, at a 200:1 lipid: protein ratio, nearly all protein (~90%) was associated with SUV (Figure 7A,B). SEC data clearly show that such progressive protein–lipid association caused no detectable shift in the SUV peak (gray lines in Figure 7A), indicating the absence of progressive apoA-I-induced remodeling of SUV (25–30 nm) into smaller rHDL (~10 nm). This result was confirmed by NDGE (Figure 7B, central lane) and EM (data not shown). Taken together, our SEC and EM data showed that adhesion of apoA-I to the SUV surface does not remodel SUV into smaller lipoproteins.
To test whether adhesion to POPC SUV affects protein conformation, we used far- and near-UV CD spectroscopy. Far-UV CD spectra of apoA-I that was free in solution or associated with SUV fully overlapped, indicating that SUV did not induce any secondary structural changes in apoA-I (data not shown). Near-UV CD spectra of apoA-I in solution in the presence and absence of SUV could be superimposed in the wavelength range above 280 nm that is dominated by Trp. Consequently, no insertion of Trp into the lipid bilayer takes place upon adhesion of apoA-I to POPC SUV. In contrast, near-UV CD of plasma HDL and various apoA-I-containing rHDL, including apoA-I:POPC complexes, showed large spectral changes, including a change in sign of the peak at 295 nm corresponding to Trp (Figure 7C). This reflects rearrangement of the aromatic groups when the protein is transferred from solution to lipoprotein, including the four Trp residues located in the N-terminal half of apoA-I. We conclude that, in contrast to aromatic repacking upon formation of tight lipoprotein complexes, adsorption of apoA-I to SUV does not cause any large conformational changes in the protein, particularly in its N-terminal part.
Consistent with this notion, far-UV CD melting data from apoA-I that was free in solution or adsorbed to POPC SUV fully superimposed (Figure S5 of the Supporting Information), indicating that adsorption of protein to SUV did not affect its thermal stability. Furthermore, the heating and cooling CD data of the mixture of apoA-I with SUV showed no hysteresis (Figure S5 of the Supporting Information) and no scan rate effects, indicating reversible protein unfolding. This contrasts with the hysteresis and large scan rate effects observed in the melting data of rHDL and HDL, which are hallmarks of irreversible kinetically controlled transitions (Figure 4B).14,18,29,36 Hence, in contrast to irreversible unfolding of apoA-I in lipoproteins, the unfolding of free apoA-I in solution or in the presence of POPC SUV is thermodynamically reversible. Taken together, our results are consistent with the adsorption of apoA-I to the vesicle surface, as opposed to penetration of the protein into the lipid surface which involves high kinetic barriers.39
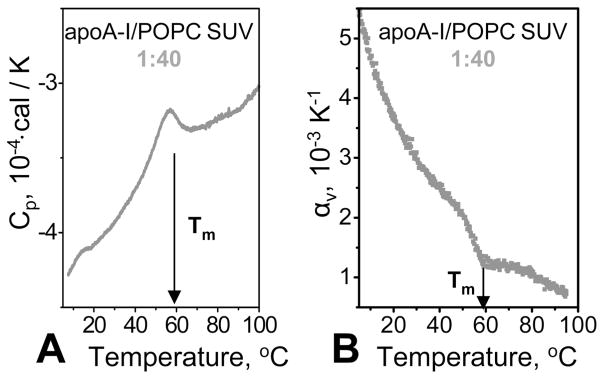
Next, we recorded DSC and PPC data of a mixture of apoA-I with POPC SUV. Because of instrumental limitations of VP-DSC, such data could be recorded only by using a lipid:protein molar ratio of no more than 40:1 while maintaining a protein concentration of at least 0.5 mg/mL that is necessary to monitor apoA-I unfolding by PPC.27 This lipid:protein ratio is close to that found in rHDL; hence, sufficient lipid was present in the samples to significantly affect apolipoprotein hydration. Nevertheless, the calorimetric data of apoA-I that was free in solution27 or in the presence of SUV were similar and showed endothermic protein unfolding at Tm = 60 °C observed by DSC, accompanied by a negative volume change observed by PPC (Figure 8A,B). Consequently, the presence of the available lipid surface did not eliminate the volume effects in protein unfolding. We conclude that apoA-I retains its hydration upon adsorption to the phospholipid surface.
Figure 8.
Calorimetric data of apoA-I in a solution containing POPC SUV. The protein:lipid molar ratio was 1:40; the protein concentration was 0.5 mg/mL in 10 mM sodium phosphate buffer saline, pH 7.5. The samples were heated from 5 to 100 °C at a rate of 90 °C/h in DSC (A) or 80 °C/h in PPC (B). Tm indicates the temperature of apoA-I unfolding.
DISCUSSION
The PPC analysis reported here reveals a surprising result: apolipoprotein unfolding during lipoprotein heat denaturation involves no detectable changes in expansion coefficient αv(T) and, hence, no detectable volume changes. This result was observed in a variety of lipoproteins, including model discoidal and plasma spherical HDL containing exchangeable apoA-I as their sole or main protein, plasma LDL containing the non-exchangeable apoB as their main protein, and plasma VLDL containing both exchangeable (apoE and apoCs) and non-exchangeable (apoB) proteins (Figures 3 and 4 and Figure S1 of the Supporting Information). The absence of volume changes in the lipid moiety of these lipoproteins near Tm,app is not surprising, because these lipids do not undergo phase transitions in the temperature range of lipoprotein denaturation. The absence of volume changes upon protein unfolding in lipoproteins was unexpected and was in stark contrast with the relatively large negative volume change (ΔV/V ≅ −0.3%) observed upon unfolding of lipid-free apoA-I in solution27 or in the presence of lipid vesicles (Figure 8).
What is the physical origin of the lack of changes in αv(T) upon lipoprotein heat denaturation monitored by PPC? One possibility is that the negative and positive volume changes resulting from changes in hydration of the charged, polar, and apolar groups cancel out, an effect observed in a variant of staphylococcal nuclease.22 However, such a coincidence is extremely unlikely to occur in a wide variety of lipoproteins studied in our work. Another possibility is that ΔVunf(Tm) decreases at higher Tm because of the increased thermal disorder in the solvent.40 This probably contributes to a reduction in ΔVunf upon unfolding of apoA-I in highly thermostable lipoproteins, such as human HDL or apoA-I:DPPC:Ch rHDL, which show Tm,app near 100 °C (Figures 3B and 4C). However, this effect cannot explain the lack of volume changes observed in less thermostable lipoproteins, such as LDL, VLDL, or apoA-I: DMPC rHDL, that show lower Tm,app from about 60 to 90 °C.
Another possible reason for the lack of observable changes in αv(T) is the slow rate constant k(T) and irreversible character of lipoprotein denaturation. If the relaxation time of the transition, τ = 1/k(T), is much longer than the pressure pulse used in the PPC experiments (30–60 s), the extent of the reaction during the pressure pulse may not be sufficient to produce heat effects observed by PPC. Furthermore, in an irreversible transition, the heat effect is expected to be observed upon pressure increase but not necessarily pressure release. This limits the applicability of PPC for the analysis of slow irreversible transitions, such as lipoprotein heat denaturation. Our spectroscopic temperature-jump studies showed that the rate constant of lipoprotein denaturation k(T) rapidly increases with temperature and is associated with a high Arrhenius activation energy (enthalpy) Ea of 25–50 kcal/mol.14,46 As a result, at T < Tm,app for the DSC transitions, the relaxation time of the reaction is τ = 10–1000 min, too slow to be detected by PPC; however, at T > Tm,app, lipoprotein heat denaturation occurs on a time scale of minutes to seconds, which is amenable to PPC analysis (see Figure S6 of the Supporting Information for additional details). Together, these data suggest that the absence of observable changes in αv(T) of lipoproteins at T > Tm,app cannot be attributed solely to the slow transition kinetics.
Another possible explanation for the lack of volume changes at high temperatures is the absence of large changes in hydration during lipoprotein heat denaturation. This explanation is consistent with the fluorescence spectra showing that, in the heat-denatured lipoproteins, the Trp residues remain substantially sequestered from the solvent (Figure S7 of the Supporting Information). If correct, this implies that thermal remodeling of lipoproteins, which includes unfolding and partial dissociation of the protein, along with lipoprotein fusion and rupture, does not involve substantial transient solvent exposure of apolar protein or lipid groups (Figure 2). This explains why the kinetic barriers involved in lipoprotein remodeling are dominated by enthalpy that results from the transient disruption of the protein and lipid packing interactions during protein dissociation and lipoprotein fusion (Figure 2) (ref 18 and references therein). Importantly, the absence of detectable volume changes at high temperatures does not necessarily apply to ambient temperatures at which the volume changes should be tested by other methods such as pressure denaturation.47,48
Another result of this study is the preferential adsorption of lipid-free apoA-I to the phospholipid surface. Such adsorption was detected by SEC in the mixtures of apoA-I and DPPC MLV (Figure 6A) and by SEC and NDGE of the apoA-I/POPC SUV mixtures (Figure 7A,B). Adsorption of apoA-I to the phospholipid surface was also reported in several earlier studies that used optical and spectroscopic techniques together with isothermal titration calorimetry.39,41,42 Our CD and DSC data show that such adsorption has no detectable effect on the protein thermal stability or unfolding reversibility (Figures S4 and S5 of the Supporting Information and Figure 8A) and, hence, does not involve high kinetic barriers characteristic of penetration of the protein into the phospholipid surface. Furthermore, CD and PPC data (Figures 7C and 8B) suggest that the protein conformation and hydration remain intact upon adsorption of apoA-I to POPC SUV. Because apolipoprotein hydration is dominated by charged groups,27 the water-mediated adsorption of apoA-I to the phospholipid surface is probably driven, in part, by electrostatic interactions; a similar conclusion was reached in the earlier studies that used alternative current polarography.41 Hydrophobic interactions are also expected to be important, particularly those involving the apolar C-terminal part of apoA-I that forms the primary lipid binding site and is critical for self-association (ref 39 and references therein). Two lines of evidence indicate the importance of hydrophobic interactions for adsorption of apoA-I to the phospholipid surface: such adsorption disrupts apoA-I oligomers, as indicated by SEC and NDGE (Figures 6A and 7B), and is abolished upon deletion of the highly hydrophobic C-terminal segment of residues 190–243 from apoA-I.43 We conclude that both electrostatic and hydrophobic protein–lipid interactions are involved in adsorption of apoA-I to the phospholipid surface.
In addition to the HDL-bound protein that comprises more than 90% of all plasma apoA-I, ~5% of apoA-I is present as monomolecular lipid-poor species.44 This species is particularly metabolically active and is key to HDL biogenesis, because it interacts with the ABCA-1 transporter on the plasma membrane of peripheral cells and forms the primary acceptor for cell cholesterol (refs 4 and 45 and references therein). We speculate that lipid-poor apoA-I that dissociates from HDL is preferentially absorbed to the cell surface, which helps recruit apoA-I for interactions with ABCA-I at an obligatory early step of HDL biogenesis
Supplementary Material
Acknowledgments
Funding Sources
This work was supported by National Institutes of Health Grants RO1 GM 067260 and HL 026355.
We thank Michael Gigliotti and Cheryl England for help with lipoprotein and apolipoprotein isolation, Donald L. Gantz for expert help with electron microscopy, Drs. Giorgio Cavigiolio and Sangeeta Benjwal for useful advice regarding rHDL characterization and PPC analysis, and Drs. David Atkinson and Donald M. Small for helpful discussions. We also thank the reviewers for their extremely helpful comments and suggestions.
ABBREVIATIONS
- HDL
high-density lipoprotein
- rHDL
reconstituted HDL
- LDL
low-density lipoprotein
- VLDL
very low-density lipoprotein
- apo
apolipoprotein
- PC
phosphatidylcholine
- DMPC
dimyristoyl PC (14:0, 14:0)
- DPPC
dipalmitoyl PC (16:0, 16:0)
- POPC
palmitoyl oleoyl PC (16:0, 16:1)
- MLV
multilamellar vesicles
- Ch
unesterified cholesterol
- DSC
differential scanning calorimetry
- PPC
pressure perturbation calorimetry
- CD
circular dichroism
- EM
electron microscopy
- NDGE
nondenaturing gel electrophoresis
- SEC
size-exclusion chromatography
Footnotes
Partial specific volumes of apolipoprotein–lipid complexes and their volume expansion coefficients at 5, 40, and 80 °C; thermal remodeling of human VLDL; biochemical and size characterization of model rHDL; effects of lipid vesicles on the self-association and thermal stability of human apoA-I; isothermal scans recorded by VP-DSC from LDL and apoA-I; and Trp emission spectra of intact and heated apoA-I, HDL, and LDL. This material is available free of charge via the Internet at http://pubs.acs.org.
References
- 1.Lund-Katz S, Phillips MC. High density lipoprotein structure-function and role in reverse cholesterol transport. Subcell Biochem. 2010;51:183–227. doi: 10.1007/978-90-481-8622-8_7. [DOI] [PMC free article] [PubMed] [Google Scholar]
- 2.Liu Y, Atkinson D. Enhancing the contrast of ApoB to locate the surface components in the 3D density map of human LDL. J Mol Biol. 2011;405:274–283. doi: 10.1016/j.jmb.2010.10.034. [DOI] [PMC free article] [PubMed] [Google Scholar]
- 3.Rye KA, Bursill CA, Lambert G, Tabet F, Barter PJ. The metabolism and anti-atherogenic properties of HDL. J Lipid Res. 2009;50:S195–S200. doi: 10.1194/jlr.R800034-JLR200. [DOI] [PMC free article] [PubMed] [Google Scholar]
- 4.Yvan-Charvet L, Wang N, Tall AR. Role of HDL, ABCA1, and ABCG1 transporters in cholesterol efflux and immune responses. Arterioscler Thromb Vasc Biol. 2010;30:139–143. doi: 10.1161/ATVBAHA.108.179283. [DOI] [PMC free article] [PubMed] [Google Scholar]
- 5.Assmann G, Gotto AM., Jr HDL cholesterol and protective factors in atherosclerosis. Circulation. 2004;109(23 Suppl 1):III8–III14. doi: 10.1161/01.CIR.0000131512.50667.46. [DOI] [PubMed] [Google Scholar]
- 6.Barter PJ, Rye KA. Relationship between the concentration and antiatherogenic activity of high-density lipoproteins. Curr Opin Lipidol. 2006;17:399–403. doi: 10.1097/01.mol.0000236365.40969.af. [DOI] [PubMed] [Google Scholar]
- 7.Watkins H, Farrall M. Genetic susceptibility to coronary artery disease: From promise to progress. Nat Rev Genet. 2006;7:163–173. doi: 10.1038/nrg1805. [DOI] [PubMed] [Google Scholar]
- 8.Lusis AJ. Atherosclerosis. Nature. 2000;407:233–241. doi: 10.1038/35025203. [DOI] [PMC free article] [PubMed] [Google Scholar]
- 9.Olofsson SO, Boren J. Apolipoprotein B: A clinically important apolipoprotein which assembles atherogenic lipoproteins and promotes the development of atherosclerosis. J Intern Med. 2005;258:395–410. doi: 10.1111/j.1365-2796.2005.01556.x. [DOI] [PubMed] [Google Scholar]
- 10.Havel RJ. Triglyceride-rich lipoproteins and plasma lipid transport. Arterioscler Thromb Vasc Biol. 2010;30:9–19. doi: 10.1161/ATVBAHA.108.178756. [DOI] [PubMed] [Google Scholar]
- 11.Dallinga-Thie GM, Franssen R, Mooij HL, Visser ME, Hassing HC, Peelman F, Kastelein JJ, Péterfy M, Nieuwdorp M. The metabolism of triglyceride-rich lipoproteins revisited: New players, new insights. Atherosclerosis. 2010;211:1–8. doi: 10.1016/j.atherosclerosis.2009.12.027. [DOI] [PMC free article] [PubMed] [Google Scholar]
- 12.Rye KA, Clay MA, Barter PJ. Remodelling of high density lipoproteins by plasma factors. Atherosclerosis. 1999;145:227–238. doi: 10.1016/s0021-9150(99)00150-1. [DOI] [PubMed] [Google Scholar]
- 13.Mehta R, Gantz DL, Gursky O. Human plasma high-density lipoproteins are stabilized by kinetic factors. J Mol Biol. 2003;328:183–192. doi: 10.1016/s0022-2836(03)00155-4. [DOI] [PubMed] [Google Scholar]
- 14.Jayaraman S, Gantz DL, Gursky O. Effects of salt on thermal stability of human plasma high-density lipoproteins. Biochemistry. 2006;45:4620–4628. doi: 10.1021/bi0524565. [DOI] [PubMed] [Google Scholar]
- 15.Jayaraman S, Gantz DL, Gursky O. Structural basis for thermal stability of human low-density lipoprotein. Biochemistry. 2005;44:3965–3971. doi: 10.1021/bi047493v. [DOI] [PubMed] [Google Scholar]
- 16.Guha M, England CO, Herscovitz H, Gursky O. Thermal transitions in human very low-density lipoprotein: Fusion, rupture and dissociation of HDL-like particles. Biochemistry. 2007;46:6043–6049. doi: 10.1021/bi7001532. [DOI] [PMC free article] [PubMed] [Google Scholar]
- 17.Guha M, Gao X, Jayaraman S, Gursky O. Structural stability and functional remodeling of high-density lipoproteins: The importance of being disordered. Biochemistry. 2008;47:11393–11397. doi: 10.1021/bi8014746. [DOI] [PMC free article] [PubMed] [Google Scholar]
- 18.Guha M, Gantz DL, Gursky O. Effect of fatty acyl chain length, unsaturation and pH on the stability of discoidal high-density lipoproteins. J Lipid Res. 2008;49:1752–1761. doi: 10.1194/jlr.M800106-JLR200. [DOI] [PMC free article] [PubMed] [Google Scholar]
- 19.Lin LN, Brandts JF, Brandts JM, Plotnikov V. Determination of the volumetric properties of proteins and other solutes using pressure perturbation calorimetry. Anal Biochem. 2002;302:144–160. doi: 10.1006/abio.2001.5524. [DOI] [PubMed] [Google Scholar]
- 20.Heerklotz PD. Pressure perturbation calorimetry. Methods Mol Biol. 2007;400:197–206. doi: 10.1007/978-1-59745-519-0_13. [DOI] [PubMed] [Google Scholar]
- 21.Mitra L, Smolin N, Ravindra R, Royer C, Winter R. Pressure perturbation calorimetric studies of the solvation properties and the thermal unfolding of proteins in solution–experiments and theoretical interpretation. Phys Chem Chem Phys. 2006;8:1249–1265. doi: 10.1039/b516608j. [DOI] [PubMed] [Google Scholar]
- 22.Mitra L, Rouget JB, Garcia-Moreno B, Royer CA, Winter R. Towards a quantitative understanding of protein hydration and volumetric properties. ChemPhysChem. 2008;9:2715–2721. doi: 10.1002/cphc.200800405. [DOI] [PubMed] [Google Scholar]
- 23.Heerklotz H, Seelig J. Application of pressure perturbation calorimetry to lipid bilayers. Biophys J. 2002;82:1445–1452. doi: 10.1016/S0006-3495(02)75498-2. [DOI] [PMC free article] [PubMed] [Google Scholar]
- 24.Wang SL, Epand RM. Factors determining pressure perturbation calorimetry measurements: Evidence for the formation of metastable states at lipid phase transitions. Chem Phys Lipids. 2004;129:21–30. doi: 10.1016/j.chemphyslip.2003.09.017. [DOI] [PubMed] [Google Scholar]
- 25.Heerklotz H, Tsamaloukas A. Gradual change or phase transition: Characterizing fluid lipid-cholesterol membranes on the basis of thermal volume changes. Biophys J. 2006;91:600–607. doi: 10.1529/biophysj.106.082669. [DOI] [PMC free article] [PubMed] [Google Scholar]
- 26.Krivanek R, Okoro L, Winter R. Effect of cholesterol and ergosterol on the compressibility and volume fluctuations of phospholipid-sterol bilayers in the critical point region: A molecular acoustic and calorimetric study. Biophys J. 2008;94:3538–3548. doi: 10.1529/biophysj.107.122549. [DOI] [PMC free article] [PubMed] [Google Scholar]
- 27.Benjwal S, Gursky O. Pressure perturbation calorimetry of apolipoproteins in solution and in model lipoproteins. Proteins. 2010;78:1175–1185. doi: 10.1002/prot.22637. [DOI] [PMC free article] [PubMed] [Google Scholar]
- 28.Schumaker VN, Puppione DL. Sequential flotation ultracentrifugation. Methods Enzymol. 1986;128:155–170. doi: 10.1016/0076-6879(86)28066-0. [DOI] [PubMed] [Google Scholar]
- 29.Jayaraman S, Benjwal S, Gantz DL, Gursky O. Effects of cholesterol on thermal stability of discoidal high density lipoproteins. J Lipid Res. 2010;51:324–333. doi: 10.1194/jlr.M000117. [DOI] [PMC free article] [PubMed] [Google Scholar]
- 30.Jonas A. Reconstitution of high-density lipoproteins. Methods Enzymol. 1986;128:553–582. doi: 10.1016/0076-6879(86)28092-1. [DOI] [PubMed] [Google Scholar]
- 31.Folch J, Lees M, Sloane Stanley GH. A simple method for the isolation and purification of total lipids from animal tissues. J Biol Chem. 1957;226:497–509. [PubMed] [Google Scholar]
- 32.Prassl R, Pregetter M, Amenitsch H, Kriechbaum M, Schwarzenbacher R, Chapman JM, Laggner P. Low density lipoproteins as circulating fast temperature sensors. PLoS One. 2008;3(12):e4079. doi: 10.1371/journal.pone.0004079. [DOI] [PMC free article] [PubMed] [Google Scholar]
- 33.Liu Y, Luo D, Atkinson D. Human LDL core cholesterol ester packing: Three-dimensional image reconstruction and SAXS simulation studies. J Lipid Res. 2011;52(2):256–262. doi: 10.1194/jlr.M011569. [DOI] [PMC free article] [PubMed] [Google Scholar]
- 34.Hale JH, Schroeder F. Differential scanning calorimetry and fluorescence probe investigation of very low density lipoprotein from the isolated perfused rat liver. J Lipid Res. 1981;22:838–851. [PubMed] [Google Scholar]
- 35.Cavigiolio G, Shao B, Geier EG, Ren G, Heinecke JW, Oda MN. The interplay between size, morphology, stability, and functionality of high-density lipoprotein subclasses. Biochemistry. 2008;47:4770–4779. doi: 10.1021/bi7023354. [DOI] [PMC free article] [PubMed] [Google Scholar]
- 36.Gursky O, Ranjana M, Gantz DL. Complex of human apolipoprotein C-1 with phospholipid: Thermodynamic or kinetic stability? Biochemistry. 2002;41:7373–7384. doi: 10.1021/bi025588w. [DOI] [PubMed] [Google Scholar]
- 37.Tall AR, Small DM, Shipley GG, Lees RS. Apoprotein stability and lipid-protein interactions in human plasma high density lipoproteins. Proc Natl Acad Sci USA. 1975;72:4940–4942. doi: 10.1073/pnas.72.12.4940. [DOI] [PMC free article] [PubMed] [Google Scholar]
- 38.Vitello LB, Scanu AM. Studies on human serum high density lipoproteins. Self-association of apolipoprotein A-I in aqueous solutions. J Biol Chem. 1976;251:1131–1136. [PubMed] [Google Scholar]
- 39.Saito H, Dhanasekaran P, Nguyen D, Holvoet P, Lund-Katz S, Phillips MC. Domain structure and lipid interaction in human apolipoproteins A-I and E, a general model. J Biol Chem. 2003;278:23227–23232. doi: 10.1074/jbc.M303365200. [DOI] [PubMed] [Google Scholar]
- 40.Schweiker KL, Fitz VW, Makhatadze GI. Universal convergence of the specific volume changes of globular proteins upon unfolding. Biochemistry. 2009;48:10846–10851. doi: 10.1021/bi901220u. [DOI] [PubMed] [Google Scholar]
- 41.Lecompte MF, Bras AC, Dousset N, Portas I, Salvayre R, Ayrault-Jarrier M. Binding steps of apolipoprotein A-I with phospholipid monolayers: Adsorption and penetration. Biochemistry. 1998;37:16165–16171. doi: 10.1021/bi9813072. [DOI] [PubMed] [Google Scholar]
- 42.Arnulphi C, Sánchez SA, Tricerri MA, Gratton E, Jonas A. Interaction of human apolipoprotein A-I with model membranes exhibiting lipid domains. Biophys J. 2005;89:285–295. doi: 10.1529/biophysj.104.047480. [DOI] [PMC free article] [PubMed] [Google Scholar]
- 43.Saito H, Dhanasekaran P, Nguyen D, Deridder E, Holvoet P, Lund-Katz S, Phillips MC. α-Helix formation is required for high affinity binding of human apolipoprotein A-I to lipids. J Biol Chem. 2004;279:20974–20981. doi: 10.1074/jbc.M402043200. [DOI] [PubMed] [Google Scholar]
- 44.Rye KA, Barter PJ. Formation and metabolism of pre-β-migrating, lipid-poor apolipoprotein A-I. Arterioscler. Thromb Vasc Biol. 2004;24:421–428. doi: 10.1161/01.ATV.0000104029.74961.f5. [DOI] [PubMed] [Google Scholar]
- 45.Sparks DL, Frank PG, Braschi S, Neville TA, Marcel YL. Effect of apolipoprotein A-I lipidation on the formation and function of pre- and α-migrating LpA-I particles. Biochemistry. 1999;38:1727–1735. doi: 10.1021/bi981945k. [DOI] [PubMed] [Google Scholar]
- 46.Jayaraman S, Gantz DL, Gursky O. Kinetic stabilization and fusion of apolipoprotein A-2:DMPC disks: Comparison with apoA-1 and apoC-1. Biophys J. 2005;88(4):2907–2918. doi: 10.1529/biophysj.104.055921. [DOI] [PMC free article] [PubMed] [Google Scholar]
- 47.Mantulin WW, Pownall HJ. Reversible folding reactions of human apolipoprotein A-I: Pressure and guanidinium chloride effects. Biochim Biophys Acta. 1985;836(2):215–221. doi: 10.1016/0005-2760(85)90069-4. [DOI] [PubMed] [Google Scholar]
- 48.Jasuja R, Ulloor J, Yengo CM, Choong K, Istomin AY, Livesay DR, Jacobs DJ, Swerdloff RS, Miksovská J, Larsen RW, Bhasin S. Kinetic and thermodynamic characterization of dihydrotestosterone-induced conformational perturbations in androgen receptor ligand-binding domain. Mol Endocrinol. 2009;23(8):1231–1241. doi: 10.1210/me.2008-0304. [DOI] [PMC free article] [PubMed] [Google Scholar]
Associated Data
This section collects any data citations, data availability statements, or supplementary materials included in this article.


