ABSTRACT
The prophage-encoded Shiga toxin is a major virulence factor in Stx-producing Escherichia coli (STEC). Toxin production and phage production are linked and occur after induction of the RecA-dependent SOS response. However, food-related stress and Stx-prophage induction have not been studied at the single-cell level. This study investigated the effects of abiotic environmental stress on stx expression by single-cell quantification of gene expression in STEC O104:H4 Δstx2::gfp::ampr. In addition, the effect of stress on production of phage particles was determined. The lethality of stressors, including heat, HCl, lactic acid, hydrogen peroxide, and high hydrostatic pressure, was selected to reduce cell counts by 1 to 2 log CFU/ml. The integrity of the bacterial membrane after exposure to stress was measured by propidium iodide (PI). The fluorescent signals of green fluorescent protein (GFP) and PI were quantified by flow cytometry. The mechanism of prophage induction by stress was evaluated by relative gene expression of recA and cell morphology. Acid (pH < 3.5) and H2O2 (2.5 mM) induced the expression of stx2 in about 18% and 3% of the population, respectively. The mechanism of prophage induction by acid differs from that of induction by H2O2. H2O2 induction but not acid induction corresponded to production of infectious phage particles, upregulation of recA, and cell filamentation. Pressure (200 MPa) or heat did not induce the Stx2-encoding prophage (Stx2-prophage). Overall, the quantification method developed in this study allowed investigation of prophage induction and physiological properties at the single-cell level. H2O2 and acids mediate different pathways to induce Stx2-prophage.
IMPORTANCE Induction of the Stx-prophage in STEC results in production of phage particles and Stx and thus relates to virulence as well as the transduction of virulence genes. This study developed a method for a detection of the induction of Stx-prophages at the single-cell level; membrane permeability and an indication of SOS response to environmental stress were additionally assessed. H2O2 and mitomycin C induced expression of the prophage and activated a SOS response. In contrast, HCl and lactic acid induced the Stx-prophage but not the SOS response. The lifestyle of STEC exposes the organism to intestinal and extraintestinal environments that impose oxidative and acid stress. A more thorough understanding of the influence of food processing-related stressors on Stx-prophage expression thus facilitates control of STEC in food systems by minimizing prophage induction during food production and storage.
KEYWORDS: single-cell detection, E. coli O104:H4, prophage induction, environmental stress, RecA-independent SOS response, membrane permeability, STEC, Shiga toxin, Shiga toxin-producing E. coli
INTRODUCTION
Shiga toxin-producing Escherichia coli (STEC) causes the life-threatening hemolytic-uremic syndrome (HUS), which is associated with acute renal failure and significant mortality (1, 2). Shiga toxins (Stx) include Stx1 and Stx2; Stx2 is the more potent of the two toxins, causing renal failure (2). Shiga toxins are N-glycosidases that remove one adenine from 28S rRNA, block binding of aminoacyl-tRNA to the ribosome, and thus inhibit protein synthesis, inducing apoptosis in human renal cell and tissue (3, 4). The genes encoding Stx (stx) are located on a lambdoid prophage (5). The production of Stx is dependent on the expression of the Stx-encoding prophage (Stx-prophage). Induction to the lytic cycle lyses the host cell, releasing toxins and phage particles (5, 6). Stx-phages can create novel STEC organisms by lysogenic infection. A STEC outbreak with more than 4,000 cases and 50 deaths in Germany in 2011 provides a prominent example for the evolution of novel pathotypes by transduction of stx genes (7, 8). The outbreak strain is a novel pathotype with the serotype O104:H4, combining the virulence factors of STEC and enteroaggregative E. coli (EAEC) (7). Stx2-phages can also establish lysogeny in non-STEC, including enteropathogenic, enteroinvasive, and enterotoxigenic E. coli and commensal E. coli strains in vitro (9–11). This demonstrates that Stx2-phages have a broad host range among strains of E. coli.
Production of Stx2-phages and production of Stx2 are controlled by the phage late gene promoter. The lysogenic state is maintained by the phage repressor CI (12, 13). Expression of stx2 and prophage induction result from proteolytic cleavage of the CI repressor. Many agents that induce prophages also induce the SOS response (14, 15). Induction of the SOS response is due to the cleavage of the LexA repressor by the RecA nucleoprotein, which is formed by RecA and single-stranded DNA (16). Cleavage of LexA derepresses over 30 genes for DNA repair and inhibition of cell division. CI repressors are also destroyed by RecA activation, leading to prophage induction (17).
Environmental stress encountered by E. coli in the human intestine or in food processing also induces Stx-prophages (18–20). Human neutrophils in the intestine release antibacterial molecules, including H2O2, which stimulate Stx and phage production (19). The Stx-phage released in the intestine may transduce to commensal strains and thus amplify toxin production and exacerbate disease symptoms (10). Hydrostatic pressure, a physical method of food preservation, also induces Stx prophages (18, 21). Prophage induction in any of the ecological niches populated by STEC drives horizontal gene transfer by release of infectious phage particles that allows transduction of Shiga toxin-negative phages and thus disseminates genes coding for the Shiga toxin in intestinal and food systems. This study aimed to evaluate the effect of different stress on Stx2-prophage induction and SOS response in an outbreak strain that caused significant mortality and morbidity (7, 8). To quantify stx2 expression, stx2 was replaced with the gene (gfp) that encodes green fluorescent protein (GFP) in STEC O104:H4. Flow cytometry was used to measure the fluorescence signals to determine the stress response of the E. coli culture at the single-cell level.
RESULTS
Generation and validation of E. coli O104:H4 Δstx2::gfp::ampr.
To quantify the expression of the stx2 during stress, stx2 was replaced by gfp as fluorescent reporter gene; ampr was used as a selection marker to screen mutants. PCR amplification and sequencing confirmed that the stx2 was replaced with gfp and ampr in E. coli O104:H4 Δstx2::gfp::ampr. The transcription of gfp and stx2 in response to stress was determined by reverse transcription (RT)-quantitative PCR (qPCR). Mitomycin C increased expression of stx2 and gfp about 5-fold (see Fig. S1 in the supplemental material). The levels of expression of stx2 in the wild-type strain relative to gfp expression in the mutant strain under stress and control conditions were 0.76 ± 0.034 and 0.68 ± 0.26, respectively. Levels of expression of stx2 and gfp under induced and uninduced conditions were not different (P > 0.05), demonstrating that the relative expression of gfp was equivalent to the expression of stx2 in response to mitomycin C.
Quantification of prophage induction by mitomycin C.
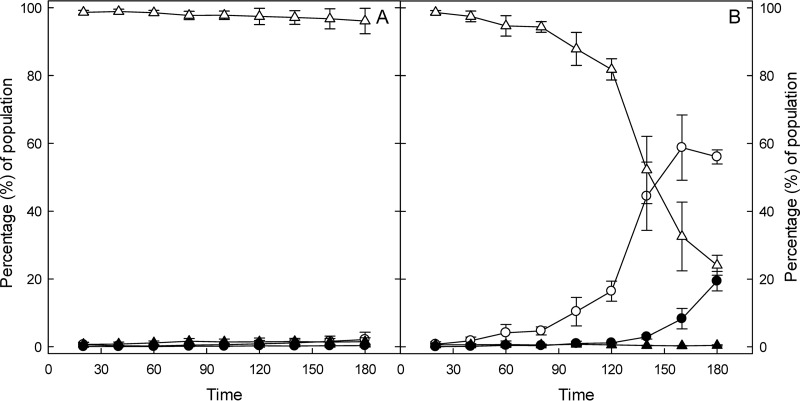
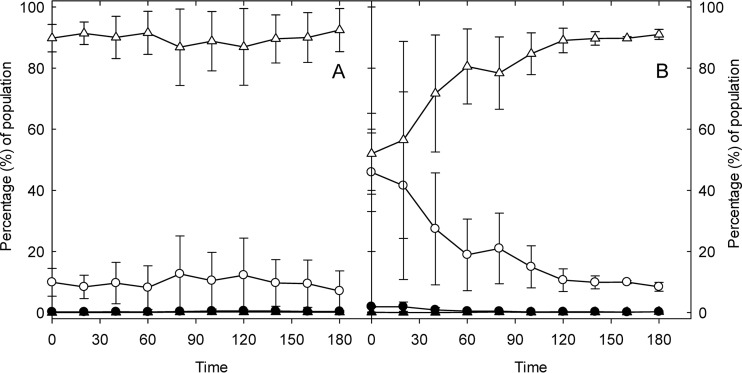
Mitomycin C causes cross-links of double-stranded DNA, activates an SOS response, and induces cell filamentation and phage production (22, 23). Exposure of E. coli O104:H4 Δstx2::gfp::ampr to mitomycin C for 2 and 3 h induced gfp expression in 17 and 56% of cells of the population, respectively (Fig. 1). Of the cells that expressed GFP after 3 h of treatment with mitomycin C, 19.4% were also filamented, confirming that mitomycin C induced an SOS response.
FIG 1.
Flow cytometric quantification of gfp fluorescence in E. coli O104:H4 Δstx2::gfp::ampr in LB or after induction by mitomycin C. Exponential-phase E. coli O104:H4 Δstx2::gfp::ampr cultures were incubated in LB (A) or incubated after addition of mitomycin C to a concentration of 0.5 mg/liter (B). At each time point, the bacterial culture was harvested and the proportion of GFP fluorescent and filamented cells was quantified by flow cytometry. The gating for forward light scatter and GFP expression was set to account more than 96% of the cells in the control as normal sized and GFP negative. ○ and ●, GFP-positive cells; △ and ▲, GFP-negative cells. Open symbols, normal-sized cells; closed symbols, filamented cells. Data represent means ± standard deviations from three independent experiments.
Stress resistance of E. coli O104:H4 Δstx2::gfp::ampr.
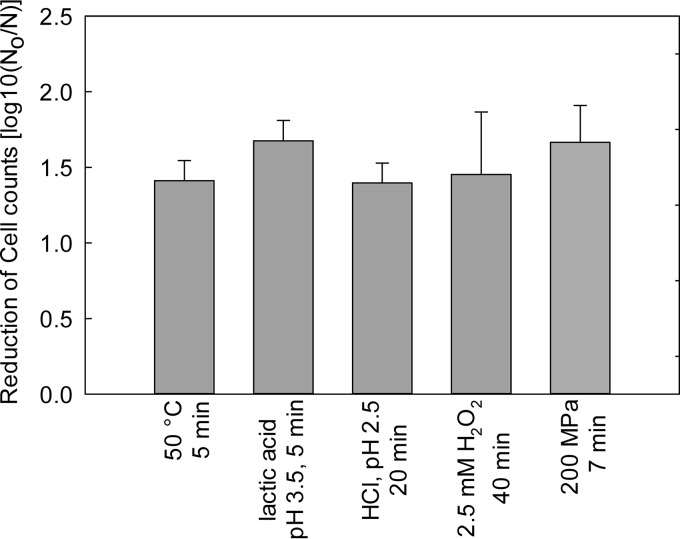
The effect of environmental stress on expression of stx2 and induction of the Stx2-prophage was evaluated with stressors related to food preservation, which included heat, oxidative and acid stress, and pressure. To compare levels of prophage expression in response to different stressors, each stress was applied to reduce bacterial cell counts by 1 to 2 log CFU/ml (Fig. 2).
FIG 2.
Reduction of cell counts of E. coli O104:H4 Δstx2::gfp::ampr after exposure to heat, acid, and oxidative stress or to 200 MPa. Data represent means ± standard deviations from three independent experiments.
Effect of heat and hydrogen peroxide on membrane permeability and GFP expression in E. coli O104:H4 Δstx2::gfp::ampr.
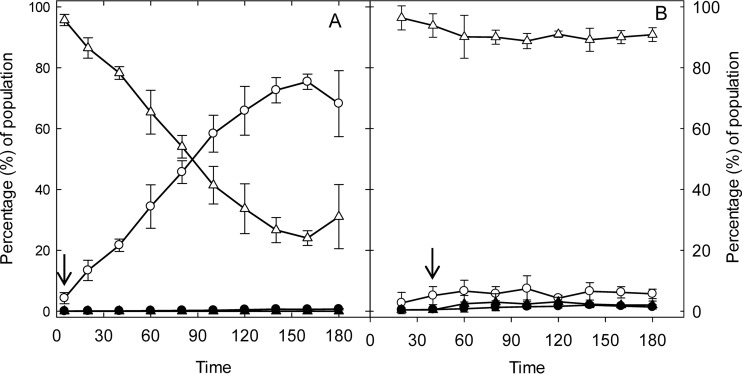
Prophage expression and loss of membrane permeability were simultaneously assessed at the single-cell level by flow cytometric determination of GFP and propidium iodide (PI) fluorescence, respectively. The changes of the GFP-expressing and PI-permeable proportions of the population were measured over 3 h of exposure to stress (Fig. 3), corresponding to the time required for full GFP induction with mitomycin C. In control cultures, less than 3% of the cells expressed GFP or were stained with PI (data not shown). Exposure to 50°C for 3 h increased membrane permeability in 64% of the cells but did not induce GFP (Fig. 3A). Exposure to 2.5 mM H2O2 for 3 h increased membrane permeability in less than 10% of cells and induced GFP in 3% of the cells (Fig. 3B). Of note, treatment of E. coli O104:H4 Δstx2::gfp::ampr with H2O2 for 3 h reduced viable cell counts by more than 6 log CFU/ml without increasing membrane permeability.
FIG 3.
Effect of heat and H2O2 on gfp expression and membrane permeability in E. coli O104:H4 Δstx2::gfp::ampr. Exponential-phase E. coli O104:H4 Δstx2::gfp::ampr cultures were incubated in LB broth at 37°C (not shown), at 50°C (A), or at 37°C with addition of 2.5 mM H2O2 (B) for 3 h. At each time point, the bacterial culture was diluted and stained with PI. GFP and PI fluorescence was quantified by flow cytometry. Control conditions did not alter the GFP expression or the membrane permeability of cells (Fig. 1 and data not shown). ○ and ●, PI permeable; △ and ▲, PI impermeable. Open symbols, GFP negative; closed symbols, GFP positive. An arrow indicates the time when treatment reduced cell counts by 1 to 2 log CFU/ml. Data represent means ± standard deviations from three independent experiments.
Effect of acids on membrane permeability and GFP expression in E. coli O104:H4 Δstx2::gfp::ampr.
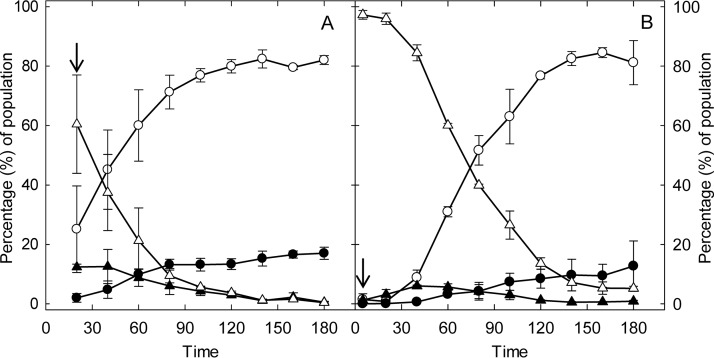
The effect of HCl and lactic acid on GFP expression and membrane permeability in E. coli O104:H4 Δstx2::gfp::ampr is shown in Fig. 4. HCl induced GFP in a higher proportion of cells (12%) than did lactic acid, which induced GFP in 6% of cells. During treatment with HCl, a GFP-positive and PI-negative population appeared after 20 to 40 min of treatment but decreased from 12 to 0.5% during subsequent incubation. Correspondingly, a GFP- and PI-positive population increased from 2 to 17% between 40 and 180 min of incubation (Fig. 4A). A similar trend was observed for lactic acid treatment, where the GFP-positive and PI-negative population dropped to less than 1% after 40 min of treatment, while the GFP- and PI-positive population increased to 12.7% (Fig. 4B). These data indicate that GFP was expressed first but GFP-expressing cells lost membrane integrity and likely viability during subsequent incubation under acid conditions.
FIG 4.
Effect of HCl and lactic acid on gfp expression and membrane permeability in E. coli O104:H4 Δstx2::gfp::ampr. Exponential-phase E. coli O104:H4 Δstx2:::gfp::ampr cultures were incubated in LB broth (not shown), in LB acidified with HCl to pH 2.5 (A), or in LB acidified with lactic acid to pH 3.5 (B) for 3 h. At each time point, the bacterial culture was diluted and stained with PI. GFP and PI fluorescence was quantified by flow cytometry. Control conditions did not alter the GFP expression or the membrane permeability of cells (Fig. 1 and data not shown). ○ and ●, PI permeable; △ and ▲, PI impermeable. Open symbols, GFP negative; closed symbols, GFP positive. An arrow indicates the time when treatment reduced cell counts by 1 to 2 log CFU/ml. Data represent means ± standard deviations from three independent experiments.
Effect of pressure on membrane permeability and GFP expression in E. coli O104:H4 Δstx2::gfp::ampr.
The effect of pressure on GFP expression and membrane permeability in E. coli O104:H4 Δstx2::gfp::ampr is shown in Fig. 5. Control cultures were heat sealed in sample tubing and stored at ambient pressure and temperature; here, the membrane integrity was compromised in around 10% of the population even without pressure treatment (Fig. 5A). After treatment with 200 MPa for 7 min, 2% of the population was positive for GFP and PI. During recovery at ambient pressure and 37°C for 3 h, the proportion of cells with damaged membranes decreased owing to membrane repair or to growth of surviving cells, and GFP-positive cells were not detected.
FIG 5.
Effect of pressure on gfp expression and membrane permeability in E. coli O104:H4 Δstx2::gfp::ampr. Exponential-phase E. coli O104:H4 Δstx2::gfp::ampr cultures in LB broth were heat sealed in tubes and incubated at 37°C (A) or heat sealed in tubes and incubated at 200 MPa at 20°C for 7 min, followed by incubation at 37°C and ambient pressure for 3 h (B). At each time point, the bacterial culture was diluted and stained with PI. GFP and PI fluorescence was quantified by flow cytometry. ○ and ●, PI permeable; △ and ▲, PI impermeable. Open symbols, GFP negative; closed symbols, GFP positive. Pressure treatment reduced cell counts by 1 to 2 log CFU/ml. Data represent means ± standard deviations from three independent experiments.
Effect of acids and H2O2 on phage production in wild-type E. coli O104:H4 and E. coli O104:H4 Δstx2::gfp::ampr.
To determine whether induction of gfp and stx2 also leads to release of infectious phage particles, spot-on-lawn assays were carried out after induction with diverse stressors (Table 1). Filtrates isolated from control cultures and acid-stressed cultures of the mutant and wild-type strains did not contain infectious phage particles. In contrast, phages that were lytic to E. coli DH5α were isolated from the wild-type and mutant strains after mitomycin C and H2O2 treatments, indicating the presence of infectious phages.
TABLE 1.
Detection of infectious phage particles in culture filtrates of E. coli O104:H4 and E. coli O104:H4 Δstx2::gfp::ampra
| Treatment | Presence of infectious phage particles in culture filtrate of: |
|
|---|---|---|
| E. coli O104:H4 | E. coli O104:H4 Δstx2::gfp::ampr | |
| None (unstressed control) | − | − |
| Mitomycin C | + | + |
| H2O2 | + | + |
| HCl | − | − |
| Lactic acid | − | − |
The presence of infectious phage particles was assessed by a spot agar assay. +, observation of a clear halo indicative of infectious phage particles; −, growth in the presence of culture filtrate, indicative of the absence of infectious phages.
Cell morphology of stress-treated cells.
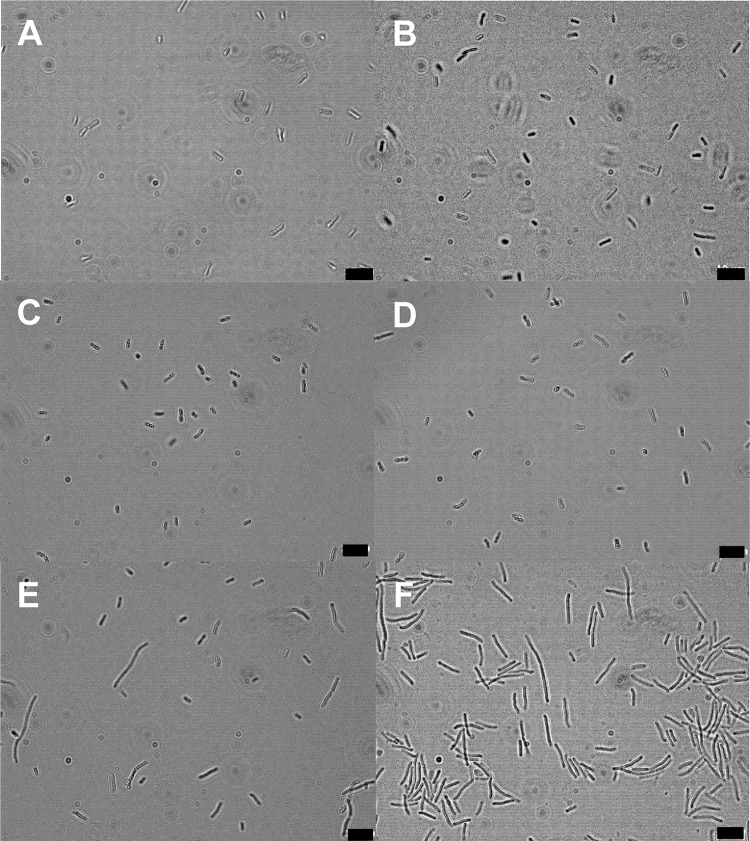
To determine whether GFP expression in E. coli O104:H4 Δstx2::gfp::ampr is linked to the SOS response, the morphologies of untreated and stressed cells were compared by microscopic observation. The SOS response inhibits cell division and causes filamentation (22, 23). No morphological changes were observed after treatment with HCl (pH 2.5), lactic acid (pH 3.5), or high hydrostatic pressure (HHP) (200 MPa) (Fig. 6). However, after the treatment with mitomycin C and H2O2, some of the cells formed filaments (Fig. 6E and F).
FIG 6.
Effect of stress on cell morphology of E. coli O104:H4 Δstx2::gfp::ampr as observed by phase-contrast microscopy. Shown are untreated exponential-phase cells (A) and exponential-phase cells treated with 200 MPa for 40 min (B), with HCl for 1 h (C), with lactic acid for 20 min (D), with 2.5 mM H2O2 for 1 h (E), and with mitomycin (0.5 mg/liter) for 3 h (F). Five pictures per sample were analyzed, corresponding to 500 to 1,000 cells per sample. Three biological replicates were done for each treatment. Scale bars represent 10 μm.
Effect of environmental stress on recA expression.
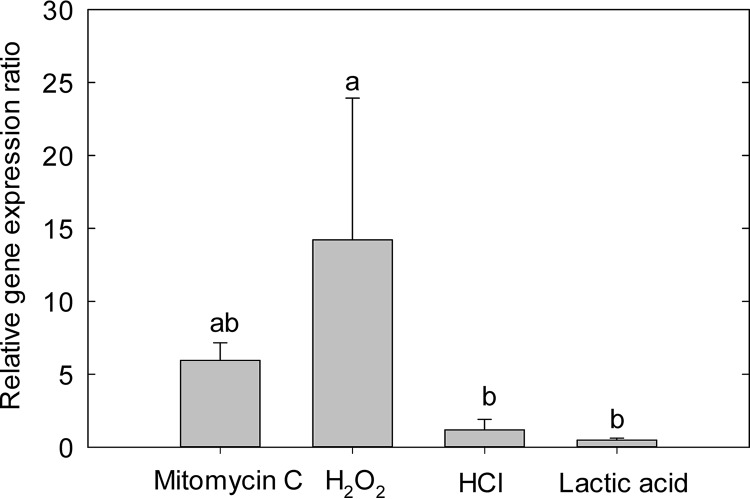
To further confirm the link between GFP expression and the SOS response in response to stress, we also evaluated the expression of recA (Fig. 7). Mitomycin C and H2O2 induced expression of recA; however, acid treatment did not affect recA expression. These results indicate that mitomycin C and H2O2 activated the SOS response, which corresponds to the microscopic observation of cell filamentation as an indicator of an induction of the SOS response (Fig. 6 and 7). However, stressors inducing recA did not overlap with conditions inducing GFP.
FIG 7.
Expression of recA in E. coli O104:H4 Δstx2::gfp::ampr after stress treatments. Relative gene expression was quantified by RT-qPCR with gapA as a housekeeping gene and exponential cultures in LB broth as reference conditions. Exponential-phase cultures were treated with LB broth containing mitomycin C (0.5 mg/liter) or H2O2 (2.5 mM) for 40 min or with acidified LB broth with HCl or lactic acid for 20 min. Values for different treatments that do not share lowercase letters are significantly different (P < 0.05). Data represent means ± standard errors of the means from four independent experiments.
DISCUSSION
The induction of the Stx-prophage regulates toxin and phage production, which is integral to virulence of STEC (5). We developed a method for simultaneous detection of the expression of Stx2 prophages, changes of membrane permeability, and the induction of the SOS response. This novel tool was used to assess the role of environmental and food-related stressors on the induction of Stx2-prophage and the SOS response.
Classical techniques for the evaluation prophage induction employ plaque assays (21, 24), protein assays (6, 10), and quantification of gene expression (25); however, these methods inform only on prophage induction at a population level. Using a fluorescent reporter gene to replace stx2 was done in previous studies to investigate the induction of Stx2 prophages (6, 26). We developed a single-cell detection method using flow cytometry to assess the induction of Stx2-prophage and the SOS response by quantification of GFP and determination of cell morphology (27). We also combined the fluorescence probe PI with flow cytometry to measure membrane permeability. Treatment with H2O2 reduced cell counts without disrupting membrane permeability. The link of prophage induction to the SOS response was further confirmed by quantification of recA expression. Mitomycin C was used as a positive control to induce both the prophage (18, 26) and the SOS response (28). Results from flow cytometry, microscopic observation of the cell morphology, and the quantification of recA expression all confirmed that mitomycin C induced the SOS response (Fig. 1, 6, and 7). Using the method described above, we found that HCl and lactic acid induced the Stx2-prophage without overexpression of recA, indicating that mechanisms of acid-induced Stx2-prophage induction differ from those for induction by from H2O2 or mitomycin C.
RecA-dependent cleavage of the phage repressor CI is considered necessary for induction of the prophage. The peroxide-induced SOS response leading to cell filamentation (29), RecA-dependent gene regulation (29–31), and prophage induction (21, 26) is well documented. The present study additionally documents RecA-independent induction of the Stx2-converting prophage. RecA-independent induction may relate to conformational changes of the repressor at low cytoplasmic pH. At low pH, the SOS response repressor (LexA) undergoes structural reorganization, causing LexA self-cleavage independent of RecA (32). Since the amino acid sequence of the C-terminal domain of the lambdoid repressor shares roughly 50% similarity with the sequence of LexA, a similar pattern of repressor tetramerization may account for the induction of expression of genes carried by Stx2-prophages in acid-stressed cells.
The single-cell detection of Stx2-prophage expression also demonstrated that prophage induction occurred in only a fraction of the STEC population. The results affirm the bacterial “altruism” hypothesis proposed by Łos et al. (33), who proposed that only a small fraction of the STEC population switches from to the lytic cycle in response to stress. This sacrifice of a small percentage of cells produces sufficient Stx to kill eukaryotic unicellular predators and warrants survival of the remainder of the population (33). Protozoa kill their bacterial prey with reactive oxygen species; oxidative stress also induces Stx production as a self-defense mechanism for STEC (33, 34). H2O2 (2.5 mM) induced the expression of Stx2 and production of the Stx2-phage by a small percentage of the population (this study). This result conforms to prior data that indicated that H2O2 induced the prophage in up to 1.6% of STEC cells (21). Protozoa occur in significant numbers in the intestinal microbiota of ruminants. It was hypothesized that predation by protozoa in the ruminant intestinal tract provides selective pressure for maintenance of Stx2-prophages in commensal E. coli and thus results in a high proportion of STEC in cattle (35).
STEC may encounter low pH during gastric transit, in food fermentations, and after application of acids as a pathogen intervention step in meat production. Stomach acidity provides a barrier against bacterial infection; the pH in the stomach can be as low as 1.5 to 3.0 (36, 37). Lactic acid contributes to low-pH conditions during food fermentation and are commonly used as food processing aids (37, 38). The present study found that HCl of pH 2.5 and lactic acid of pH 3.5 induced the expression of stx2; however, low pH did not result in release of infectious phage particles. Induction of Stx2-prophages by 2.5% sodium citrate also induced Stx expression without formation of infective phage particles (39). Low pH interferes with phage infectivity by inhibition of the formation of Stx2-prophages or by inactivation of phages after correct assembly and release (40, 41). Induction of Stx production without release of infectious phages may benefit E. coli in defense against predatory protozoa (35) but is not of concern for food safety.
Contaminated food and water are major vehicles for STEC infection of humans. Ruminants, particularly cattle, are primary reservoirs of STEC and thus are a major source of STEC contamination of foods and water (42). Lactic acid (2%) and peroxyacetic acid containing 1 to 5% H2O2 are used commercially in North America to decontaminate the surfaces of beef carcasses and fresh vegetables (38, 43). Stx-phages were found in high numbers on processed beef and salad (44). Because pathogen intervention steps in food processing include acid, oxidative stress, and pressure, it is conceivable that induction of the Stx2-prophage occurs in food processing (18, 21, 26).
In conclusion, the present study developed a method to achieve simultaneous quantification of prophage induction and physiological characteristics of STEC at the single-cell level. H2O2 and low pH induced the Shiga toxin-encoding prophage; induction by acid stress was not dependent on RecA or the SOS response and did not result in release of infectious phage particles. Oxidative stress and acid stress are encountered in human and animal gastrointestinal tracts and in food processing. H2O2 treatment of foods contaminated with STEC may induce the Stx2-prophage and thus promote Stx2-phage transduction. Heat treatment eliminates STEC without inducing Stx-prophage. This study improved knowledge on the mechanism of prophage induction in E. coli by different stressors. Because genomes of Stx-prophages are highly variable, the study also enables further investigation to understand the ecological features of STEC and different Stx-prophages in different ecological niches.
MATERIALS AND METHODS
Bacterial strains and growth conditions.
E. coli O104:H4, E. coli O104:H4 Δstx2::gfp::ampr, and E. coli DH5α (Table 2) were grown aerobically at 37°C on Luria-Bertani (LB) medium (BD, Mississauga, Canada). Ampicillin (100 mg/liter) and chloramphenicol (34 mg/liter) were added for maintenance of plasmids pUC19 and pKOV, respectively. Stationary-phase E. coli organisms were obtained by overnight incubation at 37°C; exponential-phase cultures were prepared as subcultures (0.01%) of overnight cultures and incubated to an optical density at 600 nm (OD600) of 0.4 to 0.5.
TABLE 2.
Bacterial strains and plasmids used in this study
| Strain or plasmid | Descriptiona | Reference or source |
|---|---|---|
| E. coli strains | ||
| O104:H4 | Stx2-producing and enteroaggregative strain of E. coli, related to Germany outbreak in 2011 | 55 |
| O104:H4 Δstx2::gfp::ampr | E. coli O104:H4 with replacement of stx2 with gfp and ampr | This study |
| DH5α | Cloning host for plasmids | New England BioLabs |
| Plasmids | ||
| pUC19 | lacZ promoter; cloning vector; Ampr | New England BioLabs |
| pEGFP | lac promoter carrying gfp | 20 |
| pKOV | Temperature-sensitive pSC101; SacB Cmr | 45 |
| pUC19-A | pUC19 plasmid containing homolog A (954 bp) in the upstream region of stx2 in E. coli O104:H4; Ampr | This study |
| pUC19-B | pUC19 plasmid containing a homolog B (852 bp) in the downstream region of stx2 in E. coli O104:H4; Ampr | This study |
| pUC19-A:B | pUC19 plasmid containing homologs A and B in the up- and downstream regions of stx2 in E. coli O104:H4; Ampr | This study |
| pUC19A:gfp:B | pUC19 plasmid containing two homologs and gfp; Ampr | This study |
| pUC19A:gfp:ampr:B | pUC19 plasmid containing two homologs and gfp and ampr; Ampr | This study |
| pKOVΔstx2:gfp:ampr | pKOV plasmid containing two homologs, gfp, ampr, and the 1.8-kb flanking region of E. coli O104:H4; Ampr Cmr | This study |
Ampr, ampicillin resistant; Cmr, chloramphenicol resistant.
Generation of E. coli O104:H4 Δstx2::gfp::ampr.
The method for stx2 replacement with gfp::ampr was adapted from that of Link et al. (45). Primers and plasmids used in this study are listed in Tables 2 and 3. PCRs were carried out using Taq DNA polymerase (TaKaRa Bio, Shiga, Japan). Two homologous sequences, A and B, in the upstream and downstream regions of stx2 from E. coli O104:H4, respectively, were amplified with primers that contain restriction sites on both ends. Homologs A and B were digested with BamHI and XbaI and with XbaI and PstI, respectively. The resulting fragments were sequentially ligated into vector pUC19 to generate pUC19A:B. The fragment of gfp was extracted from gels with NcoI- and XbaI-digested plasmids (pEGFP) and ligated into pUC19A:B to create pUC19A:gfp:B. ampr was amplified by PCR from pUC19 and digested with NruI. The resulting fragments were purified with a gel purification kit (Qiagen, Mississauga, Canada) and ligated into pUC19A:gfp:B. The allele exchange cassette A:gfp:ampr:B was subcloned into a low-copy-number plasmid, pKOV, as a BamHI/PstI insert. The resulting recombinant plasmid, pKOVΔstx2:gfp:ampr, was electroporated into E. coli O104:H4, and the transformed strains were recovered at 30°C for 1 h. The cells were plated onto chloramphenicol-LB plates and incubated at 43°C for plasmid integration into the chromosome. The resulting colonies were serially diluted in 0.85% NaCl, plated onto 5% (wt/vol) sucrose-LB plates, and incubated at 30°C for allelic exchange. Colonies grown on 5% sucrose-LB plates were replica plated onto chloramphenicol-LB and 5% sucrose-LB plates at 30°C to screen E. coli O104:H4 Δstx2::gfp::ampr. Gene replacement was confirmed by PCR amplification and sequencing.
TABLE 3.
Primers used in this studya
| Primer use or name | Sequence (5′–3′) containing restriction site | Restriction site(s) |
|---|---|---|
| Primers used for cloning | ||
| Homolog A, upstream of stx2 | F: TAGGATCCCTGTATAGGTAAACGCCTC | BamHI |
| R: TATCTAGATACCATGGTACACTTCATATACACCTGGT | XbaI, NcoI | |
| Homolog B, downstream of stx2 | F: GTTCTAGAGTGCAGTTTAATAATGACTGAGGCATAACCTG | XbaI |
| R: TACTGCAGGCGGCCGCGCTAACTGTTTAATTCG | PstI | |
| ampr | F: ATGTATCGCGATCTAAATACATTCAAA | NurI |
| R: ATGTATCGCGAGAGTAAACTTGGTCTG | NurI | |
| Primers used for confirming mutant strains | ||
| Stx2A′, F | TTATATCTGCGCCGGGTCTG | |
| Stx2B′, R | ACCCACATACCACGAAGCAG | |
| Primer used for quantification of gene expression | ||
| stx2 | F: TATCCTATTCCCGGGAGTTT | |
| R: TGCTCAATAATCAGACGAAGAT | ||
| gfp | F: TTCTTCAAGTCCGCCATG | |
| R: TGAAACGGCCTTGTGTAGTATC | ||
| gapA | F: GTTGACCTGACCGTTCGTCT | |
| R: TGAAACGGCCTTGTGTAGTATC | ||
| recA | F: ATTGGTGTGATGTTCGGTAA | |
| R: GCCGTAGAGGATCTGAAATT |
F, forward; R, reverse. Restriction sites are underlined.
Quantification of gene expression of stx2 and gfp.
Mitomycin C was used to induce Stx2-prophage (46, 47). Exponential-phase cultures were centrifuged and resuspended in LB broth with addition of mitomycin C (Sigma-Aldrich, St. Louis, MO) to a concentration of 0.5 mg/liter, followed by incubation at 37°C for 1 h. Corresponding treatment of cultures without addition of mitomycin C served as a control. After treatment, cells were harvested from samples and controls to quantify gene expression. RNA was isolated using RNAprotect bacterial reagent and the RNAeasy minikit (Qiagen) and was reverse transcribed to cDNA with a QuantiTect reverse transcription kit (Qiagen) by following the manufacturer's protocols. The expression of genes in E. coli O104:H4 and its mutant were quantified using SYBR green reagent (Qiagen) and performed with real-time PCR (7500 Fast; Applied Biosystems, Foster City, CA). Negative controls included DNase-treated RNA and nontemplate controls. The gene coding for glyceraldehyde-3-phosphate dehydrogenase A (gapA) served as the reference gene. The gene expression ratio of stx2 in E. coli O104:H4 (wild type) relative to gfp in E. coli O104:H4Δstx2::gfp::ampr (mutant) under induced and control conditions was calculated according to reference 48, with rearrangements to account for the different PCR efficiencies of gfp and stx2 amplification:
| (1) |
where E is the PCR efficiency of PCRs with primers targeting stx, gfp, or gapA and CP is the threshold cycle for E. coli strains under induced and control conditions. The primers used for quantification of gene expression are listed in Table 3. Results are presented as means ± standard deviations (SD) for five biological replicates.
Inactivation of E. coli by physical and chemical stressors.
Exponential-phase cultures were harvested and treated with heat, oxidative or acid stress, or pressure. To compare the diverse physical and chemical stressors, treatment intensity and times were selected to reduce cell counts by 90 to 99%. Cells were heated by heating 100 μl of culture to 50°C for 5 min in a PCR cycler; control cultures were maintained at 37°C. Samples were kept on ice before determination of cell counts. Oxidative stress was induced by addition of H2O2 (Sigma-Aldrich, St. Louis, MO) to a final concentration of 2.5 mM, followed by incubation for 40 min at 37°C. Control cultures were maintained for 40 min at 37°C without additives. Acid stress was determined with LB broth adjusted to pH 2.5 with 1 M HCl (Sigma-Aldrich) or pH 3.5 with 1 M dl-lactic acid (Sigma-Aldrich). Cells were resuspended in LB broth at pH 2.5 and incubated for 20 min or in LB broth pH 3.5 and incubated for 5 min. Control cultures were maintained in LB broth at 37°C. Pressure treatments were performed as described previously (49). In brief, 120 μl of culture was transferred into sterile 3.3-cm tubing (E3603; Fisher Scientific, Akron, OH) and heat sealed at both ends. The samples were treated at 200 MPa and 20°C for 7 min. The rate of compression and decompression was 270 MPa/min. Control cultures were transferred to plastic tubing, heat sealed, and incubated at ambient pressure and temperature for 15 min. Cell counts after treatments with heat, acids, HHP, and the respective controls were determined by surface plating of appropriate dilutions on LB agar. H2O2-treated samples were diluted with 0.2% (wt/vol) sodium thiosulfate (Sigma-Aldrich) as an H2O2 neutralizer; all other samples were diluted with 0.85% NaCl. Reductions in bacterial counts for all stress treatments were expressed as log N0/N, where N0 and N are cell counts from untreated and treated cultures, respectively. Results are presented as means ± SD for three biological replicates analyzed in duplicate.
Membrane permeability.
The membrane-impermeant nucleic acid binding dye propidium iodide (PI) (Sigma-Aldrich) (50, 51) was used to label cells with permeabilized membranes. The optimum PI concentration was determined by literature data and microscopic assessment of the fluorescence intensity of stressed cells after mixing with serial 2-fold dilutions of PI. For analyses of membrane permeability, PI was added to the treated samples and the respective controls to a final concentration of 20 μM and incubated at room temperature in the dark for 10 to 15 min.
Flow cytometric determination of GFP fluorescence and FSC.
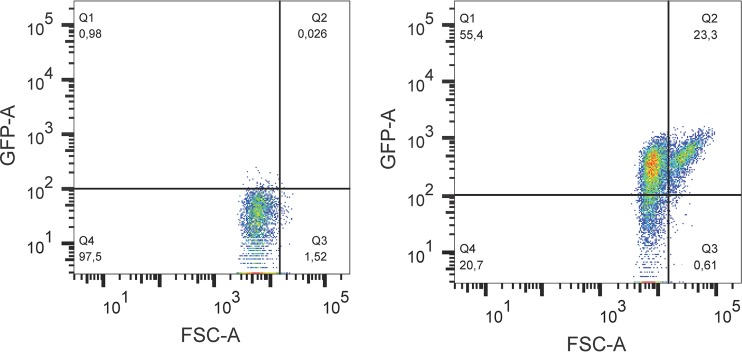
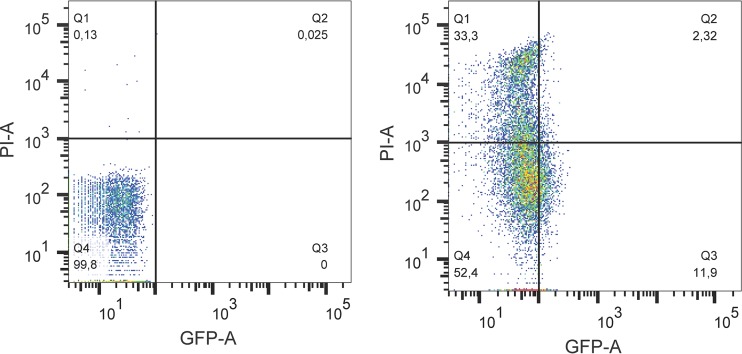
Exponential-phase cultures were treated with mitomycin C (0.5 mg/liter), heat (50°C), HCl (pH 2.5), lactic acid (pH 3.5), or H2O2 (2.5 mM) over 3 h. Pressure-treated samples were compressed to 200 MPa for 7 min, followed by incubation at 37°C for 3 h. Control samples were treated in the same manner without stressors. Details of stress treatments are described above. Flow cytometry was performed using a BD LSR-Fortessa X-20 (BD Biosciences, San Jose, CA) equipped with a 488-nm excitation wavelength from a blue air laser at 50 mW and two light scatter detectors measuring forward and side scatter lights. Forward-scattered light (FSC) is proportional to the volume of the cells and was used to evaluate cell filamentation (50, 52, 53). Treated cultures and controls (200 μl) were diluted with 1 ml of 0.85% NaCl for mitomycin C-, heat-, acid-, or pressure-treated samples, or with 1 ml of phosphate-buffered saline (PBS) containing 0.2% (wt/vol) sodium thiosulfate (Sigma-Aldrich) for H2O2-treated samples. Samples were collected at 20-min intervals over 3 h and kept on ice before flow cytometry. Samples were diluted with FACS buffer (1% PBS, 2% fetal calf serum [FCS], 0.02% sodium azide) to exclude pH effects on GFP fluorescence and to maintain the running speeds at no more than 5,000 events per s. Sample injection and acquisition were started simultaneously and continued until 10,000 events were recorded. FSC files were extracted from FACSDiva 8 software and analyzed by FlowJo software (Tree Star, Ashland, OR). Samples treated with mitomycin C were analyzed with respect to GFP fluorescence intensity and forward light scatter. Samples treated with heat, H2O2, acids, and pressure were analyzed with respect to GFP and PI fluorescence intensity. The gating of forward light scatter and GFP fluorescence was set manually to account more than 96% of the cells in controls as normal sized and GFP negative (Fig. 8). The gating for GFP and PI fluorescence intensity was set manually to account more than 97% of the cells in all controls as GFP and PI negative (Fig. 9). Samples were divided into four subpopulations, and the percentage values of four subpopulations for each treatment were calculated. Data are presented as means ± SD for three biological replicates.
FIG 8.
Dot plot of forward scatter and GFP fluorescence for E. coli O104:H4 Δstx2::gfp::ampr grown in LB broth (left panel) or treated with mitomycin C (0.5 mg/liter) for 180 min (right panel). The population was divided into four subpopulations by FSC and GFP reference lines. The reference lines were determined from untreated samples, where at least 96% of the population was GFP negative as shown in Fig. 1B. Percentage values of four populations (Q1, FSC− GFP+; Q2, FSC+ GFP+; Q3, FSC+ GFP−; Q4, FSC− GFP−) were automatically calculated and are presented in the corners of the graphs.
FIG 9.
Example of a dot plot of GFP fluorescence and PI fluorescence for E. coli O104:H4 Δstx2::gfp::ampr grown in LB broth (left panel) or treated with HCl (pH 2.5) for 20 min (right panel). The population was divided into four subpopulations by GFP and PI reference lines. The reference lines were determined from untreated samples, where at least 97% of the population is GFP and PI negative. Percentage values of four populations (Q1, GFP− PI+; Q2, GFP+ PI+; Q3, GFP+ PI−; Q4, GFP− PI−) were automatically calculated and are presented in the corners of the graphs.
Determination of phage production by spot agar assay.
The production of infectious phages in control cultures and stressed cultures was determined by filtration of phage particles, followed by spot agar assay (10, 54). Exponential-phase E. coli O104:H4 Δstx2::gfp::ampr and wild-type E. coli O104:H4 were obtained by subculture in LB broth containing CaCl2 (1 mM) and MgSO4 (10 mM). E. coli strains were stressed with mitomycin C (0.5 g/liter) and H2O2 (2.5 mM) overnight at 37°C, or stressed with HCl (pH 2.5) and lactic acid (pH 3.5) for 20 min, and then neutralized in LB broth and incubated overnight at 37°C. Cultures incubated in LB without additives served as controls. Phage particles were obtained by centrifugation at 5,000 rpm for 10 min, followed by filtration through 0.22-μm filters to remove bacterial cells. E. coli DH5α served as the recipient strain for phage infection. Stationary-phase E. coli DH5α was suspended in LB broth containing containing CaCl2 (1 mM) and MgSO4 (10 mM). A volume of 100 μl of culture was mixed with 3 ml of warm 0.6% LB agar and poured on normal LB agar. Ten-microliter quantities of culture filtrate from mutant and wild-type strains were spotted on the recipient strains after solidification of the top agar. Clear zones that formed after incubation the plate at 37°C overnight were recorded to indicate the production of phage particles.
Quantification of expression of recA.
An exponential-phase culture of E. coli O104:H4 Δstx2::gfp::ampr was treated with LB broth containing mitomycin C (0.5 mg/liter) for 1 h, H2O2 (2.5 mM) for 40 min, and HCl or lactic acid for 20 min. The expression of recA relative to that of uninduced cells was determined with gapA as the housekeeping gene as described above.
Microscopic determination of cell morphology.
Cultures were grown to exponential phase and treated with 0.5 mg/liter of mitomycin C for 3 h and with other stressors for different times up to 1 h (2.5 mM H2O2 and HCl, pH 2.5), 20 min (lactic acid, pH 3.5), or 40 min (200 MPa). At each time point, approximately 20 μl of bacterial culture was examined using transmitted light microscopy (Axio Imager M1m microscope; Carl Zeiss Inc.). The images were acquired at a magnification of ×100 with an AxioCam M1m camera and Axio Vision version 4.8.2.0 software (Carl Zeiss Inc.). Treatment times showing the greatest extent of GFP expression (Fig. 3, 4, and 5) were selected for analysis of cell filamentation.
Statistical analysis.
Gene expression is reported as average values from 4 or 5 independent experiments and is represented by means ± SD. Significant differences of stx2 and gfp gene expression under induced and control conditions were assessed with a t test. The results from determination of recA gene expression after stress treatment were analyzed by one-way analysis of variance, and statistical differences among treatments were determined by Tukey's test using SAS (SAS Institute Inc., Cary, NC). Significant differences among samples or treatments were determined at an error probability of 5% (P < 0.05).
Supplementary Material
ACKNOWLEDGMENTS
We acknowledge the Alberta Livestock and Meat Agency for funding (grant no. 2014H018R); Michael Gänzle acknowledges financial support from the Canada Research Chairs Program.
The Faculty of Medicine and Dentistry Flow Cytometry Facility in the University of Alberta is acknowledged for providing the access and technical support to the flow cytometer.
Footnotes
Supplemental material for this article may be found at https://doi.org/10.1128/AEM.01378-17.
REFERENCES
- 1.Tarr PI, Gordon CA, Chandler WL. 2005. Shiga-toxin-producing Escherichia coli and haemolytic uraemic syndrome. Lancet 365:1073–1086. doi: 10.1016/S0140-6736(05)71144-2. [DOI] [PubMed] [Google Scholar]
- 2.O'Loughlin EV, Robins-Browne RM. 2001. Effect of Shiga toxin and Shiga-like toxins on eukaryotic cells. Microb Infect 3:493–507. doi: 10.1016/S1286-4579(01)01405-8. [DOI] [PubMed] [Google Scholar]
- 3.Obrig TG, Moran TP, Brown JE. 1987. The mode of action of Shiga toxin on peptide elongation of eukaryotic protein synthesis. Biochem J 244:287–294. doi: 10.1042/bj2440287. [DOI] [PMC free article] [PubMed] [Google Scholar]
- 4.Karpman D, Håkansson A, Perez M-TR, Isaksson C, Carlemalm E, Caprioli A, Svanborg C. 1998. Apoptosis of renal cortical cells in the hemolytic-uremic syndrome: in vivo and in vitro studies. Infect Immun 66:636–644. [DOI] [PMC free article] [PubMed] [Google Scholar]
- 5.Waldor MK, Friedman DI. 2005. Phage regulatory circuits and virulence gene expression. Curr Opin Microbiol 8:459–465. doi: 10.1016/j.mib.2005.06.001. [DOI] [PubMed] [Google Scholar]
- 6.Shimizu T, Ohta Y, Noda M. 2009. Shiga toxin 2 is specifically released from bacterial cells by two different mechanisms. Infect Immun 77:2813–2823. doi: 10.1128/IAI.00060-09. [DOI] [PMC free article] [PubMed] [Google Scholar]
- 7.Laing CR, Zhang Y, Gilmour MW, Allen V, Johnson R, Thomas JE, Gannon VP. 2012. A comparison of Shiga-toxin 2 bacteriophage from classical enterohemorrhagic Escherichia coli serotypes and the German E. coli O104:H4 outbreak strain. PLoS One 7:e37362. doi: 10.1371/journal.pone.0037362. [DOI] [PMC free article] [PubMed] [Google Scholar]
- 8.Frank C, Werber D, Cramer JP, Askar M, Faber M, an der Heiden M, Bernard H, Fruth A, Prager R, Spode A, Wadl M, Zoufaly A, Jordan S, Kemper MJ, Follin P, Müller L, King LA, Rosner B, Buchholz U, Stark K, Krause G, HUS Investigation Team. 2011. Epidemic profile of Shiga-toxin–producing Escherichia coli O104:H4 outbreak in Germany. N Engl J Med 365:1771–1780. doi: 10.1056/NEJMoa1106483. [DOI] [PubMed] [Google Scholar]
- 9.Mora A, Herrera A, Lopez C, Dahbi G, Mamani R, Pita JM, Alonso MP, Llovo J, Bernardez MI, Blanco JE, Blanco M, Blanco J. 2011. Characteristics of the Shiga-toxin-producing enteroaggregative Escherichia coli O104:H4 German outbreak strain and of STEC strains isolated in Spain. Int Microbiol 14:121–141. [DOI] [PubMed] [Google Scholar]
- 10.Iversen H, Trine M, Aspholm M, Arnesen LP, Lindbäck T. 2015. Commensal E. coli Stx2 lysogens produce high levels of phages after spontaneous prophage induction. Front Cell Infect Microbiol 5:5. [DOI] [PMC free article] [PubMed] [Google Scholar]
- 11.Leonard SR, Mammel MK, Rasko DA, Lacher DW. 2016. Hybrid Shiga toxin-producing and enterotoxigenic Escherichia species cryptic lineage 1 strain 7v harbors a hybrid plasmid. Appl Environ Microbiol 82:4309–4319. doi: 10.1128/AEM.01129-16. [DOI] [PMC free article] [PubMed] [Google Scholar]
- 12.Neely MN, Friedman DI. 1998. Functional and genetic analysis of regulatory regions of coliphage H-19B: location of Shiga-like toxin and lysis genes suggest a role for phage functions in toxin release. Mol Microbiol 28:1255–1267. doi: 10.1046/j.1365-2958.1998.00890.x. [DOI] [PubMed] [Google Scholar]
- 13.Johnson AD, Poteete AR, Lauer G, Sauer RT, Ackers GK, Ptashne M. 1981. Lambda repressor and cro—components of an efficient molecular switch. Nature 294:217–223. doi: 10.1038/294217a0. [DOI] [PubMed] [Google Scholar]
- 14.Kimmitt PT, Harwood CR, Barer MR. 2000. Toxin gene expression by Shiga toxin-producing Escherichia coli: the role of antibiotics and the bacterial SOS response. Emerg Infect Dis 6:458. doi: 10.3201/eid0605.000503. [DOI] [PMC free article] [PubMed] [Google Scholar]
- 15.Matsushiro A, Sato K, Miyamoto H, Yamamura T, Honda T. 1999. Induction of prophages of enterohemorrhagic Escherichia coli O157:H7 with norfloxacin. J Bacteriol 181:2257–2260. [DOI] [PMC free article] [PubMed] [Google Scholar]
- 16.Little J. 1993. LexA cleavage and other self-processing reactions. J Bacteriol 175:4943. doi: 10.1128/jb.175.16.4943-4950.1993. [DOI] [PMC free article] [PubMed] [Google Scholar]
- 17.Roberts JW, Roberts CW, Craig NL. 1978. Escherichia coli recA gene product inactivates phage lambda repressor. Proc Natl Acad Sci U S A 75:4714–4718. doi: 10.1073/pnas.75.10.4714. [DOI] [PMC free article] [PubMed] [Google Scholar]
- 18.Aertsen A, Faster D, Michiels CW. 2005. Induction of Shiga toxin-converting prophage in Escherichia coli by high hydrostatic pressure. Appl Environ Microbiol 71:1155–1162. doi: 10.1128/AEM.71.3.1155-1162.2005. [DOI] [PMC free article] [PubMed] [Google Scholar]
- 19.Wagner PL, Acheson DW, Waldor MK. 2001. Human neutrophils and their products induce Shiga toxin production by enterohemorrhagic Escherichia coli. Infect Immun 69:1934–1937. doi: 10.1128/IAI.69.3.1934-1937.2001. [DOI] [PMC free article] [PubMed] [Google Scholar]
- 20.Ehrmann M, Scheyhing C, Vogel R. 2001. In vitro stability and expression of green fluorescent protein under high pressure conditions. Lett Appl Microbiol 32:230–234. doi: 10.1046/j.1472-765X.2001.00892.x. [DOI] [PubMed] [Google Scholar]
- 21.Łoś JM, Łoś M, Węgrzyn G, Węgrzyn A. 2009. Differential efficiency of induction of various lambdoid prophages responsible for production of Shiga toxins in response to different induction agents. Microb Pathog 47:289–298. doi: 10.1016/j.micpath.2009.09.006. [DOI] [PubMed] [Google Scholar]
- 22.George J, Castellazzi M, Buttin G. 1975. Prophage induction and cell division in E. coli. Mol Gen Genet 140:309–332. [PubMed] [Google Scholar]
- 23.Howard-Flanders P, Simson E, Theriot L. 1964. A locus that controls filament formation and sensitivity to radiation in Escherichia coli K-12. Genetics 49:237. [DOI] [PMC free article] [PubMed] [Google Scholar]
- 24.Zhang X, McDaniel AD, Wolf LE, Keusch GT, Waldor MK, Acheson DW. 2000. Quinolone antibiotics induce Shiga toxin-encoding bacteriophages, toxin production, and death in mice. J Infect Dis 181:664–670. doi: 10.1086/315239. [DOI] [PubMed] [Google Scholar]
- 25.Herold S, Siebert J, Huber A, Schmidt H. 2005. Global expression of prophage genes in Escherichia coli O157:H7 strain EDL933 in response to norfloxacin. Antimicrob Agents Chemother 49:931–944. doi: 10.1128/AAC.49.3.931-944.2005. [DOI] [PMC free article] [PubMed] [Google Scholar]
- 26.Łoś JM, Łoś M, Węgrzyn A, Węgrzyn G. 2010. Hydrogen peroxide-mediated induction of the Shiga toxin converting lambdoid prophage ST2-8624 in Escherichia coli O157:H7. FEMS Immunol Med Microbiol 58:322–329. doi: 10.1111/j.1574-695X.2009.00644.x. [DOI] [PubMed] [Google Scholar]
- 27.Mason D, Power E, Talsania H, Phillips I, Gant V. 1995. Antibacterial action of ciprofloxacin. Antimicrob Agents Chemother 39:2752–2758. doi: 10.1128/AAC.39.12.2752. [DOI] [PMC free article] [PubMed] [Google Scholar]
- 28.Aertsen A, Michiels CW. 2005. Mrr instigates the SOS response after high pressure stress in Escherichia coli. Mol Microbiol 58:1381–1391. doi: 10.1111/j.1365-2958.2005.04903.x. [DOI] [PubMed] [Google Scholar]
- 29.Imlay JA, Linn S. 1987. Mutagenesis and stress responses induced in Escherichia coli by hydrogen peroxide. J Bacteriol 169:2967–2976. doi: 10.1128/jb.169.7.2967-2976.1987. [DOI] [PMC free article] [PubMed] [Google Scholar]
- 30.VanBogelen R, Kelley PM, Neidhardt F. 1987. Differential induction of heat shock, SOS, and oxidation stress regulons and accumulation of nucleotides in Escherichia coli. J Bacteriol 169:26–32. doi: 10.1128/jb.169.1.26-32.1987. [DOI] [PMC free article] [PubMed] [Google Scholar]
- 31.Palma M, DeLuca D, Worgall S, Quadri LE. 2004. Transcriptome analysis of the response of Pseudomonas aeruginosa to hydrogen peroxide. J Bacteriol 186:248–252. doi: 10.1128/JB.186.1.248-252.2004. [DOI] [PMC free article] [PubMed] [Google Scholar]
- 32.Sousa FJ, Lima LM, Pacheco AB, Oliveira CL, Torriani I, Almeida DF, Foguel D, Silva JL, Mohana-Borges R. 2006. Tetramerization of the LexA repressor in solution: implications for gene regulation of the E. coli SOS system at acidic pH. J Mol Biol 359:1059–1074. doi: 10.1016/j.jmb.2006.03.069. [DOI] [PubMed] [Google Scholar]
- 33.Łos JM, Łos M, Wegrzyn A, Wegrzyn G. 2013. Altruism of Shiga toxin-producing Escherichia coli: recent hypothesis versus experimental results. Front Cell Infect Microbiol 2:166. [DOI] [PMC free article] [PubMed] [Google Scholar]
- 34.Arnold JW, Koudelka GB. 2014. The Trojan Horse of the microbiological arms race: phage-encoded toxins as a defence against eukaryotic predators. Environ Microbiol 16:454–466. doi: 10.1111/1462-2920.12232. [DOI] [PubMed] [Google Scholar]
- 35.Imamovic L, Ballesté E, Jofre J, Muniesa M. 2010. Quantification of Shiga toxin-converting bacteriophages in wastewater and in fecal samples by real-time quantitative PCR. Appl Environ Microbiol 76:5693–5701. doi: 10.1128/AEM.00107-10. [DOI] [PMC free article] [PubMed] [Google Scholar]
- 36.Kidd SP. (ed). 2011. Advances in molecular and cellular microbiology, vol 19. Stress response in pathogenic bacteria. CAB International, Wellingford, United Kingdom. [Google Scholar]
- 37.Bonanno L, Delubac B, Michel V, Auvray F. 2017. Influence of stress factors related to cheese-making process and to STEC detection procedure on the induction of Stx phages from STEC O26:H11. Front Microbiol 8:296. doi: 10.3389/fmicb.2017.00296. [DOI] [PMC free article] [PubMed] [Google Scholar]
- 38.Gill C. 2009. Effects on the microbiological condition of product of decontaminating treatments routinely applied to carcasses at beef packing plants. J Food Prot 72:1790–1801. doi: 10.4315/0362-028X-72.8.1790. [DOI] [PubMed] [Google Scholar]
- 39.Lenzi LJ, Lucchesi PM, Medico L, Burgán J, Krüger A. 2016. Effect of the food additives sodium citrate and disodium phosphate on Shiga toxin-producing Escherichia coli and production of stx-phages and Shiga toxin. Front Microbiol 7:992. doi: 10.3389/fmicb.2016.00992. [DOI] [PMC free article] [PubMed] [Google Scholar]
- 40.Rode TM, Axelsson L, Granum PE, Heir E, Holck A, Trine ML. 2011. High stability of Stx2 phage in food and under food-processing conditions. Appl Environ Microbiol 77:5336–5341. doi: 10.1128/AEM.00180-11. [DOI] [PMC free article] [PubMed] [Google Scholar]
- 41.Imamovic L, Muniesa M. 2012. Characterizing RecA-independent induction of Shiga toxin2-encoding phages by EDTA treatment. PLoS One 7:e32393. doi: 10.1371/journal.pone.0032393. [DOI] [PMC free article] [PubMed] [Google Scholar]
- 42.Russell JB, Diez-Gonzalez F, Jarvis GN. 2000. Potential effect of cattle diets on the transmission of pathogenic Escherichia coli to humans. Microb Infect 2:45–53. doi: 10.1016/S1286-4579(00)00286-0. [DOI] [PubMed] [Google Scholar]
- 43.Hilgren J, Salverda J. 2000. Antimicrobial efficacy of a peroxyacetic/octanoic acid mixture in fresh-cut-vegetable process waters. J Food Sci 65:1376–1379. doi: 10.1111/j.1365-2621.2000.tb10615.x. [DOI] [Google Scholar]
- 44.Imamovic L, Muniesa M. 2011. Quantification and evaluation of infectivity of Shiga toxin-encoding bacteriophages in beef and salad. Appl Environ Microbiol 77:3536–3540. doi: 10.1128/AEM.02703-10. [DOI] [PMC free article] [PubMed] [Google Scholar]
- 45.Link AJ, Phillips D, Church GM. 1997. Methods for generating precise deletions and insertions in the genome of wild-type Escherichia coli: application to open reading frame characterization. J Bacteriol 179:6228–6237. [DOI] [PMC free article] [PubMed] [Google Scholar]
- 46.Otsuji N, Sekiguchi M, Iijima T, Takagi Y. 1959. Induction of phage formation in the lysogenic Escherichia coli K-12 by mitomycin C. Nature 184(S4):1079–1080. [DOI] [PubMed] [Google Scholar]
- 47.Wagner PL, Acheson DW, Waldor MK. 1999. Isogenic lysogens of diverse Shiga toxin 2-encoding bacteriophages produce markedly different amounts of Shiga toxin. Infect Immun 67:6710–6714. [DOI] [PMC free article] [PubMed] [Google Scholar]
- 48.Pfaffl MW. 2001. A new mathematical model for relative quantification in real-time RT-PCR. Nucleic Acids Res 29:e45. doi: 10.1093/nar/29.9.e45. [DOI] [PMC free article] [PubMed] [Google Scholar]
- 49.Chen YY, Gänzle MG. 2016. Influence of cyclopropane fatty acids on heat, high pressure, acid and oxidative resistance in Escherichia coli. Int J Food Microbiol 222:16–22. doi: 10.1016/j.ijfoodmicro.2016.01.017. [DOI] [PubMed] [Google Scholar]
- 50.Gant VA, Warnes G, Phillips I, Savidge GF. 1993. The application of flow cytometry to the study of bacterial responses to antibiotics. J Med Microbiol 39:147–154. [DOI] [PubMed] [Google Scholar]
- 51.Comas J, Vives-Rego J. 1997. Assessment of the effects of gramicidin, formaldehyde, and surfactants on Escherichia coli by flow cytometry using nucleic acid and membrane potential dyes. Cytometry 29:58–64. [DOI] [PubMed] [Google Scholar]
- 52.Koch AL, Robertson BR, Button DK. 1996. Deduction of the cell volume and mass from forward scatter intensity of bacteria analyzed by flow cytometry. J Microbiol Methods 27:49–61. [Google Scholar]
- 53.Martinez OV, Gratzner HG, Malinin TI, Ingram M. 1982. The effect of some β-lactam antibiotics on Escherichia coli studied by flow cytometry. Cytometry 3:129–133. [DOI] [PubMed] [Google Scholar]
- 54.Andersson DI, Hughes D. 2014. Microbiological effects of sublethal levels of antibiotics. Nat Rev Microbiol 12:465–478. doi: 10.1038/nrmicro3270. [DOI] [PubMed] [Google Scholar]
- 55.Liu Y, Gill A, McMullen L, Gänzle MG. 2015. Variation in heat and pressure resistance of verotoxigenic and nontoxigenic Escherichia coli. J Food Prot 78:111–120. doi: 10.4315/0362-028X.JFP-14-267. [DOI] [PubMed] [Google Scholar]
Associated Data
This section collects any data citations, data availability statements, or supplementary materials included in this article.


