Abstract
Aim:
This study aimed to compare three different methods used for shade selection, i.e., visual method, spectrophotometer, and digital photography method.
Materials and Methods:
Fifty participants were selected from the Out Patient Department of Prosthodontics. Presence of the maxillary right central incisor with no history of any restorative or endodontic procedures was the primary inclusion criterion. The shade of the right maxillary central incisor was determined using all the three shade selection procedures, namely, visual, spectrophotometric, and digital photography method for all the selected participants. The shades obtained in the visual method using a shade guide were noted down for further comparisons. The spectrophotometer reported the L*, a*, and b* values along with the actual shade whereas the digital photography method reported only the L*, a*, and b* values. The agreement between the readings obtained by the three different methods was compared and subjected to appropriate statistical analysis.
Results:
The results showed that when the three methods studied were compared, there was a statistically significant proportion of agreement between spectrophotometric and visual method (P < 0.01) with higher proportion of “yes” (agreement) and between the spectrophotometric and digital photography method (P < 0.01) with higher proportion of “yes” (agreement). Coefficient of agreement (using Kappa coefficient) between spectrophotometric and visual shades revealed a fair agreement. The mean ΔE was 1.69. There was a statistically significant difference between the proportion of ΔE more than and <2, between spectrophotometric and digital photography methods (P < 0.01) with higher proportion of <2 ΔE. Furthermore, percentage of agreement between shades obtained by the visual and spectrophotometric method showed maximum agreement with A1 shade.
Conclusion:
It was concluded that the digital photography method emerged as a reliable method for shade selection in a clinical setup.
Keywords: Digital photography, shade selection, spectrophotometer, visual shade matching
INTRODUCTION
Increased patient awareness has led to an increase in the demand for esthetic restorations. Improvements and advancements in dental materials and fabrication techniques have led to the availability of highly esthetic restorations.[1,2] In an anterior restoration, it is critical that the shade of the restoration matches that of the adjacent tooth. Shade matching is as much an art as a science. Improper shade selection is said to be the second most common reason for remake of a ceramic restoration, the primary reason being problems with tooth preparation and impressions.[2]
Literature has clearly stated that the shade of any restoration is influenced by several external factors such as surrounding illumination, environment, the tooth including its textures and layers, the dentist's personal judgment, and patient factors. It is a very subjective assessment which changes from person to person.[2,3]
The oldest method of shade selection is visual analysis using a commercial shade guide. It is also one of the simplest methods to be used in a clinical setting. However, this method is prone to errors and can be influenced by the factors mentioned above. Furthermore, the commercially available shade guides manufactured by various companies differ from each other with respect to hue, value, and chroma.[4] Other method of shade determination is with the help of instruments. The most commonly used instruments include spectrophotometer, spectrocolorimeter, color meter, spectroradiometer, and digital camera.[5] The advantage of such instrumental analysis is that it enables the dentists to perform an objective analysis which is more accurate and can be reproduced easily.[6]
The spectrophotometer functions on the principle of measurement of light energy reflected from an object in the visible spectrum.[7] In spite of it being more accurate than the visual shade guides, the quantitative spectrophotometric evaluation is limited to reading one point at a time.[6] Incorrect color reading from the loss of a fraction of light entering the tooth when used on curved teeth surfaces, i.e., the “edge-loss error,” is a frequent shortcoming of contact type spectrophotometric devices.[8]
Shade selection through digital photography has enabled ease of communication between the clinician and the laboratory technician. The primary advantage with this technique is that it provides the entire spectrum of color for the tooth or even a part of it, which when analyzed by an appropriate software can provide the color values in various formats. This is cost effective as compared to instruments such as spectrophotometers or colorimeters as well as time saving and convenient.[9,10] However, the validity of the method has yet to be proven.[9,10,11]
The aim of this study was to compare and assess three commonly used methods, namely, visual, spectrophotometric, and digital photography method for shade selection in a clinical setup.
MATERIALS AND METHODS
Sample size calculation was based on the results (effect sizes) from the previously published studies. A sample of size fifty cases in each group, satisfying the inclusion criteria would produce more than 80.0% statistical power (type II error = 0.20) and 5% type I error probability (α = 0.05) to be able to detect the clinically important difference in outcome measures, coefficient of agreement with a two-tailed alternative hypothesis.
After obtaining the necessary approval from the Ethics Committee of the Institution, fifty (n = 50) patients were randomly selected from the outpatient department of prosthodontic clinic. Informed consent was taken, and shade selection was performed on the subjects (21 women and 29 men). The only inclusion criterion was the presence of an unrestored (without any history of endodontic therapy or any restorative procedures) natural maxillary right central incisor tooth. Since tooth shade color is significantly influenced by the age of the patient, the age group selected was between 25 and 40 years of age.[12] Shade matching procedures were performed on all the subjects for their respective maxillary right central incisor to evaluate all the three study methods.
To eliminate any disparity in the visual method of shade selection and to rule out color blindness, the lead investigator undertook Munsell color test and pseudochromatic color plate test as described by Farnsworth under the supervision of an experienced ophthalmologist.[13] It was only after these tests that the investigator performed shade selection for the subjects participating in the study. In between every test to avoid color fatigue, the lead investigator deprogrammed his vision by looking at a blue sheet for 5 s as suggested by Veeraganta et al.[14]
To ensure standardization during the study, all the shade matching procedures were performed by the same operator by making the subject sit in the same dental chair directed toward northern facing sunlight. The time selected for the shade matching procedures was between 11:00 am and 1.00 pm on a clear day.[15]
Visual shade selection of the subject
The VITAPAN® classical shade guide (VITA Zahnfabrik H. Rauter GmbH and Co., KG, Bad Säckingen, Germany) was used for the visual shade selection method for all the participants [Figure 1]. The middle one-third of the right maxillary central incisor was selected for shade selected. The teeth were moistened by asking the subject to rinse with water. First, the Hue was selected from the nearest shade color available on the shade guide; following which Chroma was selected from within the Hue group which was based on the saturation of color. In a classic shade guide, the Hue is represented by Groups A, B, C, and D and Chroma is represented by numbers 1, 2, 3, and 4. Therefore, for each subject, the appropriate shade was noted based on the corresponding shade tabs.
Figure 1.
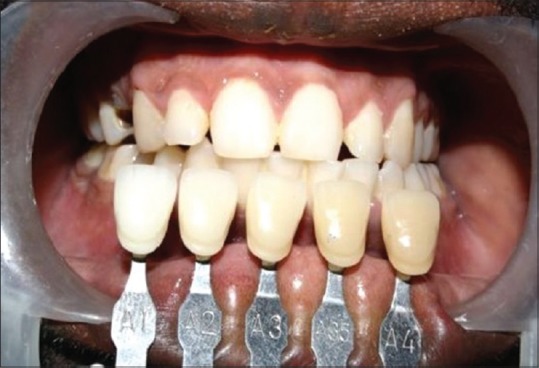
Visual shade selection using a VITAPAN® classical shade guide
Spectrophotometric shade selection of the subjects
A Clinical Spectrophotometer (VITA Easyshade, VITA Zahnfabrik H. Rauter GmbH and Co. KG, Bad Sackingen, Germany) was used for shade selection by the instrumental method [Figure 2]. The manufacturer's instructions were followed for the calibration of the device and for shade recordings, which were practiced before the final evaluations. The measuring tip (probe) was covered by an anti-infection cover and placed on the middle one-third of the maxillary right central incisor. The “Tooth single” program was selected for recording the shade and the L* a* b* values of the tooth.
Figure 2.
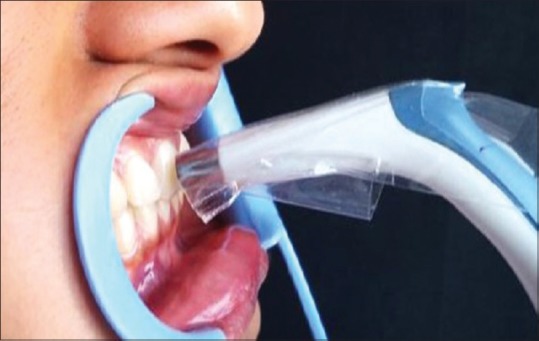
Shade selection using a VITA Easyshade spectrophotometer
Digital photography method for shade selection
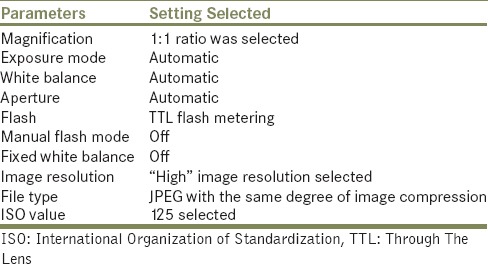
The digital camera used for the study was a Canon 500D series, single-lens reflex (SLR) camera with a Harison tripod stand (3D EV). The camera settings were set as described in Table 1. The digital camera was connected to a laptop (HP Compaq Presario laptop) which had the image analyzing software (Adobe Photoshop CS software [Middle Eastern Version by Adobe® Version: 8.0]). The following procedure was used for image capture for each subject.
Table 1.
Camera settings
After retracting the patient's cheek with a cheek retractor, a circular cut out from 18% gray card (which was dipped in 25% alcohol for disinfection) was placed on the patient's left central incisor with the help of petroleum jelly. The vertical arm of the camera stand was adjusted at the level of the patient's occlusal plane. The optical axis of the camera was oriented perpendicular the patient's frontal plane.[9] The distance between the camera and the patient was 70 cm to record a dimensionally accurate image.[14] A digital photograph was captured for each subject and stored as a JPEG file with the same degree of image compression [Figure 3].
Figure 3.
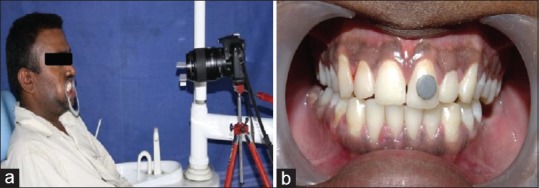
Shade selection using the digital photography method. (a) Camera and patient position, (b) 18% gray card in situ on the adjacent tooth
The image was processed as per the protocol described by Bengel:[9]
In the Adobe Photoshop software, the saved JPEG image was opened by clicking “CTRL+O”
The levels dialog which has a histogram chart and three color Dropper tools was opened by clicking “CTRL+L”
When the middle dropper tool was moved over the gray card in the picture, the red, blue, and green values were obtained. To change these to L* a* b* values, “image” was clicked in the main toolbar, followed by “mode” and then L* a* b* color. The L* a* b* values of the gray card were thus obtained
The known L* a* b* values of the gray card are 54, 0, and 0, respectively. The L* a* b* values so obtained must be adjusted/calibrated to these values. This was done by clicking on “image” and then “adjustments” and then “hue/saturation.” Similarly, the a* and b* values were calibrated[16]
The photograph was thus standardized using the gray card as a reference[16]
The Magnetic Lasso Tool in the software was used to delineate the area on the right central incisor whose shade was to be recorded.[11] The “Magic Wand” tool next to it was used to eliminate the reflection on the tooth surface[9]
The right central incisor was now ready for determination of its L* a* b* values which was done using the depiction in the histogram toward the right-hand side of the screen[9]
-
The software derived L* a* b* values thus obtained were converted to the L* a* b* values as given by the CIEL* a* b* system using the following formula[16]
- L* = L1 × 100/255
- a* = (a1 − 128) × 240/255
- b* = (b1 − 128) × 240/255
Where L1, a1, and b1 were the L*, a*, b* values obtained using Adobe Photoshop software as explained above.
From the above CIEL* a* b*-derived a* and b* values, L* a* b* values were thus recorded for each subject.
The ΔE (difference in the shade) between the spectrophotometer derived L* a* b* values, and the values obtained by the digital photography technique was calculated using the following formula[16]
ΔE = [(L1 − L2)² + (a1 − a2)² + (b1 − b2)²]½
Wherein
L1, a1, and b1 were the L*, a*, and b* value determined by the spectrophotometric measurement
L2, a2, and b2 were the L*, a*, and b* value obtained by the digital photography technique.
The digital photographic method gave an output in terms of the L*, a*, and b * values. These cannot be directly translated into a standard tooth shade (e.g., A1, A2, etc.). Therefore, for each subject, the delta E was determined with respect to the spectrophotometric value, and a score of “agreement” or “not in agreement” was given for delta E <2 and more than 2, respectively. This was done because the color difference between two objects (delta E) of <2 is not discernible to the human eye as suggested by Della Bona et al.[17]
Data were subjected to statistical analysis using Statistical Package for the Social Sciences (SPSS version 21.0, IBM Corporation, New York, USA). Coefficient of agreement was checked between spectrophotometric and visual method using Cohen's Kappa statistics. Agreement between spectrophotometric and visual methods and between spectrophotometric and digital photography methods was checked using z-test for proportions. A number of measures having a ΔE value above and below 2 were also compared using z-test for proportions. Percentage of samples with similar scores (accuracy) between spectrophotometric and visual methods was also checked. For all the statistical tests, P < 0.05 was considered to be statistically significant, keeping α error at 5% and β error at 20%, thus giving power to the study as 80%.
RESULTS
In this study, a combination of tooth color data (shade and L* a* b* values) was collected by the spectrophotometer, visual, and digital photography method [Table 2]. An evaluation of the accuracy of shade matching using a new digital photography technique and the conventional visual method was done as compared to a spectrophotometer.
Table 2.
Consolidated results of shade selection of all fifty patients
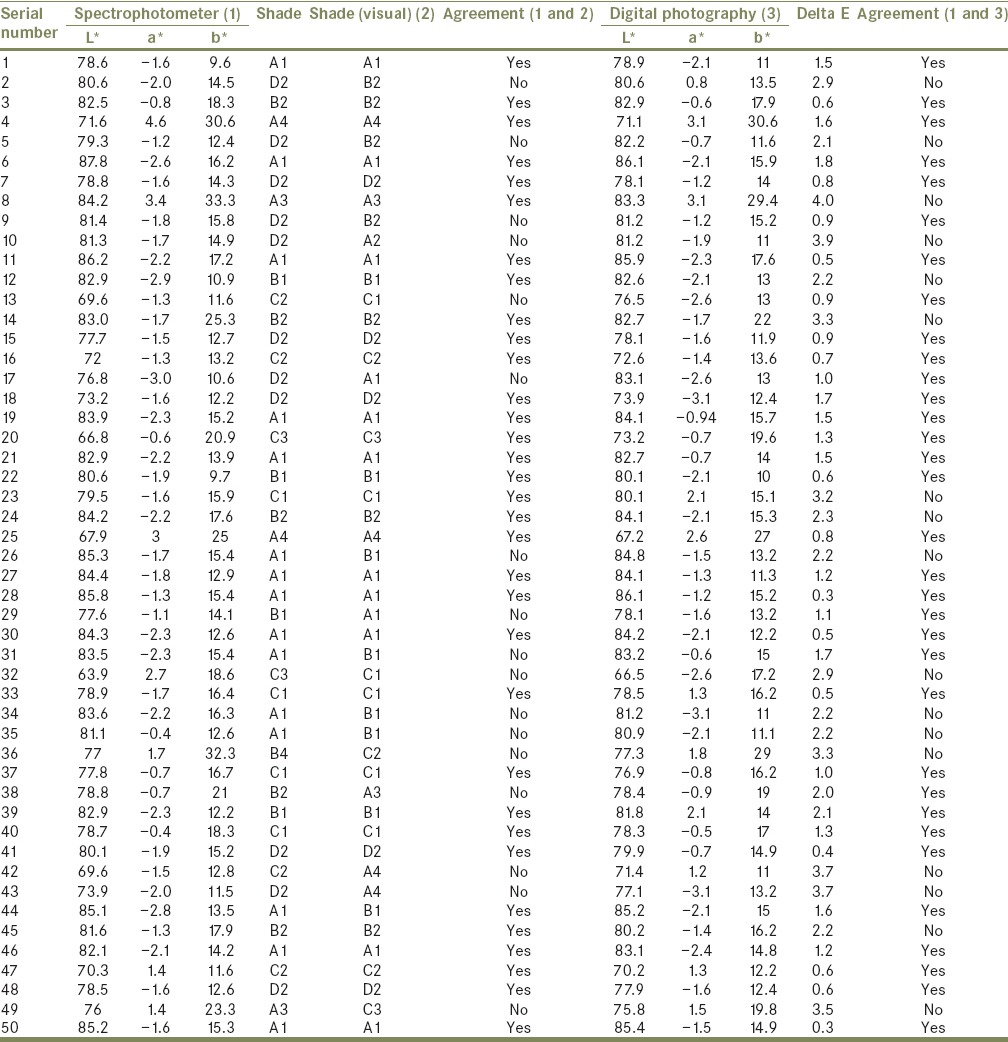
For comparison of shades between the visual and spectrophotometric methods, the coefficient of agreement (using Kappa coefficient) was checked. Results revealed a fair agreement between the shades as determined by these two methods (Kappa coefficient = 0.204) [Table 3].
Table 3.
Coefficient of agreement (using Kappa coefficient) between spectrophotometric and visual shades

On comparing the agreement between spectrophotometric and visual method using z-test for proportions, the Z-score was − 3.2 and P value was 0.00138 (P < 0.01). The results were statistically significant with a higher proportion of “yes” (agreement) [Table 4].
Table 4.
Overall agreement between spectrophotometer and visual method

On comparing the agreement between spectrophotometric and digital photography method using z-test for proportions, the Z-score was −3.2 and P = 0.00138 (P < 0.01). The results were statistically significant with a higher proportion of “yes” (agreement) [Table 5].
Table 5.
Overall agreement between spectrophotometer and digital photography

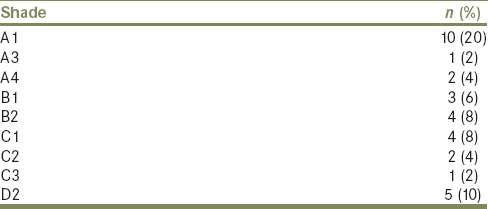
The comparison of a number of measures having a ΔE value above and below 2 using z-test for proportions revealed Z-score of −3.2 and P = 0.00138. This was statistically significant with a higher proportion of <2 ΔE [Table 6]. For shades obtained by the spectrophotometric and visual method, a high percentage of agreement was seen for A1 shade (20%), followed by D2 (10%) and least for shades A3 and C3 (2%) [Table 7].
Table 6.
Number of samples with delta E <2 and >2

Table 7.
Percentage of samples with similar scores (accuracy) between spectrophotometric and visual shades
DISCUSSION
The form, function, and esthetics of a restoration are of prime importance in its success. Perfection in shade selection can only be achieved when the prosthesis is an accurate replica of the adjacent natural tooth. Even though visual analysis using a commercially available shade guide is the most commonly used method to select shade in a dental clinic, it can be extremely unreliable and inconsistent.[18,19] This is because shade selection is based on visual perception and is the outcome of a variety of physiological and psychological responses and can differ according to the environment.[17,20]
To overcome the discrepancies of shade selection experienced due to commercially available shade guides, instruments such as spectrophotometer and colorimeter, digital cameras were introduced in dentistry which enabled clinicians to perform an objective analysis and compare the shades.[1] With the recent increased interest in esthetic dentistry, there has been increasing demand for these instruments.[9,21,22,23]
In the first technique, shade matching was done with a commonly available commercial shade guide (Vita Classic) which was the visual method of shade selection. Researchers in the past have reported conflicting results on the agreement between visual shade selection and color measuring devices such as spectrophotometers and colorimeters, with some authors claiming it to be less accurate[24,25,26] while some have suggested that it is equally accurate.[22,23,27]
The spectrophotometer used in this study, the Vita Easy Shade, which was developed with spectrophotometer PR-705 (Photo Research Inc., Chatsworth, California) as the “gold standard.” The precise positioning of the mouthpiece gives accurate measurements in the form of and L* a* b* values and an easy to use color analysis system. Since the spectrophotometer was not able to capture the image of the tooth, the need to include the digital photograph of the tooth in the color selection technique emerged.[28]
To overcome the disadvantages of the commonly used methods of shade selection, shade selection using a digital camera can potentially be used in the clinical setup. A digital photograph helps to exactly replicate the color of the restoration due to its high image quality. Furthermore, the information of the image is available as numerical color data (L* a* b*) which helps in determining the shade of that region of a tooth. In this study, a digital SLR (DSLR) camera with recommended settings was used to store high-quality photographs of teeth and arrive at accurate shade readings. The image analysis and calculation of the L* a* b* values were done with the help of Adobe Photoshop CS software as detailed by Bengel.[9]
It is necessary to use a standard colored object in the digital photography method to obtain comparable results. 18% gray paper, which is a piece of cardboard with a surface reflectance value of 18%, was used in this study for the same. The gray card is a neutral target as its red, blue, and green values are equal. It represented the middle tone used for exposure determination, halfway between pure black and pure white and was the same tone of gray, for which a camera meter is calibrated. Since the gray card had definite values, the software also interprets it as gray, thus eliminating the color cast of the whole picture.[16]
The results of this study reflected on the percent agreement between the visual and the instrumental methods of shade selection [Tables 4 and 5]. The percent agreement between the spectrophotometric method and the conventional visual shade selection method was 66%, which is statistically significant. Gómez-Polo et al. reported differences in the visual and the spectrophotographic methods of shade selection and yet found higher agreements in the value as compared to hue and chroma.[29]
However, previous studies have stated that spectrophotometers are a more accurate and reliable method of shade selection as their results are more reproducible and were more objective as compared to the visual methods.[23,30,31,32] In this study, the probable reason for high agreement between the methods could be the high levels of standardization followed. All the readings were taken by the same experienced operator. Since tooth shade selection requires the operator to have normal color vision and an ability to distinguish the nuances of tooth colors, the color vision tests as described by Farnsworth were undertaken by the investigator to eliminate the possibility of any deficiency (either congenital or acquired).[13] The protocols followed for each method were uniform and standardized.
Advances in photography and computer technology have led to the emergence of digital photography as a tool for shade selection. The images obtained can be analyzed using appropriate software, and thus color values of entire objects or even parts of objects are recorded. The advent of this technique has led to overcoming of problems of the contact type shade selection instruments.[33] The percentage agreement between shades taken by digital photography and the Vita Easy Shade (spectrophotometer) was high, which could be attributed to the standardized setup used for high quality photographs as well as the conversion of L* a* b* values obtained from the Adobe Photoshop software to L* a* b* values of the CIEL* a* b* system using the conversion formulae mentioned. Similar findings were reported by O’Brien et al. and Farah.[34,35] In their study, Jarad et al. stated that since a high percentage agreement existed between the L*, a*, b* values of the spectrophotometric and digital photography methods, digital photography can be used as a shade selection method in the clinical setup.[36]
The color difference between two objects is expressed as ΔE. The mean color difference between the L* a* and b* values obtained by the spectrophotometer and digital photography (i.e., mean ΔE) in this study was 1.69. There was a statistically significant proportion of ΔE <2 [Table 6]. This was comparable to the range of thresholds of clinical acceptance previously reported.[34] However, it was smaller than the thresholds which were reported by Douglas et al.[37] and Johnston and Kao.[22] Although these studies were performed in vivo, significant differences existed in the study design as compared to the present study, mainly in the number and level of experience of the investigator and the material of the teeth that were studied. In addition, color pairs were varied using opposing, contralateral, and adjacent teeth and included premolars and molars. Different positions and materials for the color pairs could be factors which resulted in different thresholds for ΔEs in accepted shade.
In this study, it was interesting to note that patients with lighter teeth (especially shade A1), i.e., higher values showed a higher percentage of agreement with two of the commonly used techniques for shade matching (shade matching with a shade guide and with the clinical spectrophotometer) [Table 7]. Further research can be carried out to examine the distribution of the lighter color shades within the narrower color spectrum.
The results of this study reveal that the newly emerging digital photography technique was as accurate as the most commonly used method for shade selection. There are numerous advantages of the digital photography technique, when compared to the traditional method of shade selection using shade guides. If this technique is carried out in the correct scientific manner, it is an objective method and is not dependent on the dentist and patient factors. The possibility of patient participation in the color matching procedure is higher. It is easy to perform, exact colors of different areas of the same tooth can be obtained, and the shade so obtained can be communicated to the laboratory without any discrepancies. Thus, the chances of obtaining an esthetically accurate restoration are higher.
The disadvantages of following the digital photography method for shade selection include the need to use a DSLR camera, developing a familiarity with the digital photo imaging software and in a clinical setup, using a stable shooting distance with adequate and constant illumination.[34] It is also essential to use the 18% gray card during this technique to calibrate the images accurately during evaluation. In the laboratory, the ceramist will also have to follow the same photography protocol to record the image of the fabricated dental restoration. He will also have to ensure that the restoration and the photograph of the patient's tooth have either the same L* a* b* values or a ΔE <2.
The science of color is an integration of art and science. Systematic education and training are necessary to be imparted to the laboratory technicians involved in the production of esthetic and accurate restorations.[38] By providing digital photographs with details of the patients tooth to be reproduced, the quality of restorations fabricated by the laboratory can be of superior quality. Even though this study did not evaluate the impact of the learning curve for the spectrophotometric color-matching system and the influence of individual laboratory technician's skill on the outcome, it would be interesting to evaluate the same in future studies. Furthermore, studies can be performed to check the accuracy of digital photography technique as compared to shade matching done using other commercially available shade guides. Furthermore, the color match of restorations fabricated using shades suggested by the digital photography technique should also be investigated.
CONCLUSION
Within the limitations of this study, the following conclusions can be drawn:
The visual method of shade selection and the digital photography method showed a high (statistically significant) percentage of agreement with the clinical spectrophotometer for the shades selected. For the shades selected, the conventional method of shade selection (visual method) and the newly emerged digital photography method show a statistically significant percentage agreement with the spectrophotometric method of shade selection
The visual and the spectrophotometric method showed a higher percentage of agreement for A1 shade, i.e., shade of a higher value (lighter shade)
Digital photography can emerge as a viable alternative to the use of spectrophotometers for shade selection in a clinical setup.
Declaration of patient consent
The authors certify that they have obtained all appropriate patient consent forms. In the form the patient(s) has/have given his/her/their consent for his/her/their images and other clinical information to be reported in the journal. The patients understand that their names and initials will not be published and due efforts will be made to conceal their identity, but anonymity cannot be guaranteed.
Financial support and sponsorship
Nil.
Conflicts of interest
There are no conflicts of interest.
REFERENCES
- 1.Choi JH, Park JM, Ahn SG, Song KY, Lee MH, Jung JY, et al. Comparative study of visual and instrumental analyses of shade selection. J Wuhan Univ Technol Mater Sci Ed. 2010;25:62–7. [Google Scholar]
- 2.Maclaren EA. Shade analysis and communication-essential aspect of evaluating and communicating tooth color in practice. Inside Dentistry. 2010;6:58–67. [Google Scholar]
- 3.Bergen SF, McCasland J. Dental operatory lighting and tooth color discrimination. J Am Dent Assoc. 1977;94:130–4. doi: 10.14219/jada.archive.1977.0264. [DOI] [PubMed] [Google Scholar]
- 4.Pop-Ciutrila IS, Colosi HA, Dudea D, Badea ME. Spectrophotometric color evaluation of permanent incisors, canines and molars. A cross-sectional clinical study. Clujul Med. 2015;88:537–44. doi: 10.15386/cjmed-497. [DOI] [PMC free article] [PubMed] [Google Scholar]
- 5.Anand M, Shetty P, Bhat SG. Shade matching in fixed prosthodontics using instrumental color measurements and computers. J Indian Prosthodont Soc. 2007;7:179–83. [Google Scholar]
- 6.Oh WS, Pogoncheff J, O’Brien WJ. Digital computer matching of tooth color. Materials. 2010;3:3694–9. [Google Scholar]
- 7.Chu SJ, Trushkowsky RD, Paravina RD. Dental color matching instruments and systems. Review of clinical and research aspects. J Dent. 2010;38(Suppl 2):e2–16. doi: 10.1016/j.jdent.2010.07.001. [DOI] [PubMed] [Google Scholar]
- 8.Bolt RA, Bosch JJ, Coops JC. Influence of window size in small-window colour measurement, particularly of teeth. Phys Med Biol. 1994;39:1133–42. doi: 10.1088/0031-9155/39/7/006. [DOI] [PubMed] [Google Scholar]
- 9.Bengel WM. Digital photography and the assessment of therapeutic results after bleaching procedures. J Esthet Restor Dent. 2003;15(Suppl 1):S21–32. doi: 10.1111/j.1708-8240.2003.tb00315.x. [DOI] [PubMed] [Google Scholar]
- 10.Bentley C, Leonard RH, Nelson CF, Bentley SA. Quantitation of vital bleaching by computer analysis of photographic images. J Am Dent Assoc. 1999;130:809–16. doi: 10.14219/jada.archive.1999.0304. [DOI] [PubMed] [Google Scholar]
- 11.Bergman B, Nilson H, Andersson M. A longitudinal clinical study of Procera ceramic-veneered titanium copings. Int J Prosthodont. 1999;12:135–9. [PubMed] [Google Scholar]
- 12.Rodrigues S, Shetty SR, Prithviraj DR. An evaluation of shade differences between natural anterior teeth in different age groups and gender using commercially available shade guides. J Indian Prosthodont Soc. 2012;12:222–30. doi: 10.1007/s13191-012-0134-9. [DOI] [PMC free article] [PubMed] [Google Scholar]
- 13.Farnsworth D. The Farnsworth-Munsell 100-hue and dichotomous tests for color vision. J Opt Soc Am. 1943;33:568–78. [Google Scholar]
- 14.Veeraganta SK, Savadi RC, Baroudi K, Nassani MZ. Differences in tooth shade value according to age, gender and skin color: A pilot study. J Indian Prosthodont Soc. 2015;15:138–41. doi: 10.4103/0972-4052.155035. [DOI] [PMC free article] [PubMed] [Google Scholar]
- 15.Celebic A, Stipetic J, Nola P, Petricevic N, Papic M. Use of digital photographs for artificial tooth selection. Coll Antropol. 2004;28:857–63. [PubMed] [Google Scholar]
- 16.Commission Internationale de l’Eclairage (CIE). Recommendations on Uniform Color Spaces, Color-Difference Equations, Psychometric Color Terms. Bureau Central de la CIE; 1978. [Google Scholar]
- 17.Della Bona A, Barrett AA, Rosa V, Pinzetta C. Visual and instrumental agreement in dental shade selection: Three distinct observer populations and shade matching protocols. Dent Mater. 2009;25:276–81. doi: 10.1016/j.dental.2008.09.006. [DOI] [PubMed] [Google Scholar]
- 18.McPhee ER. Light and color in dentistry. Part I – Nature and perception. J Mich Dent Assoc. 1978;60:565–72. [PubMed] [Google Scholar]
- 19.Pande N, Kolarkar MS. Spectrophotometric evaluation of shade reproduction of pressable all-ceramic system on un-stained and stained tooth: An in vitro study. J Indian Prosthodont Soc. 2016;16:63–9. doi: 10.4103/0972-4052.175711. [DOI] [PMC free article] [PubMed] [Google Scholar]
- 20.Jasinevicius TR, Curd FM, Schilling L, Sadan A. Shade-matching abilities of dental laboratory technicians using a commercial light source. J Prosthodont. 2009;18:60–3. doi: 10.1111/j.1532-849X.2008.00376.x. [DOI] [PubMed] [Google Scholar]
- 21.Ferreira D, Monard LA. Measurement of spectral reflectance and colorimetric properties of Vita shade guides. J Dent Assoc S Afr. 1991;46:63–5. [PubMed] [Google Scholar]
- 22.Johnston WM, Kao EC. Assessment of appearance match by visual observation and clinical colorimetry. J Dent Res. 1989;68:819–22. doi: 10.1177/00220345890680051301. [DOI] [PubMed] [Google Scholar]
- 23.Paul SJ, Peter A, Rodoni L, Pietrobon N. Conventional visual vs.spectrophotometric shade taking for porcelain-fused-to-metal crowns: A clinical comparison. Int J Periodontics Restorative Dent. 2004;24:222–31. [PubMed] [Google Scholar]
- 24.Yap AU. Color attributes and accuracy of Vita-based manufacturers’ shade guides. Oper Dent. 1998;23:266–71. [PubMed] [Google Scholar]
- 25.Okubo SR, Kanawati A, Richards MW, Childress S. Evaluation of visual and instrument shade matching. J Prosthet Dent. 1998;80:642–8. doi: 10.1016/s0022-3913(98)70049-6. [DOI] [PubMed] [Google Scholar]
- 26.Seghi RR, Hewlett ER, Kim J. Visual and instrumental colorimetric assessments of small color differences on translucent dental porcelain. J Dent Res. 1989;68:1760–4. doi: 10.1177/00220345890680120801. [DOI] [PubMed] [Google Scholar]
- 27.Gehrke P, Riekeberg U, Fackler O, Dhom G. Comparison of in vivo visual, spectrophotometric and colorimetric shade determination of teeth and implant-supported crowns. Int J Comput Dent. 2009;12:247–63. [PubMed] [Google Scholar]
- 28.Carlsson GE, Wagner IV, Odman P, Ekstrand K, MacEntee M, Marinello C, et al. An international comparative multicenter study of assessment of dental appearance using computer-aided image manipulation. Int J Prosthodont. 1998;11:246–54. [PubMed] [Google Scholar]
- 29.Gómez-Polo C, Gómez-Polo M, Celemin-Viñuela A, Martínez Vázquez De Parga JA. Differences between the human eye and the spectrophotometer in the shade matching of tooth colour. J Dent. 2014;42:742–5. doi: 10.1016/j.jdent.2013.10.006. [DOI] [PubMed] [Google Scholar]
- 30.Kim-Pusateri S, Brewer JD, Davis EL, Wee AG. Reliability and accuracy of four dental shade-matching devices. J Prosthet Dent. 2009;101:193–9. doi: 10.1016/S0022-3913(09)60028-7. [DOI] [PubMed] [Google Scholar]
- 31.Khurana R, Tredwin CJ, Weisbloom M, Moles DR. A clinical evaluation of the individual repeatability of three commercially available colour measuring devices. Br Dent J. 2007;203:675–80. doi: 10.1038/bdj.2007.1108. [DOI] [PubMed] [Google Scholar]
- 32.Parameswaran V, Anilkumar S, Lylajam S, Rajesh C, Narayan V. Comparison of accuracies of an intraoral spectrophotometer and conventional visual method for shade matching using two shade guide systems. J Indian Prosthodont Soc. 2016;16:352–8. doi: 10.4103/0972-4052.176537. [DOI] [PMC free article] [PubMed] [Google Scholar]
- 33.Tam WK, Lee HJ. Dental shade matching using a digital camera. J Dent. 2012;40(Suppl 2):e3–10. doi: 10.1016/j.jdent.2012.06.004. [DOI] [PubMed] [Google Scholar]
- 34.O’Brien WJ, Johnston WM, Fanian F. Double-layer color effects in porcelain systems. J Dent Res. 1985;64:940–3. doi: 10.1177/00220345850640061801. [DOI] [PubMed] [Google Scholar]
- 35.Farah RI. Agreement between digital image analysis and clinical spectrophotometer in CIEL*C*h° coordinate differences and total color difference (ΔE) measurements of dental ceramic shade tabs. Int J Esthet Dent. 2016;11:234–45. [PubMed] [Google Scholar]
- 36.Jarad FD, Russell MD, Moss BW. The use of digital imaging for colour matching and communication in restorative dentistry. Br Dent J. 2005;199:43–9. doi: 10.1038/sj.bdj.4812559. [DOI] [PubMed] [Google Scholar]
- 37.Douglas RD, Steinhauer TJ, Wee AG. Intraoral determination of the tolerance of dentists for perceptibility and acceptability of shade mismatch. J Prosthet Dent. 2007;97:200–8. doi: 10.1016/j.prosdent.2007.02.012. [DOI] [PubMed] [Google Scholar]
- 38.Hasssija J, Hegde V, Sridhar N. An in vitro study on effect of ceramic thickness and multiple firings on colour of metal ceramic restorations. J Indian Prosthodont Soc. 2014;14(Suppl 1):86–92. doi: 10.1007/s13191-014-0370-2. [DOI] [PMC free article] [PubMed] [Google Scholar]


