Abstract
Objective:
To examine the gross pathology and histopathology of ablation zones created from radiofrequency (RF) ablation and to correlate their chronological changes.
Methods:
A total of 48 in vivo ablation zones (16 rabbit livers) were obtained immediately after and also 30 min, 1 h and 2 h after RF ablation and were subjected to haematoxylin and eosin (H&E) staining, nicotinamide adenine dinucleotide (NADH) diaphorase staining, terminal deoxynucleotidyl transferase dUTP nick end labelling (TUNEL) staining. Chronological changes in gross pathology and histopathology were evaluated and correlated with each other.
Results:
Peripheral red zones on gross pathology correlated with peripheral zones on H&E staining, lightly stained peripheral zones on NADH staining and peripheral positive zones on TUNEL staining. Central white zones on gross pathology correlated with combined central and border zones on H&E staining, central negative zones on NADH staining and combined central-positive and middle-negative zones on TUNEL staining. Boundary visibility between central white and peripheral red zones on gross pathology was significantly higher at 1 and 2 h than immediately after RF ablation. As time increased after RF ablation, visibility of the border zone on H&E staining and the grade of positively stained hepatocytes in the peripheral zone on TUNEL staining increased.
Conclusion:
Chronological changes in gross pathology of RF ablation zones correlated well with histopathology. The boundary between the central white and peripheral red zones tended to become clear at 1 h after RF ablation.
Advances in knowledge:
(1) RF ablation zones show chronological changes on gross pathology and histopathology. (2) Gross pathology and histopathology correlate well with each other.
INTRODUCTION
Since the first report on the use of liver radiofrequency (RF) ablation was published in 1990,1 RF ablation has become one of the most common local ablation modalities. The past decade has seen significant advances in RF ablation technology. Efforts are currently under way to improve ablation efficiency. The efficiency of new ablation technologies is usually evaluated by comparing gross pathology using a conventional method and a new method.2–5 Although many studies have investigated histopathological evaluation and radiological–pathological correlations of hepatic RF ablation zones,6–12 no definition of the ablation zone on gross pathology has been established.13 The exact boundary of the ablation zone in gross pathology is still controversial; some studies only include the central, white ablation zone, whereas others also include the peripheral red zone. To define the true ablation zone by gross pathology, correlation between gross pathology and histopathology is essential. However, few studies have investigated the precise correlation between gross pathology and histopathology of RF ablation zones.
Determining the chronological changes in the RF ablation zone on gross pathology and histopathology is important to precisely define the ablation zone early after RF ablation, as tissue harvest is usually performed within a few hours of RF ablation. Previous studies reported that histopathological features of ablation zones induced by laser ablation or microwave ablation change over time.14,15 They reported that the ablation zone was divided into two zones based on the histopathological features, central area with coagulation necrosis and peripheral area with dilated sinusoid and congestion of erythrocytes, and the size of the ablation zone increased progressively until several hours after ablation. Since RF ablation is also a thermal ablation method, its ablation zones might also change with time. However, changes in ablation zones early after RF ablation, particularly within the first 2 h, have not been scientifically evaluated. Consequently, no standardized method from in vivo experimental studies exists to define the optimal harvest time after RF ablation.
Therefore, in this study, we examined the gross pathology and histopathology of ablation zones early after RF ablation and correlated their chronological changes using an in vivo rabbit liver model. In addition, we evaluated when the boundary between the central white and peripheral red zones on gross pathology became clear during the early stages after RF ablation.
METHODS AND MATERIALS
Animals
This study was approved by the Institutional Animal Care and Use Committee in the Samsung Medical Center before initiating experiments on 16 New Zealand white rabbits (average weight, 3.1 kg). All rabbits were anaesthetized by intramuscular injection with 5 mg kg−1 body weight tiletamine hydrochloride and zolazepam hydrochloride (Zoletil50®; Virbac S.A., Carros, France) and 0.5 mg kg−1 body weight xylazine (Rompun™; Bayer Schering Pharma, Berlin, Germany). After achieving an adequate degree of anaesthesia, we shaved the backs of the rabbits for placement of an RF grounding pad. After grounding pad attachment, rabbits were placed in the supine position. The epigastric area was sterilized, and the liver was exposed by laparotomy. Anaesthesia was maintained with inhaled isoflurane gas (Forane solution; Choongwae Pharma, Seoul, Republic of Korea).
Radiofrequency ablation
We used an internally cooled RF ablation system equipped with a 200-W RF generator (VIVA RF Generator; STARmed, Goyang, Republic of Korea) and a single 18-gauge straight-tip electrode with a 0.7-cm active tip (Wellpoint®; STARmed). The electrode was cooled internally to <25 °C with chilled saline using a peristaltic pump (VIVA Pump; STARmed). Before insertion of RF electrodes, an additional 5-cm-long plastic sheath was placed over the electrode and pulled back towards the handle to avoid contact with the active tip. Under real-time ultrasound guidance (Accuvix A30, Samsung Medison, Seoul, Republic of Korea) RF electrodes were placed in the liver as far from intrahepatic vessels, interlobar fissure and the liver capsule as possible, so that RF ablation zones would not be influenced by these structures. Generator power was set to 30 W, and total ablation time was 5 min. During RF ablation, we maintained the initial location of the electrode tip using ultrasound guidance. We created three ablation zones every 30 min or 1 h per rabbit due to the paucity of favourable sites for RF ablation in the liver. To evaluate the chronological changes in ablation zones after RF ablation, tissue harvest was performed immediately after and also 30 min, 1 h and 2 h after RF ablation. Therefore, 12 RF ablation zones were created for each time point.
Cut sections of ablation zone
To obtain precise cut sections of ablation zones along the electrode track, the sheath that was placed over the electrode was advanced immediately after ablation and the electrode was removed. Rabbits were sacrificed after RF ablation via intravenous administration of 10 ml of potassium chloride solution, and the livers were harvested. To obtain cut sections of ablation zones, a stiff wire was inserted into the additional sheath, and the sheath was removed. The specimen was sliced along the stiff wire. The shape of the ablation zones was evaluated by consensus of two radiologists (MWL and KDS) to determine if ablation zones were influenced by the surrounding intrahepatic vessels, interlobar fissure or the liver capsule.
Histological slide preparation and staining
For each ablation zone, two tissue specimens were photographed with a high-resolution digital camera. Histological slide preparation was performed by a histopathology specialist (JY). One specimen per ablation zone was fixed in 10% neutral buffered formalin, embedded in paraffin and sliced into 4-μm sections for haematoxylin and eosin (H&E) staining and terminal deoxynucleotidyl transferase dUTP nick end labelling (TUNEL) assays. The other specimen was embedded in optimal cutting temperature compound (Tissue Tek; Sakura Finetek, Tokyo, Japan), quenched in isopentane and frozen in liquid nitrogen before storage at −80 °C for evaluation of nicotinamide adenine dinucleotide (NADH) diaphorase activity. Trimmed tissue blocks were photographed immediately before slicing the specimen for histology slides.
Evaluation of gross pathology and histopathology
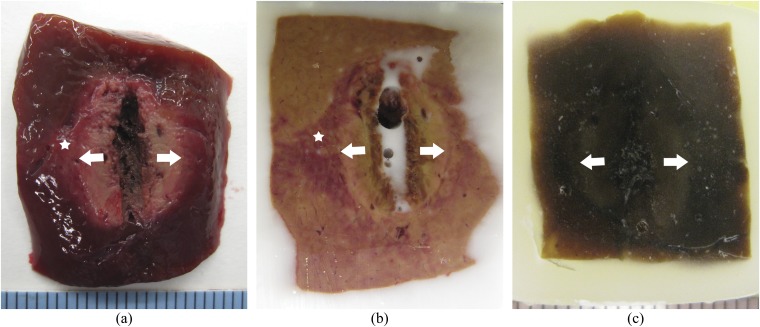
On gross images, ablation zones were segmented by visual inspection according to colour: the central white zone and the peripheral red zone (Figures 1 and 2). At each time point, the visibility of the boundary between the central white and peripheral red zones was graded on a four-point scale: 0, <25% visible; 1, ≥25% and <50% visible; 2, ≥50% and <75% visible; and 3, ≥75% visible.
Figure 1.
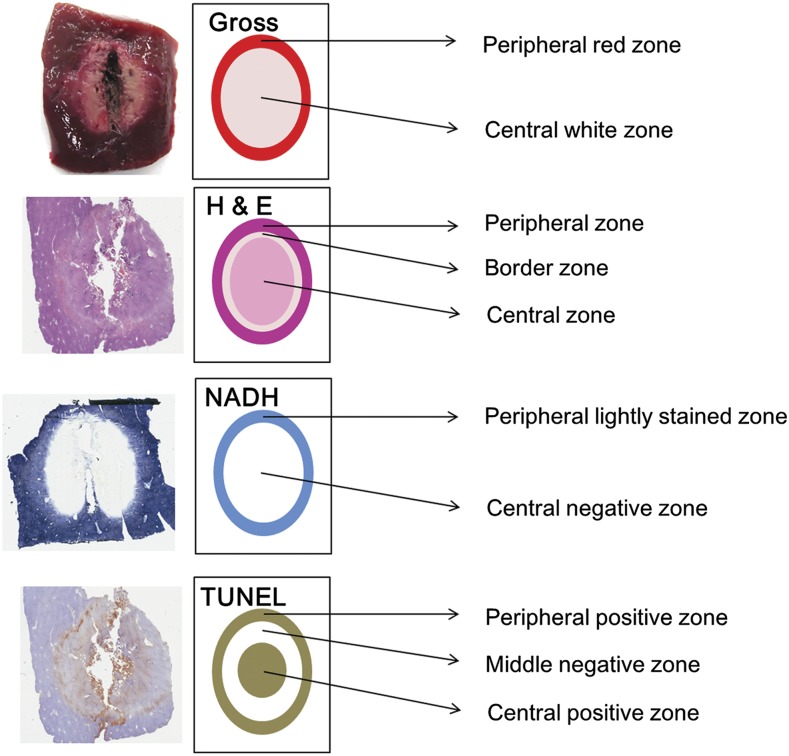
Correlation between gross pathology and histopathology. The peripheral red zone on gross pathology correlated with the peripheral zone on haematoxylin and eosin (H&E) staining, the lightly stained peripheral zone on nicotinamide adenine dinucleotide (NADH) staining and the terminal deoxynucleotidyl transferase dUTP nick end labelling (TUNEL)-positive peripheral zone. The central white zone on gross pathology correlated with the combined border and central zone on H&E staining, the central negative zone on NADH staining, and the combined middle negative and central positive zone on TUNEL staining.
Figure 2.
Gross pathology of radiofrequency ablation. Ablation zone was segmented into a central white zone (white arrows) and peripheral red zone (white star). (a) Gross specimen. (b) Frozen specimen after trimming for histological slide preparation for nicotinamide adenine dinucleotide staining. (c) Paraffin-embedded specimen after trimming for histological slide preparation for haematoxylin and eosin and terminal deoxynucleotidyl transferase dUTP nick end labelling staining.
On H&E staining, ablation zones were segmented based on histological findings into the central, border and peripheral zones (Figures 1 and 3). The visibility of the border zone was graded on a three-point scale: 0, invisible; 1, faintly visible; and 2, clearly visible. On NADH staining, ablation zones were segmented based on the degree of hepatocyte staining into the central negative zone and lightly stained peripheral zone (Figure 1). The visibility of the lightly stained peripheral zone was graded on a three-point scale: 0, invisible; 1, faintly visible; and 2, clearly visible. On TUNEL staining, ablation zones were segmented based on the degree of hepatocyte staining into the central positive zone, middle negative zone and peripheral positive zone (Figure 1). The degree of positively stained hepatocytes in the peripheral zone on TUNEL staining was graded on a three-point scale: 0, negative; 1, weak positive; and 2, strong positive. All evaluations were based on the consensus of a histopathologist (JY) and a radiologist (KDS).
Figure 3.
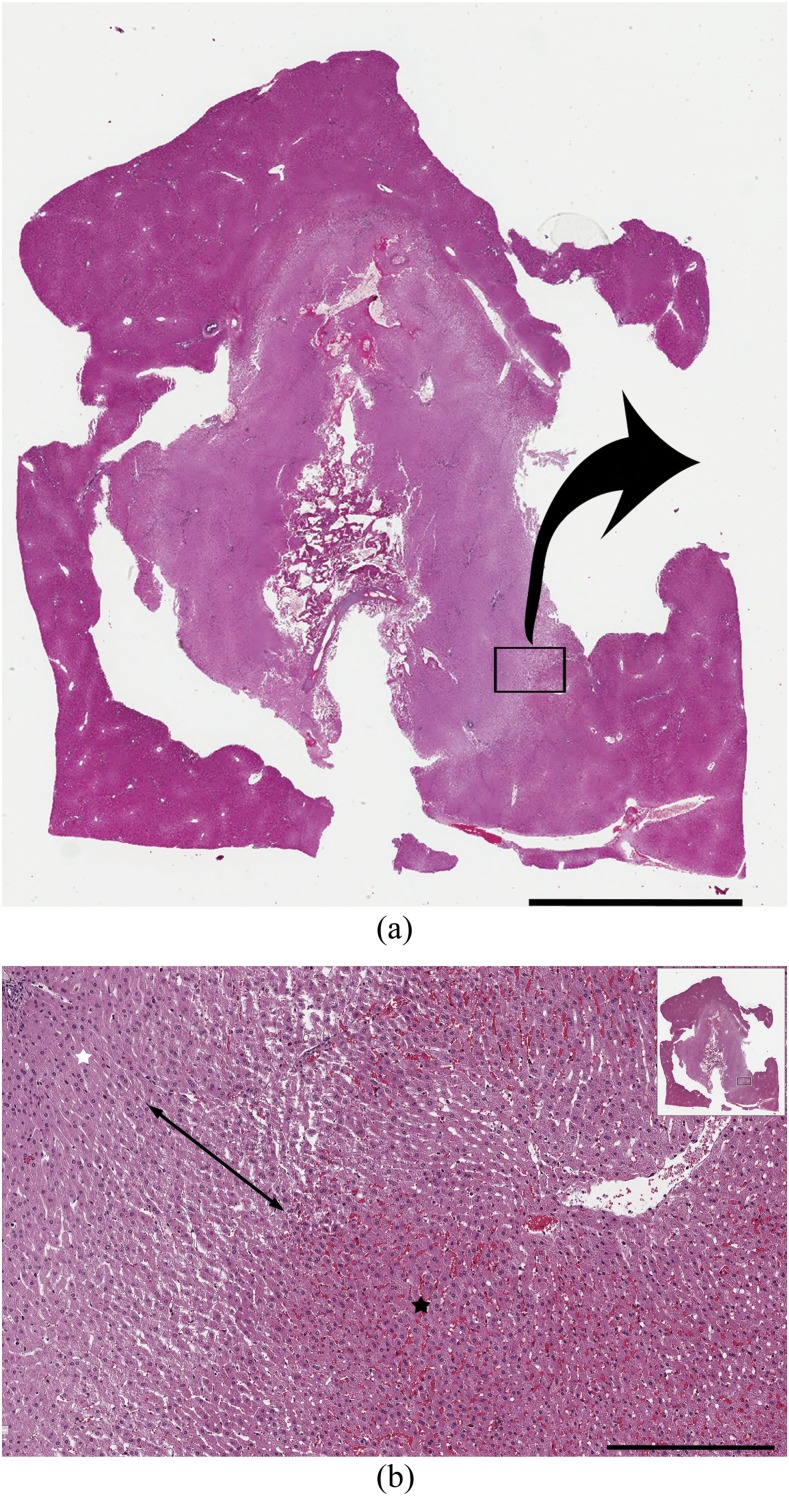
Histopathology by haematoxylin and eosin (H&E) staining of the ablation zone. (a) Scanned image of the H&E-stained ablation zone. Scale bar = 5 mm. (b) Magnified image of the H&E-stained ablation zone. In the central zone (white star), the hepatocyte cytoplasm was slightly eosinophilic and nuclei were reduced in size. In the peripheral zone (black star), erythrocytes were packed in the sinusoids. A border zone between these areas had dilated sinusoids without packed erythrocytes (two-headed arrow). Scale bar = 400 μm.
Statistical analyses
The grade for visibility of the boundary between the central white and peripheral red zones; the border zone on H&E staining; and the lightly stained peripheral zone on NADH staining, as well as the grade of positively stained hepatocytes in the peripheral zone by TUNEL staining were compared for all time points using the Kruskal–Wallis test followed by post hoc analysis using the Mann–Whitney U test with Bonferroni correction for multiple comparisons. All statistical analyses used commercially available software packages (PASW® Statistics, v. 18.0; IBM Corp., New York, NY; formerly SPSS Inc., Chicago, IL). p-values <0.05 were considered statistically significant.
RESULTS
The shape of six ablation zones was affected by the adjacent large vessels or fissures; these six cases were excluded from analysis. As a result, 12 specimens were evaluated immediately after RF ablation, 8 at 30 min, 12 at 1 h and 10 at 2 h after the ablation.
Chronological changes in gross pathology
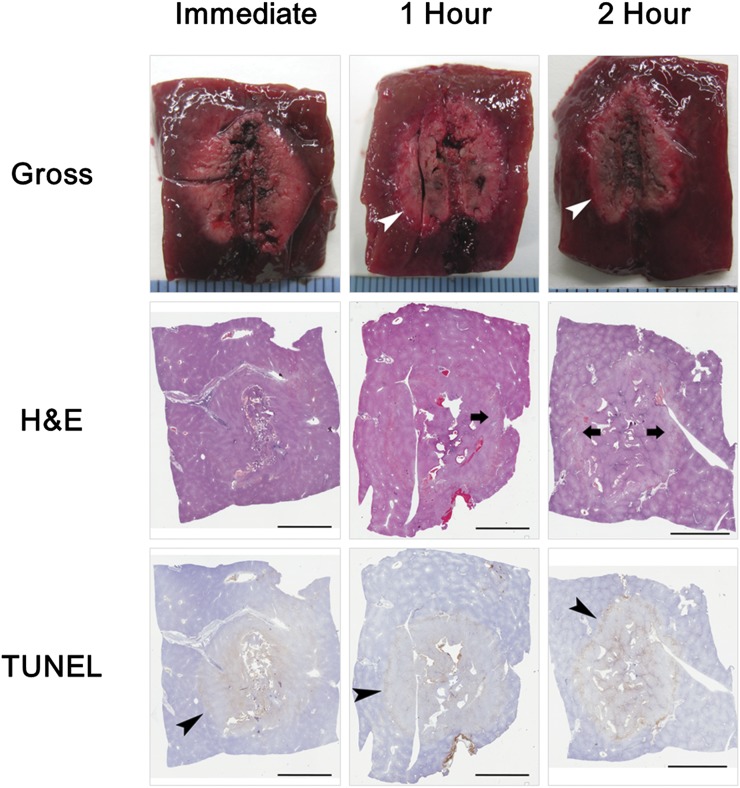
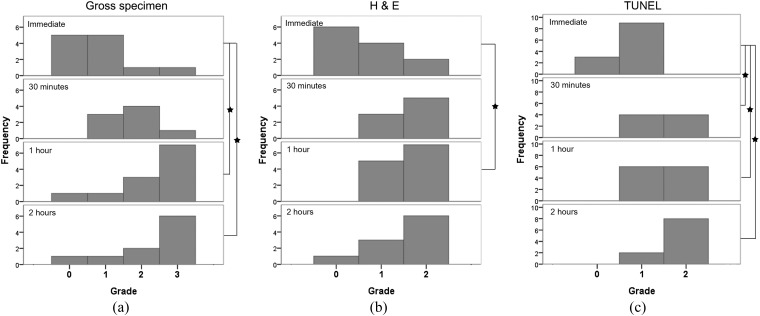
On gross images, the visibility grade of the boundary between the central white and peripheral red zones differed significantly at all time points (p = 0.002) and tended to increase with time after RF ablation (Figures 4 and 5a). The visibility grade of the boundary was significantly higher at 1 and 2 h after RF ablation than immediately afterwards (p = 0.018 and p = 0.036). However, no significant difference was observed between the visibility grades at 1 and 2 h after RF ablation (p = 1.000).
Figure 4.
Chronological changes in radiofrequency ablation zone. As time after radiofrequency ablation increased, the boundary between the central white and peripheral red zone on gross pathology became more clear (white arrowheads); the border zone with dilated sinusoids but without packed red blood cells on haematoxylin and eosin (H&E) staining became visible (arrows); and the grade of positively stained hepatocytes in the peripheral zone on terminal deoxynucleotidyl transferase dUTP nick end labelling (TUNEL) staining increased (black arrowheads). Scale bar = 5 mm.
Figure 5.
Evaluation of chronological changes of radiofrequency (RF) ablation zone. Stars = p < 0.05. (a) Visibility grade of the boundary between the central white and peripheral red zone on gross pathology. Grade increased with time after RF ablation. (b) Visibility grade of border zone on haematoxylin and eosin (H&E) staining. Grade at 1 h after RF ablation was significantly higher than immediately after ablation (p = 0.048). (c) Grade of positively stained hepatocytes in the peripheral zone on terminal deoxynucleotidyl transferase dUTP nick end labelling (TUNEL) staining was significantly higher at 30 min, and at 1 and 2 h after RF ablation than immediately after RF ablation (p = 0.048, 0.024 and <0.001, respectively).
Chronological changes in histopathology
On H&E-stained images, the hepatocyte cytoplasm was slightly eosinophilic, and the nuclei were reduced in size in the central zone. In the peripheral zone, erythrocytes were packed in the sinusoids. Between the two zones, a border zone showed dilated sinusoids without packed erythrocytes. The border zone was light pink on low-magnification views (Figure 3). The visibility grade of the border zone on H&E staining 1 h after RF ablation was significantly higher than immediately after RF ablation (p = 0.048) but was not significantly different among 30 min, 1 h and 2 h after RF ablation (Figures 4 and 5b). On NADH-stained images, the ablation zone was segmented into a central negative zone and a lightly stained peripheral zone. The peripheral zone was clearly visible at all time points after RF ablation. This finding did not change with time after RF ablation. TUNEL-positive hepatocytes were seen in the central and peripheral areas of the ablation zones, with TUNEL-negative hepatocytes between the central and peripheral positive zones. The grade of positively stained hepatocytes in the peripheral zone on TUNEL staining was significantly higher at 30 min and at 1 and 2 h after RF ablation than immediately after RF ablation (p = 0.048 for 30 min, 0.024 for 1 h and <0.001 for 2 h) but was not significantly different among 30 min, 1 h and 2 h after RF ablation (Figures 4 and 5c).
Correlation between gross pathology and histopathology
On gross pathology, the peripheral red zone correlated with the lightly stained peripheral zone on NADH staining, the peripheral zone on H&E staining and the peripheral positive zone on TUNEL staining. The central white zone on gross pathology correlated with the central negative zone on NADH staining. This zone also correlated with the combined central and border zones on H&E staining and the combined central positive and middle negative zones on TUNEL staining (Figure 1).
DISCUSSION
In this study, we explored chronological changes in gross pathology and histopathology of RF ablation zones early after RF ablation and correlated gross pathology with histopathology. Both gross pathology and histopathology changed with time after ablation and correlated well with each other. These results provide important information for precisely defining RF ablation zones. In addition, the boundary between the central white and peripheral red zones on gross pathology became clear with time after ablation. This result could be useful for determining the optimal point for harvesting tissue and for precisely measuring ablation zone sizes on gross pathology.
The correlation of gross pathology with histopathology is important for defining the ablation zone. H&E staining is a basic method for evaluating morphological changes in cells and surrounding structures. However, H&E staining has limited use for assessing the functional status and viability of cells. NADH staining measures the function of the enzyme NADH diaphorase and is used to evaluate cell viability.16,17 TUNEL staining detects DNA fragmentation that results from apoptotic signaling cascades and is used to evaluate cell damage.18 We used all three staining methods to evaluate the status of hepatocytes in the ablation zones. The central white zone on gross pathology correlated with the central zone on H&E staining. Hepatocytes in this zone showed slightly eosinophilic cytoplasm and small nuclei. However, the viability of hepatocytes could not be determined with only H&E staining. The hepatocytes were not positive on NADH staining, therefore the central white zone on gross pathology could be considered to have dead cells. The peripheral red zone on gross pathology correlated with the lightly stained peripheral zone on NADH staining and the peripheral positive zone on TUNEL staining. Therefore, the peripheral red zone on gross pathology could be considered to have damaged cells. Previous studies evaluated histological findings of RF ablation zones. Raman et al9 correlated the gross pathology of the RF ablation zone with H&E-stained images using a porcine liver model. The study noted haemorrhagic materials in the peripheral area of the ablation zone that correlated with the peripheral red zone on gross pathology. These results are similar to ours. However, in Ramen et al's study,9 the liver was harvested between 12 and 48 h after ablation. Hence, they could not evaluate early changes in the ablation zone. Wu et al12 also assessed changes in ablation zones during RF ablation and at 2 h and 2, 7, 14 and 21 days after RF ablation using radiological–pathological comparisons. The study reported that a lightly stained peripheral zone on NADH staining correlated with a peripheral zone that had dilated sinusoids with packed erythrocytes, which corresponds well with our results. However, Wu et al did not correlate gross pathology and histopathology, and their study did not evaluate early changes (up to 2 h) after RF ablation.
In our study, both gross pathology and histopathology findings changed with time after RF ablation. The boundary between the central white and peripheral red zones on gross pathology became clear with time after ablation. The border zone between the central and peripheral zones on H&E staining also became distinct with time. Considering these results, we propose that the clear boundary between the central white and peripheral red zones is associated with the distinct border zone on H&E staining. Hepatocytes in the peripheral red zone showed light NADH staining and positive TUNEL staining. The grade of positively stained hepatocytes on TUNEL staining was significantly higher at 30 min and at 1 and 2 h than immediately after RF ablation. This finding suggested that more damaged hepatocytes entered apoptosis with time. This result is consistent with a previous study in which a damaged zone eventually transitioned to non-viability within 2 days after RF ablation.12 The study reported that lightly stained peripheral zone on NADH staining increased rapidly within 2 h after ablation.12 However, we did not notice a rapid increase in the lightly NADH-stained peripheral zone up to 2 h after RF ablation. The reason for this discrepancy is not clear and further study on this issue is needed.
Measuring the size of the RF ablation zone precisely is important for evaluating ablation efficiency in experimental studies. Histopathology allows measurement of the ablation zones by direct evaluation of cells' viability. However, histopathological examinations are costly and time consuming. In addition, tissues shrink during processing such as during formalin fixing and paraffin embedding.19,20 Fixed tissue blocks must be trimmed for histological slides. If tissue blocks are excessively trimmed, the cut section diameter of ablation zones can decrease. For these reasons, ablation zone sizes were measured by gross pathology in previous studies comparing ablation performance.4,5 The peripheral red zone includes damaged cells, therefore measuring the entire ablation zone, including the central white and peripheral red zones, would be better. However, the boundary between the peripheral red zone and the surrounding normal liver parenchyma is not clear on gross pathology. Therefore, measuring the size of the entire ablation zone consistently is technically difficult. In our study, the boundary between the central white zone and peripheral red zone became clear 1 and 2 h after RF ablation. Therefore, measuring the central white zone on gross pathology at least 1 h after RF ablation might give the precise size of the ablation zone.
RF ablation is usually performed under the guidance of imaging studies such as ultrasound or CT. Therefore, it is relevant to correlate our results to imaging findings. Raman et al9 evaluated the chronological changes of ultrasonogram after RF ablation. According to the study of Raman et al, early sonogram obtained within 2 min after ablation showed echogenic cloud, and late sonogram obtained 2–5 min after ablation showed fading echogenic cloud centrally within larger hypoechoic lesion that is demarcated by thin hyperechoic rim. This result means that the imaging findings of ablation zone also changes as time goes on. In order to correlate ultrasonographic findings with gross pathology and histopathology, the gross specimens should be harvested immediately after evaluating ultrasonographic findings of the ablation zone at a specific time point. However, to our knowledge, these data are not currently available in the literature. We are wondering if hyperechoic rim may be overserved even after 1 and 2 h after RF ablation on ultrasonogram. Then, the most outer echogenic zone and inner hypoechoic zone on ultrasonogram may be correlated to the peripheral zone and the central zone on gross pathology and histopathology, respectively. Further study is warranted to validate this issue.
Our study had limitations. First, we could not directly compare photographs of gross specimens with scanned histological slide images because the slides required fixation and trimming. However, we obtained photographs of tissue blocks immediately before slicing specimens for slides. By comparing tissue block photographs with gross specimen photographs and slide scanned images, correlation errors could be minimized. Second, we did not evaluate chronological changes in the ablation zone size after RF ablation. To monitor size changes in vivo, radiological–pathological correlations are needed. This issue was beyond the scope of our study.
In conclusion, chronological changes in the gross pathology of RF ablation zones correlated well with histopathology. The boundary between the central white and peripheral red zone on gross pathology became clear 1 h after RF ablation. To minimize errors in size measurements of RF ablation zones, we recommend that the central white zone be measured on gross specimens harvested at least 1 h after RF ablation.
Contributor Information
Kyoung D Song, Email: kd3893.song@samsung.com.
Min Woo Lee, Email: leeminwoo0@gmail.com.
Hyunchul Rhim, Email: hc.rhim@samsung.com.
Tae Wook Kang, Email: kaienes.kang@samsung.com.
Dong Ik Cha, Email: cdisampp@gmail.com.
Jehoon Yang, Email: jehoon815.yang@samsung.com.
REFERENCES
- 1.McGahan JP, Browning PD, Brock JM, Tesluk H. Hepatic ablation using radiofrequency electrocautery. Invest Radiol 1990; 25: 267–70. doi: https://doi.org/10.1097/00004424-199003000-00011 [DOI] [PubMed] [Google Scholar]
- 2.Burdio F, Navarro A, Berjano EJ, Burdio JM, Gonzalez A, Guemes A, et al. Radiofrequency hepatic ablation with internally cooled electrodes and hybrid applicators with distant saline infusion using an in vivo porcine model. Eur J Surg Oncol 2008; 34: 822–30. [DOI] [PubMed] [Google Scholar]
- 3.Lee JM, Kim YK, Lee YH, Kim SW, Li CA, Kim CS. Percutaneous radiofrequency thermal ablation with hypertonic saline injection: in vivo study in a rabbit liver model. Korean J Radiol 2003; 4: 27–34. doi: https://doi.org/10.3348/kjr.2003.4.1.27 [DOI] [PMC free article] [PubMed] [Google Scholar]
- 4.Lee JM, Han JK, Kim SH, Sohn KL, Lee KH, Ah SK, et al. A comparative experimental study of the in-vitro efficiency of hypertonic saline-enhanced hepatic bipolar and monopolar radiofrequency ablation. Korean J Radiol 2003; 4: 163–9. doi: https://doi.org/10.3348/kjr.2003.4.3.163 [DOI] [PMC free article] [PubMed] [Google Scholar]
- 5.Cha J, Kim YS, Rhim H, Lim HK, Choi D, Lee MW. Radiofrequency ablation using a new type of internally cooled electrode with an adjustable active tip: an experimental study in ex vivo bovine and in vivo porcine livers. Eur J Radiol 2011; 77: 516–21. doi: https://doi.org/10.1016/j.ejrad.2009.09.011 [DOI] [PubMed] [Google Scholar]
- 6.Mason T, Berber E, Graybill JC, Siperstein A. Histological, CT, and intraoperative ultrasound appearance of hepatic tumors previously treated by laparoscopic radiofrequency ablation. J Gastrointest Surg 2007; 11: 1333–8. doi: https://doi.org/10.1007/s11605-007-0214-z [DOI] [PubMed] [Google Scholar]
- 7.Netto GJ, Altrabulsi B, Katabi N, Martin P, Burt K, Levy M, et al. Radio-frequency ablation of hepatocellular carcinoma before liver transplantation: a histologic and “TUNEL” study. Liver Int 2006; 26: 746–51. doi: https://doi.org/10.1111/j.1478-3231.2006.01278.x [DOI] [PubMed] [Google Scholar]
- 8.Cha CH, Lee FT, Jr, Gurney JM, Markhardt BK, Warner TF, Kelcz F, et al. CT versus sonography for monitoring radiofrequency ablation in a porcine liver. AJR Am J Roentgenol 2000; 175: 705–11. doi: https://doi.org/10.2214/ajr.175.3.1750705 [DOI] [PubMed] [Google Scholar]
- 9.Raman SS, Lu DS, Vodopich DJ, Sayre J, Lassman C. Creation of radiofrequency lesions in a porcine model: correlation with sonography, CT, and histopathology. AJR Am J Roentgenol 2000; 175: 1253–8. [DOI] [PubMed] [Google Scholar]
- 10.Leyendecker JR, Dodd GD, 3rd, Halff GA, McCoy VA, Napier DH, Hubbard LG, et al. Sonographically observed echogenic response during intraoperative radiofrequency ablation of cirrhotic livers: pathologic correlation. AJR Am J Roentgenol 2002; 178: 1147–51. doi: https://doi.org/10.2214/ajr.178.5.1781147 [DOI] [PubMed] [Google Scholar]
- 11.Hansen PD, Rogers S, Corless CL, Swanstrom LL, Siperstien AE. Radiofrequency ablation lesions in a pig liver model. J Surg Res 1999; 87: 114–21. doi: https://doi.org/10.1006/jsre.1999.5709 [DOI] [PubMed] [Google Scholar]
- 12.Wu H, Wilkins LR, Ziats NP, Haaga JR, Exner AA. Real-time monitoring of radiofrequency ablation and postablation assessment: accuracy of contrast-enhanced US in experimental rat liver model. Radiology 2014; 270: 107–16. doi: https://doi.org/10.1148/radiol.13121999 [DOI] [PMC free article] [PubMed] [Google Scholar]
- 13.Ahmed M, Solbiati L, Brace CL, Breen DJ, Callstrom MR, Charboneau JW, et al. Image-guided tumor ablation: standardization of terminology and reporting criteria—a 10-year update. Radiology 2014; 273: 241–60. doi: https://doi.org/10.1148/radiol.14132958 [DOI] [PMC free article] [PubMed] [Google Scholar]
- 14.Fujitomi Y, Kashima K, Ueda S, Yamada Y, Mori H, Uchida Y. Histopathological features of liver damage induced by laser ablation in rabbits. Lasers Surg Med 1999; 24: 14–23. doi: https://doi.org/10.1002/(sici)1096-9101(1999)24:1<14::aid-lsm4>3.3.co;2-u [DOI] [PubMed] [Google Scholar]
- 15.Ohno T, Kawano K, Sasaki A, Aramaki M, Yoshida T, Kitano S. Expansion of an ablated site and induction of apoptosis after microwave coagulation therapy in rat liver. J Hepatobiliary Pancreat Surg 2001; 8: 360–6. doi: https://doi.org/10.1007/s005340170009 [DOI] [PubMed] [Google Scholar]
- 16.Anderson JK, Baker M, Jaffers O, Pearle MS, Lindberg GL, Cadeddu JA. Time course of nicotinamide adenine dinucleotide diaphorase staining after renal radiofrequency ablation influences viability assessment. J Endourol 2007; 21: 223–7. doi: https://doi.org/10.1089/end.2005.1128 [DOI] [PubMed] [Google Scholar]
- 17.Marcovich R, Aldana JP, Morgenstern N, Jacobson AI, Smith AD, Lee BR. Optimal lesion assessment following acute radio frequency ablation of porcine kidney: cellular viability or histopathology? J Urol 2003; 170: 1370–4. doi: https://doi.org/10.1097/01.ju.0000073846.32015.45 [DOI] [PubMed] [Google Scholar]
- 18.Itoh T, Orba Y, Takei H, Ishida Y, Saitoh M, Nakamura H, et al. Immunohistochemical detection of hepatocellular carcinoma in the setting of ongoing necrosis after radiofrequency ablation. Mod Pathol 2002; 15: 110–15. doi: https://doi.org/10.1038/modpathol.3880501 [DOI] [PubMed] [Google Scholar]
- 19.Tran T, Sundaram CP, Bahler CD, Eble JN, Grignon DJ, Monn MF, et al. Correcting the shrinkage effects of formalin fixation and tissue processing for renal tumors: toward standardization of pathological reporting of tumor size. J Cancer 2015; 6: 759–66. doi: https://doi.org/10.7150/jca.12094 [DOI] [PMC free article] [PubMed] [Google Scholar]
- 20.Jonmarker S, Valdman A, Lindberg A, Hellstrom M, Egevad L. Tissue shrinkage after fixation with formalin injection of prostatectomy specimens. Virchows Arch 2006; 449: 297–301. doi: https://doi.org/10.1007/s00428-006-0259-5 [DOI] [PubMed] [Google Scholar]


