Abstract
Objective:
To compare detectability of simulated ground-glass nodules (GGNs) on chest digital tomosynthesis (CDT) among 12 images obtained at 6 radiation doses using 2 reconstruction algorithms and to analyze its association with nodular size and density.
Methods:
74 simulated GGNs [5, 8 and 10 mm in diameter/−630 and −800 Hounsfield units (HU) in density] were placed in a chest phantom in 14 nodular distribution patterns. 12 sets of coronal images were obtained using CDT at 6 radiation doses: 120 kV–10 mA/20 mA/80 mA/160 mA, 100 kV–80 mA and 80 kV–320 mA with and without iterative reconstruction (IR). 10 radiologists recorded GGN presence and locations by continuously distributed rating. GGN detectability was compared by receiver operating characteristic analysis among 12 images and detection sensitivities (DS) were compared among 12 images in subgroups classified by nodular diameters and densities.
Results:
GGN detectability at 120 kV–160 mA with IR was similar to that at 120 kV–80 mA with IR (0.614 mSv), as area under receiver operating characteristic curve was 0.798 ± 0.024 and 0.788 ± 0.025, respectively, and higher than six images acquired at 120 kV (p < 0.05). For nodules of −630 HU/8 mm, DS at 120 kV–10 mA without IR was 73.5 ± 6.0% and was similar to that by the other 11 data acquisition methods (p = 0.157). For nodules of −800 HU/10 mm, DS both at 120 kV–80 mA and 120 kV–160 mA without IR was improved by IR (56.3 ± 11.9%) (p < 0.05).
Conclusion:
CDT demonstrated sufficient detectability for larger more-attenuated GGNs (>8 mm) even in the lowest radiation dose (0.17 mSv) and improved detectability for less-attenuated GGNs with the diameter of 10 mm at submillisievert with IR.
Advances in knowledge:
IR improved detectability for larger less-attenuated simulated GGNs on CDT.
INTRODUCTION
Digital chest radiography is the most common screening methods for pulmonary nodules, and nodules can often be detected on chest radiographs retrospectively by referring to previous images of patients with known nodules.1 However, its visualization of pulmonary nodules can be affected by their size and location2 and may be insufficient because of overlapping anatomical structures reflected in two-dimensional images.3,4 By contrast, CT enables these anatomical structures to be recognized separately and, thus, has improved the detectability of small pulmonary nodules. Nevertheless, the level of radiation exposure remains high irrespective of various techniques such as iterative reconstruction (IR) algorithm.5,6 Chest digital tomosynthesis (CDT) is easily implemented in conjunction with chest radiography apparatus. This modality provides similar advantages to CT with lower radiation dose and cost by moving the X-ray tube in a limited range in combination with digital detectors.7,8 The diagnostic performance of CDT for pulmonary solid nodules was found to be superior to that of chest radiography.9 Detection and management of ground-glass nodules (GGNs) is an important issue in lung cancer screening, because persistent GGNs are often the first sign of pulmonary malignancies.10 Even for pulmonary GGNs, previous studies using simulated pulmonary nodules demonstrated that CDT had detection sensitivities (DSs) superior to those of chest radiography irrespective of nodular size11 and was comparable to those of low-dose CT (LDCT) in relatively less attenuated nodules.12
For CT images scanned at reduced or low dose, which actually varied from 50% to 80% in reduction rate based on the radiation dose level adopted in standard-dose CT images,13–15 IR algorithms16–21 can provide noise-reduced images based on different assumptions for noise recognition in image generation with the standard filtered back projection (FBP) algorithm.22,23 These reconstruction algorithms have recently been applied to breast digital tomosynthesis24 and are expected to improve the detectability of subtle pulmonary abnormalities such as GGN. To the best of our knowledge, the effects of IR algorithms on GGN detectability in CDT images under various radiation dose levels have not yet been assessed.
The purposes of this study were to compare GGN detectability for simulated nodules on CDT among images obtained at 12 acquisition methods, a combination of 6 exposure conditions and 2 reconstruction algorithms and to analyze the influence of nodular size and its CT attenuation value (CTAV) on GGN detectability.
METHODS AND MATERIALS
Image data acquisition and reconstruction
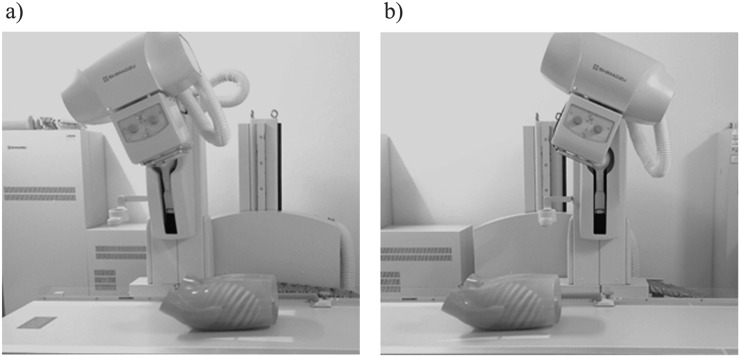
Fast scanning CDT images were obtained by using the SONIALVISION Safire 17 radiography/fluoroscopy system (Shimadzu, Kyoto, Japan) equipped with a direct-conversion digital flat-panel detector installed under the radiographic table. The matrix size of this detector was 1440 × 1440 pixels with a pitch of 150 μm, leading to an active imaging area of 43 × 43 cm. The acquisition time for 74 frames over the tube movement range of ±20° was 5 s with intermittent 3.2-mm second radiographic exposure for each frame (Figure 1).
Figure 1.
As the X-ray tube moves from the most cranial location (a) to the most caudal location (b) linearly in the reverse direction, raw data were obtained covering the entire chest phantom on the imaging table in a horizontal direction with the scan depth fixed to 30 cm and the central beam flux remaining at the centre of the detector.
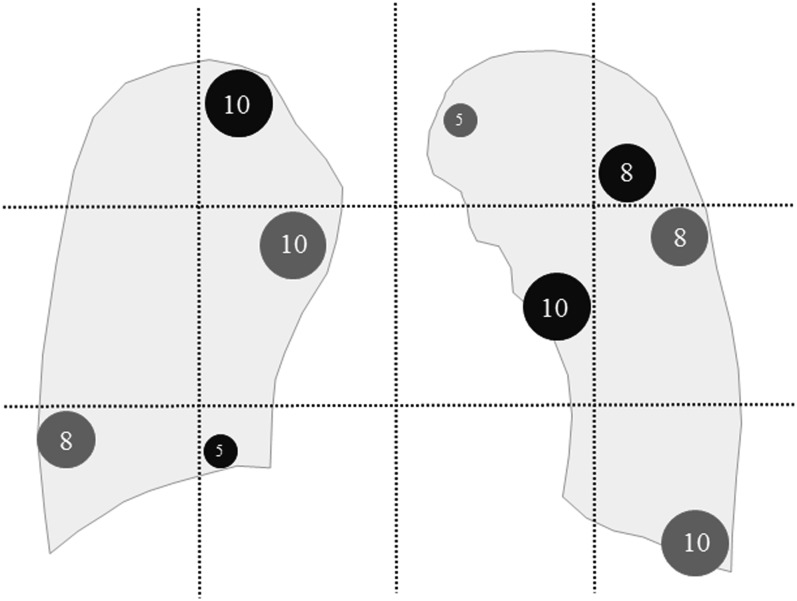
The simulated spherical GGNs used for this study were composed of three sizes (5, 8 and 10 mm in a diameter) and two densities [−630 and −800 Hounsfield units (HU)] in CTAV. We placed these 74 simulated GGNs in a chest phantom with reproduced peripheral pulmonary structures (N-1; Kyoto-Kagaku Co., Kyoto, Japan) in 14 different patterns (Table 1). A unilateral lung field was regarded as a cluster of six areas for the sake of expedience, and one nodule at most was placed in each area (Figure 2). In each of the 14 distribution patterns, 12 sets of reconstructed coronal images were obtained using CDT by 12 data acquisition methods, a combination of 6 exposure conditions (120 kV/10 mA, 120 kV/20 mA, 120 kV/80 mA, 120 kV/160 mA, 100 kV/80 mA and 80 kV/320 mA) and 2 reconstruction algorithms (IR and FBP); a reconstruction parameter for FBP was approximately 4 mm in thickness and 3-mm increments and that for IR was around 2 mm in thickness and 3-mm increments. A total of 168 sets of CDT image sets were used for nodule detection study.
Table 1.
The number of simulated nodules in 14 patterns
| Pattern | CTAV | More attenuated nodules (−630 HU) |
Less attenuated nodules (−800 HU) |
Total | ||||
|---|---|---|---|---|---|---|---|---|
| ND | 5 mm | 8 mm | 10 mm | 5 mm | 8 mm | 10 mm | ||
| 1 | 0 | 0 | 0 | 0 | 0 | 0 | 0 | |
| 2 | 1 | 2 | 1 | 1 | 1 | 2 | 8 | |
| 3 | 0 | 2 | 1 | 1 | 0 | 1 | 5 | |
| 4 | 1 | 1 | 0 | 1 | 0 | 1 | 4 | |
| 5 | 1 | 1 | 0 | 0 | 0 | 1 | 3 | |
| 6 | 1 | 1 | 1 | 0 | 2 | 1 | 6 | |
| 7 | 1 | 1 | 0 | 0 | 1 | 1 | 4 | |
| 8 | 1 | 0 | 0 | 0 | 0 | 1 | 2 | |
| 9 | 3 | 2 | 1 | 0 | 0 | 1 | 7 | |
| 10 | 1 | 2 | 1 | 1 | 1 | 1 | 7 | |
| 11 | 0 | 0 | 1 | 0 | 1 | 0 | 2 | |
| 12 | 1 | 2 | 1 | 1 | 1 | 2 | 8 | |
| 13 | 2 | 1 | 1 | 1 | 2 | 2 | 9 | |
| 14 | 1 | 2 | 2 | 1 | 1 | 2 | 9 | |
| Total | 14 | 17 | 10 | 7 | 10 | 16 | 74 | |
CTAV, CT attenuation value; HU, Hounsfield units; ND, nodular diameter.
Figure 2.
This is an example scheme of simulated nodules placement in the pre-defined 12 areas; bilateral lung fields were divided into 12 areas by 2 horizontal lines trisecting the craniocaudal distance between the lung apex and the bottom of the diaphragm and 3 vertical lines quadrisecting the distance between the lateral edges of the lung field in the CDT image. Black and dark grey nodules represent less [−800 Hounsfield units (HU)] and more attenuated nodules (−630 HU), respectively. The numbers in the simulated nodules stand for their diameters (mm).
Chest CT was performed with 64-row helical mode using a 320-row multidetector scanner (Aquilion™ ONE; Toshiba Medical Systems, Otawara, Japan). Scanning parameters were fixed: rotation time = 0.5 s, beam pitch = 0.641, z-axis coverage = 35 cm, tube voltage = 120 kV, tube current = 180 mA and field of view = 350 mm. The reconstruction parameter for transaxial and coronal images was 3-mm slice thickness without overlap.
Effective radiation doses estimated in an adult male with a standard body habitus in the USA [stature: 176 cm, body weight: 86 kg, body mass index (BMI): 27.7] were calculated with adjustment in a superior–inferior direction to be confined to lung field based on International Commission of Radiological Protection recommendation 103 (2007) using the dedicated software (PCXMC v. 2.0: a PC-based Monte Carlo program for calculating patient doses in medical radiographic examinations; STUK/radiation and nuclear authority, Helsinki, Finland).
Nodule detection study
10 radiologists, with chest radiology experience of between 2 and 29 years, were instructed to record the confidence level for the presence of a nodule in each of the 12 areas in 168 sets of images by a continuously distributed rating scale. These observers were informed that each CDT image set had at most 1 nodule in each of the 12 areas and that the CDT image included sets with no nodule or from 1 to 10 nodules. They were allowed to adjust the window level according to their preferences. During the reading experiment, they were allowed to refer to printed image examples with simulated nodules of various sizes and attenuations. In order to reduce systemic bias for each observer, the 168 sets of CDT images were randomly sorted regardless of the acquisition methods. The standard of reference for nodule detectability was determined based on transaxial and coronal reconstructed images of the multidetector CT by consensus reading of a board-certificated radiologist and a radiological technologist.
Objective image quality measurement
In order to evaluate the objective image quality for low-contrast lesions in CDT images, the contrast-to-noise ratio (CNR) was calculated independently by two observers as per the following equation: CNR = [mean attenuation value (MAV) of the simulated nodule − MAV of the background lung field]/(standard deviation of the background lung field). The simulated nodules of −800 and −630 HU with 10-mm diameter were selected for CNR analyses. Regions of interest with an area of 16 mm2 were placed on the simulated nodules and background lung fields to avoid simulated vessels carefully. The MAV and standard deviation in the background lung field was defined as the average value at the three near-by pixels circumferential to each of the simulated nodules.
Statistical analyses
GGN detection performance in the CDT images was compared among the 12 acquisition methods by using receiver operating characteristics analysis. As an index of detection performance, we used the area under the receiver operating characteristic curve (AUC), which was calculated by the trapezoidal rule. We performed the analysis of variance (ANOVA) of pseudovalues of the AUC computed by the jackknife analysis method proposed by Dorfman et al25 and post hoc pairwise comparisons with Bonferroni correction, which is designated the Dorfman–Berbaum–Metz method. The DSs for GGNs were compared among the 12 acquisition methods by using a one-way ANOVA in the total 168 image sets in the following 6 subgroups classified by the kind of simulated nodules: −630 HU/5 mm, −630 HU/8 mm, −630 HU/10 mm, −800 HU/5 mm, −800 HU/8 mm and −800 HU/10 mm. When this test was significant, pairwise comparisons among the 12 acquisition methods were performed by the Turkey–Kramer test. Moreover, each of the bilateral lung fields in the CDT images was trisected in the lateral direction based on the distance from the midline to the lateral chest wall and divided into the following three regions: inner, intermediate and outer regions. In each of these three regions, we also performed a similar subgroup analyses as described above.
For each of the IR and FBP reconstruction methods, mean differences in CNR between the radiation dose levels were analyzed by one-way ANOVA.
Statistical analyses were performed using SPSS® Base v. 11.0 (IBM Corp., New York, NY; formerly SPSS Inc., Chicago, IL) and in-house software. A p-value of <0.05 was considered to indicate statistical significance.
RESULTS
Effective radiation doses
The estimated effective radiation doses in an adult male with standard body habitus in the USA were 0.171, 0.229, 0.614, 1.142, 0.368 and 0.570 mSv at 120 kV/10 mA, 120 kV/20 mA, 120 kV/80 mA, 120 kV/160 mA, 100 kV/80 mA and 80 kV/320 mA, respectively.
Nodule detection study
In the total 168 sets of images, the overall ANOVA showed significant differences in AUC for GGN detection between the 12 acquisition methods (p < 0.001) and also showed significant differences in the AUC between the 10 observers (p < 0.001). As shown in Table 2, the AUC for GGN detection in the CDT images acquired at 120 kV/160 mA using IR (0.798 ± 0.024) was similar to that at 120 kV/80 mA using IR (0.788 ± 0.025), and it was significantly higher than AUC for GGN detection in the images acquired at 120 kV/10 mA and 120 kV/20 mA using IR and in the images acquired at all exposure combinations using FBP except for 80 kV/320 mA (p < 0.05). Furthermore, the AUC for GGN detection in the CDT images acquired at 80 kV/320 mA using IR (0.796 ± 0.025) was similar to that at 100 kV/80 mA using IR (0.776 ± 0.025), and it was significantly higher than the AUC for GGN detection in the images acquired at 120 kV/10 mA and 120 kV/20 mA using IR and in the images acquired at all exposure combinations using FBP except for 80 kV/320 mA (p < 0.05) (Table 2).
Table 2.
Area under the receiver operating characteristic curve for 10 observers
| Tube voltage (kV) | Tube current (mA) | RD (mSv) | IR | FBP |
|---|---|---|---|---|
| 120 | 10 | 0.171 | 0.743 ± 0.023 | 0.725 ± 0.026 |
| 120 | 20 | 0.229 | 0.747 ± 0.027 | 0.734 ± 0.026 |
| 120 | 80 | 0.614 | 0.788 ± 0.025a | 0.739 ± 0.024 |
| 120 | 160 | 1.142 | 0.798 ± 0.024b | 0.720 ± 0.027 |
| 100 | 80 | 0.368 | 0.776 ± 0.025c | 0.751 ± 0.026 |
| 80 | 320 | 0.570 | 0.796 ± 0.025b | 0.761 ± 0.027 |
FBP, filtered back projection; IR, iterative reconstruction; RD, estimated radiation dose.
Significantly higher than the images acquired using IR at 120 kV/10 mA and using FBP at 120 kV/10, 20, 80 and 160 mA.
Significantly higher than the images acquired using IR at 120 kV/10 mA and 20 mA and using FBP at 120 kV/10, 20, 80, and 160 mA, and 100 kV/80 mA.
Significantly higher than the images acquired using FBP at 120 kV/10 and 160 mA.
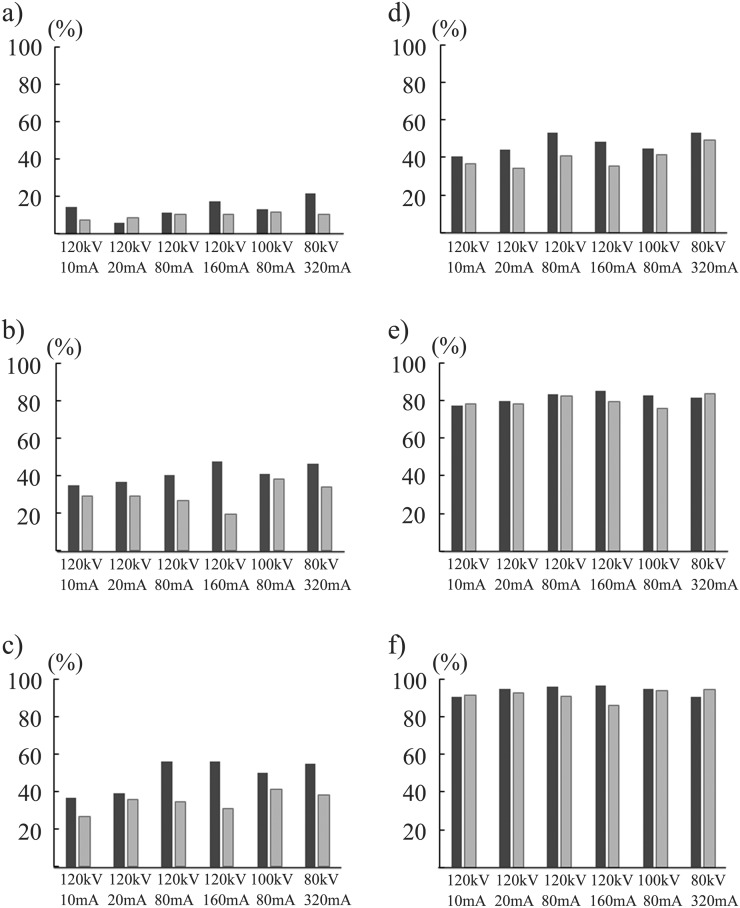
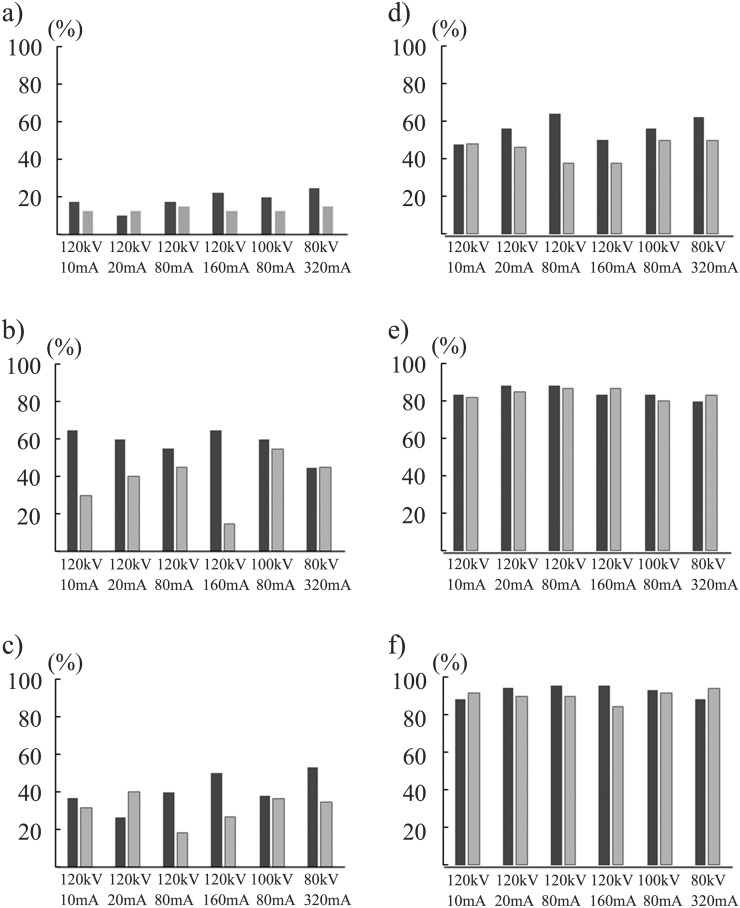
The ANOVA showed no statistical difference in DS between the 12 acquisition methods (p = 0.157) for the simulated nodules of −630 HU and all three diameters. For the nodules of −630 HU/8 mm, DS in the CDT images acquired at 120 kV/10 mA using FBP was 78.5 ± 6.0% and showed similar values in the images obtained by the other 11 methods. For the nodules of −800 HU/10 mm, the DS in the CDT images acquired at 120 kV/80 mA and 120 kV/160 mA using IR was 56.3 ± 11.9% and was significantly higher than that in the images acquired at the four exposure combinations of 120 kV using FBP (p < 0.05) (Figure 3).
Figure 3.
Detection sensitivities at six radiation dose levels for simulated nodules of −800 Hounsfield units (HU) with diameters of 5 mm (a), 8 mm (b) and 10 mm (c), and of −630 HU with diameters of 5 mm (d), 8 mm (e) and 10 mm (f) are demonstrated. Black and grey bar graphs stand for the mean value for 10 observers by iterative reconstruction and filtered back projection algorithm, respectively.
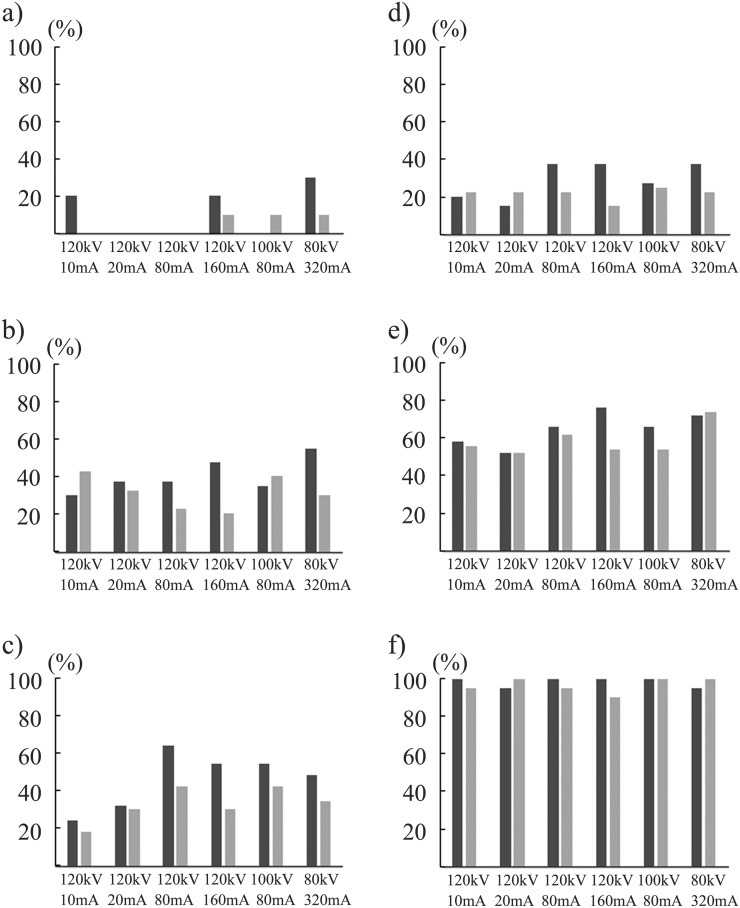
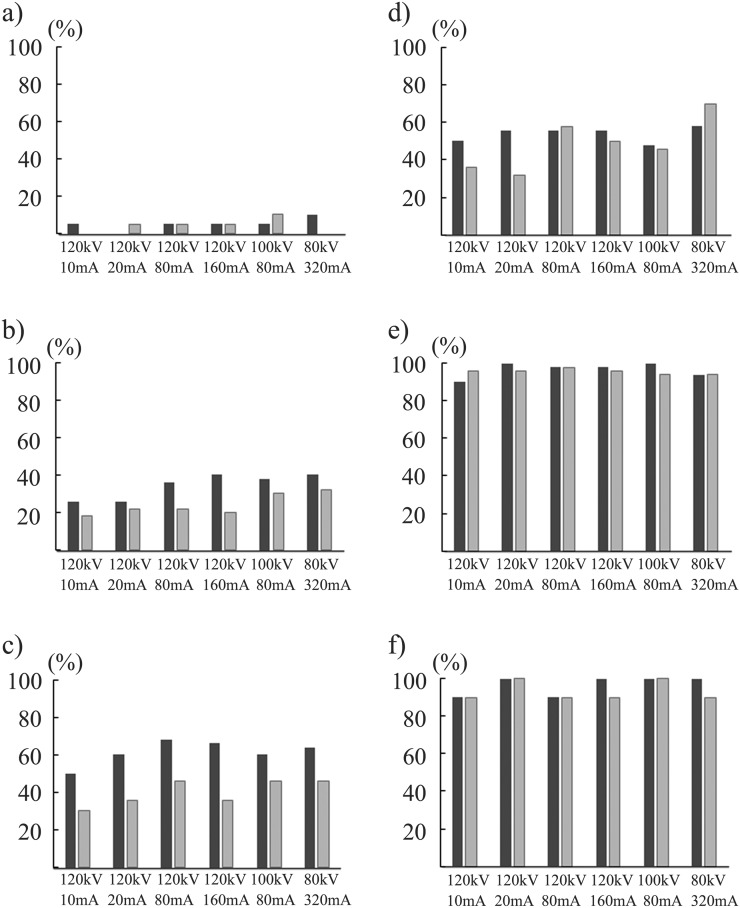
In region-based subanalyses, the DS for nodules of −800 HU/10 mm in the inner region was significantly higher in the CDT images acquired at 120 kV/80 mA using IR than those at 120 kV/10 mA and 120 kV/20 mA using IR and FBP and at 120 kV/160 mA using FBP (p < 0.05) (Figure 4). In the intermediate region, the DSs for the nodules of −800 HU/10 mm in the CDT images acquired at 120 kV/160 mA and 80 kV/320 mA using IR were significantly higher than those at 120 kV/20 mA, 120 kV/80 mA and 120 kV/160 mA using IR (p < 0.05) (Figure 5). By contrast, in the outer region, the DSs were similar among the 12 data acquisition methods irrespective of the nodule size and CTAV, except for the superiority of images acquired at 120 kV/80 mA using IR over those at 120 kV/10 mA using FBP for nodules of −800 HU/10 mm (p < 0.05) (Figure 6).
Figure 4.
Detection sensitivities at six radiation dose levels in the inner region for simulated nodules of −800 Hounsfield units (HU) with diameter of 5 mm (a), 8 mm (b) and 10 mm (c), and of −630 HU with the diameters 5 mm (d), 8 mm (e) and 10 mm (f) are demonstrated. Black and grey bar graphs stand for the mean value for 10 observers by iterative reconstruction and filtered back projection algorithm, respectively.
Figure 5.
Detection sensitivities at six radiation dose levels in the intermediate region for simulated nodules of −800 Hounsfield units (HU) with diameters of 5 mm (a), 8 mm (b) and 10 mm (c), and of −630 HU with diameters of 5 mm (d), 8 mm (e) and 10 mm (f) are demonstrated. Black and grey bar graphs stand for the mean value for 10 observers by iterative reconstruction and filtered back projection algorithm, respectively.
Figure 6.
Detection sensitivities at six radiation dose levels in the outer region for simulated nodules of −800 Hounsfield units (HU) with diameters of 5 mm (a), 8 mm (b) and 10 mm (c), and of −630 HU with diameters of 5 mm (d), 8 mm (e) and 10 mm (f) are demonstrated. Black and grey bar graphs stand for the mean value for 10 observers by iterative reconstruction and filtered back projection algorithm, respectively.
Objective image quality
For each of the IR and FBP reconstruction methods, the ANOVA indicated no significant differences in the CNR between the six acquisition methods in the CDT images, although the CNR in the CDT images acquired at 120 kV/160 mA using IR was higher than that obtained by the other five acquisition methods using IR (Table 3).
Table 3.
Comparison in objective image quality among radiation dose levels in iterative reconstruction (IR) and filtered back projection (FBP)
| TV (kV) | TC (mA) | CNR for less attenuated nodules (−800 HU) |
CNR for more attenuated nodules (−630 HU) |
||
|---|---|---|---|---|---|
| IR | FBP | IR | FBP | ||
| 120 | 10 | 1.97 ± 1.32 | 0.98 ± 0.40 | 0.96 ± 0.30 | 0.61 ± 0.30 |
| 120 | 20 | 2.07 ± 0.76 | 1.07 ± 0.26 | 1.04 ± 0.35 | 0.63 ± 0.34 |
| 120 | 80 | 2.67 ± 1.46 | 1.41 ± 0.67 | 1.22 ± 0.32 | 0.71 ± 0.37 |
| 120 | 160 | 3.05 ± 1.80 | 1.66 ± 0.73 | 1.54 ± 0.67 | 0.96 ± 0.37 |
| 100 | 80 | 2.52 ± 1.46 | 1.23 ± 0.52 | 1.09 ± 0.37 | 0.69 ± 0.30 |
| 80 | 320 | 3.02 ± 1.35 | 1.63 ± 0.63 | 1.23 ± 0.38 | 0.75 ± 0.35 |
| p-value | 0.337 | 0.624 | 0.742 | 0.301 | |
CNR, contrast-to-noise ratio; HU, Hounsfield units; TC, tube current; TV, tube voltage.
DISCUSSION
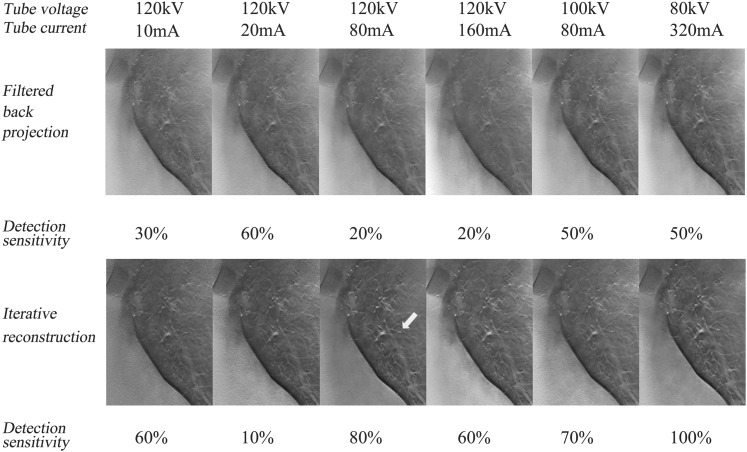
In this study, we demonstrated the potential benefits of IR for GGN detectability in the CDT images acquired at 120 kV/80 mA and lower radiation doses of submillisievert estimated in patients with standard body habitus (0.614 mSv), mainly due to improved DS in larger nodules of −800 HU/10 mm as compared with that in the corresponding images reconstructed with FBP (Figure 7). Although the estimated effective dose varied from 0.10 to 0.36 mSv in the past studies assessing GGN detectability by using CDT at reduced doses,11,26–30 CDT have demonstrated superiority in the GGN detectability to chest radiography even at an effective dose of 0.10–0.19 mSv; however, CDT has not yet achieved its comparability to LDCT at such doses.31 Whereas, on CT images obtained at a similar dose to chest radiography (effective dose: 0.13–0.29 mSv),21,31,32 beneficial effects of IR on image noise reduction and comparability in GGN detectability to LDCT have been shown. By contrast, in our study, at least 0.641 mSv was demonstrated to be required to obtain the advantageous effect of IR on CDT images. For the smaller nodules (≤8 mm) of −800 HU, the DS of GGN in the CDT images acquired at 120 kV/160 mA (1.142 mSv) using IR (i.e. 33%) in our study was comparable to that using FBP in the Doo et al's11 study (36%) (0.36 mSv). This comparability appears to be inconsistent with the benefits by IR for GGN detectability on CDT image; however, the discrepancy may be because detectability especially for less-attenuated GGNs could be greatly affected by nodular size and location.33 Actually for the total nodules of −800 HU in this study, DS of GGN in the CDT images obtained at 120 kV/20 mA (0.229 mSv) using FBP (17%) was much lower than that (33%) in the Zhao et al's study (0.16 mSv). The DS of more-attenuated nodules of −630 HU in the CDT images reconstructed with IR also tended to get better as the radiation dose increased in both inner and intermediate regions.
Figure 7.
Coronal reconstructed images including simulated nodules of −800 Hounsfield units (HU) with the diameter of 10 mm placed in the inner region of the left lung field (white arrow) at six radiation doses by filtered back projection and iterative reconstruction are demonstrated.
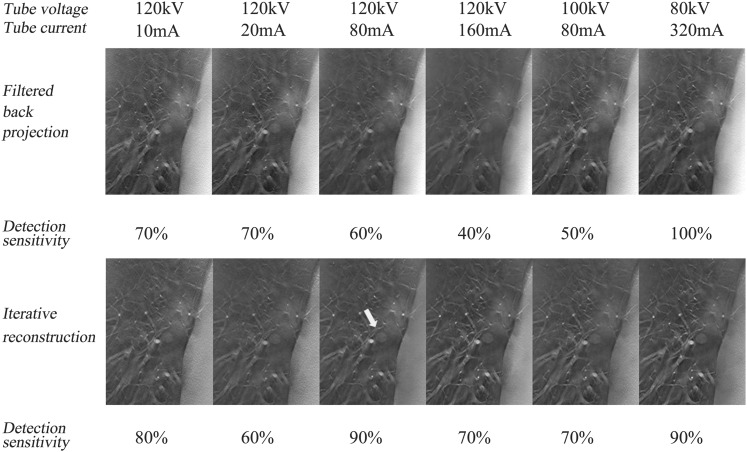
For the nodules of −630 HU, the DS of GGN on the CDT images acquired at the least radiation dose using FBP was equivalent to that in the corresponding images obtained by the other 11 acquisition methods, regardless of the nodular sizes (Figure 8). For the smaller (≤8 mm) simulated nodules of −630 HU, the DS of GGN on the CDT images acquired at 120 kV/10 mA (0.171 mSv) in this study (56%) is similar to that in the Doo et al's study11 (49%) (0.1 mSv). For these smaller simulated nodules of −630 HU, the DS in the CDT images at 120 kV/80 mA (0.614 mSv) using IR (69%) is almost comparable to the DS in LDCT (72%) in the Doo et al's11 study (0.47 mSv). CDT obtained at submillisievert using IR can be an alternative method to detect smaller and more attenuated GGNs with relatively lower cost.31
Figure 8.
Coronal reconstructed images including simulated nodules of −630 Hounsfield units (HU) with the diameter of 8 mm placed in the inner region of the right lung field (white arrow) at six radiation doses by filtered back projection and iterative reconstruction are demonstrated.
In comparison of CDT images obtained at different tube voltages under the equivalent X-ray photon levels, the CNR in the CDT images acquired at lower tube voltages was superior to that at higher tube voltages mainly due to higher image contrast, which was enhanced by a combination with the IR algorithm. These results indicate that CDT obtained at lower tube voltages will give higher contrast images. Here, from the relationship between GGN detectability and radiation dose, the radiation dose can be considered to be necessary to a certain extent to get the benefit of the IR algorithm in CDT images.
There are some limitations in this study. First, concerning GGN detectability, the CDT images were not compared with chest radiography or LDCT images under similar radiation dose levels. Further comparative studies between CDT and chest radiography are required for confirming the advantageous impacts of IR technique on GGN detectability over chest radiography. Second, discrepancy between pre-set and actual tube currents became larger as the tube currents decreased. These results reflect difficulty in controlling tube current for intermittent short-duration pulse X-rays. This limitation needs to be considered for further research and clinical trials by using CDT at low-dose conditions. Finally, for the assessment of clinical nodule detection, other factors such as the association between respiratory levels and lung field densities should be taken into consideration. Actually, a relevant comparative study is under way as another research project in this institution.
In conclusion, CDT was demonstrated to have sufficient GGN detection performance for the simulated nodules of −630 HU and a diameter of 8 and 10 mm in the images obtained at the lowest radiation dose (0.17 mSv), and its DS for the simulated nodules of −800 HU/10 mm was shown to be improved in the images acquired at submillisievert using the IR algorithm.
Acknowledgments
ACKNOWLEDGMENTS
The authors attest to the fact that we have no conflict of interest including financial or personal relationships that inappropriately influence our actions. The authors acknowledge the great assistance of Mr Mikio Moriyama and Mr Akira Kasai (Shimadzu Corporation) for their technical support and important suggestions.
Contributor Information
Katsunori Miyata, Email: katsu@belle.shiga-med.ac.jp.
Yukihiro Nagatani, Email: yatsushi@belle.shiga-med.ac.jp.
Mitsuru Ikeda, Email: mikeda@nagoya-u.jp.
Masashi Takahashi, Email: masashi@belle.shiga-med.ac.jp.
Norihisa Nitta, Email: r34nitta@yahoo.co.jp.
Satoru Matsuo, Email: satoru.matsuo@gmail.com.
Shinichi Ohta, Email: junryuhei@yahoo.co.jp.
Hideji Otani, Email: otani@belle.shiga-med.ac.jp.
Ayumi Nitta-Seko, Email: ayumis@belle.shiga-med.ac.jp.
Yoko Murakami, Email: monn@belle.shiga-med.ac.jp.
Keiko Tsuchiya, Email: keikot@belle.shiga-med.ac.jp.
Akitoshi Inoue, Email: akino@belle.shiga-med.ac.jp.
Sayaka Misaki, Email: misakisa118@yahoo.co.jp.
Khishigdorj Erdenee, Email: kishaugust@gmail.com.
Tetsuo Kida, Email: kida@belle.shiga-med.ac.jp.
Kiyoshi Murata, Email: murata@belle.shiga-med.ac.jp.
REFERENCES
- 1.Muhm JR, Miller WE, Fontana RS, Sanderson DR, Uhlenhopp MA. Lung cancer detected during a screening program using four-month chest radiographs. Radiology 1983; 148: 609–15. doi: https://doi.org/10.1148/radiology.148.3.6308709 [DOI] [PubMed] [Google Scholar]
- 2.Godfrey DJ, McAdams HP, Dobbins JT, 3rd. Optimization of the matrix inversion tomosynthesis (MITS) impulse response and modulation transfer function characteristics for chest imaging. Med Phys 2006; 33: 655–67. doi: https://doi.org/10.1118/1.2170398 [DOI] [PubMed] [Google Scholar]
- 3.Speets AM, van der Graaf Y, Hoes AW, Kalmijn S, Sachs AP, Rutten MJ, et al. Chest radiography in general practice: indications, diagnostic yield and consequences for patient management. Br J Gen Pract 2006; 56: 574–8. [PMC free article] [PubMed] [Google Scholar]
- 4.Håkansson M, Båth M, Börjesson S, Kheddache S, Johnsson AA, Månsson LG. Nodule detection in digital chest radiography: effect of system noise. Radiat Prot Dosimetry 2005; 114: 97–101. doi: https://doi.org/10.1093/rpd/nch525 [DOI] [PubMed] [Google Scholar]
- 5.Schenzle JC, Sommer WH, Neumaier K, Michalski G, Lechel U, Nikolaou K, et al. Dual energy CT of the chest: how about the dose? Invest Radiol 2010; 45: 347–53. doi: https://doi.org/10.1097/RLI.0b013e3181df901d [DOI] [PubMed] [Google Scholar]
- 6.Lell MM, May M, Deak P, Alibek S, Kuefner M, Kuettner A, et al. High-pitch spiral computed tomography: effect on image quality and radiation dose in pediatric chest computed tomography. Invest Radiol 2011; 46: 116–23. doi: https://doi.org/10.1097/RLI.0b013e3181f33b1d [DOI] [PubMed] [Google Scholar]
- 7.Dobbins JT, 3rd, McAdams HP, Godfrey DJ, Li CM. Digital tomosynthesis of the chest. J Thorac Imaging 2008; 23: 86–92. doi: https://doi.org/10.1097/RTI.0b013e318173e162 [DOI] [PubMed] [Google Scholar]
- 8.Mascaux C, Peled N, Garg K, Kato Y, Wynes MW, Hirsch FR. Early detection and screening of lung cancer. Expert Rev Mol Diagn 2010; 10: 799–815. doi: https://doi.org/10.1586/erm.10.60 [DOI] [PubMed] [Google Scholar]
- 9.Yamada Y, Jinzaki M, Hasegawa I, Shiomi E, Sugiura H, Abe T, Fast scanning tomosynthesis for the detection of pulmonary nodules: diagnostic performance compared with chest radiography, using multidetector-row computed tomography as the reference. Invest Radiol 2011; 46: 471–7. doi: https://doi.org/10.1097/RLI.0b013e318217b838 [DOI] [PubMed] [Google Scholar]
- 10.Sone S, Kasuga T, Sakai F, Aoki J, Izuno I, Tanizaki Y, et al. Development of a high resolution digital tomosynthesis system and its clinical application. Radiographics 1991; 11: 807–22. doi: https://doi.org/10.1148/radiographics.11.5.1947318 [DOI] [PubMed] [Google Scholar]
- 11.Doo KW, Kang EY, Yong HS, Ham SY, Lee KY, Choo JY. Comparison of chest radiography, chest digital tomosynthesis and low dose MDCT to detect small ground-glass opacity nodules: an anthropomorphic chest phantom study. Eur Radiol 2014; 24: 3269–76. doi: https://doi.org/10.1007/s00330-014-3376-6 [DOI] [PubMed] [Google Scholar]
- 12.Zhao F, Zeng Y, Peng G, Yu R, Peng S, Tan H, et al. Experimental study of detection of nodules showing ground-glass opacity and radiation dose by using anthropomorphic chest phantom: digital tomosynthesis and multidetector CT. J Comput Assist Tomogr 2012; 36: 523–7. doi: https://doi.org/10.1097/RCT.0b013e318266aa71 [DOI] [PubMed] [Google Scholar]
- 13.Kalra MK, Woisetschläger M, Dahlström N, et al. Sinogram-affirmed iterative reconstruction of low-dose chest CT: effect on image quality and radiation dose. AJR Am J Roentgenol 2013; 201: W235–244. doi: https://doi.org/10.2214/AJR.12.9569 [DOI] [PubMed] [Google Scholar]
- 14.Katsura M, Matsuda I, Akahane M, Sato J, Akai H, Yasaka K, et al. Model-based iterative reconstruction technique for radiation dose reduction in chest CT: comparison with the adaptive statistical iterative reconstruction technique. Eur Radiol 2012; 22: 1613–23. doi: https://doi.org/10.1007/s00330-012-2452-z [DOI] [PubMed] [Google Scholar]
- 15.Winklehner A, Karlo C, Puippe G, Schmidt B, et al. Raw data-based iterative reconstruction in body CTA: evaluation of radiation dose saving potential. Eur Radiol 2011; 21: 2521–6. doi: https://doi.org/10.1007/s00330-011-2227-y [DOI] [PubMed] [Google Scholar]
- 16.Ohno Y, Takenaka D, Kanda T, Yoshikawa T, Matsumoto S, Sugihara N, et al. Adaptive iterative dose reduction using 3D processing for reduced- and low-dose pulmonary CT: comparison with standard-dose CT for image noise reduction and radiologic findings. AJR Am J Roentgenol 2012; 199: W477–85. doi: https://doi.org/10.2214/AJR.11.8275 [DOI] [PubMed] [Google Scholar]
- 17.Yamada Y, Jinzaki M, Hosokawa T, Tanami Y, Sugiura H, Abe T, et al. Dose reduction in chest CT: comparison of the adaptive iterative dose reduction 3D, adaptive iterative dose reduction, and filtered back projection reconstruction techniques. Eur J Radiol 2012; 81: 4185–95. doi: https://doi.org/10.1016/j.ejrad.2012.07.013 [DOI] [PubMed] [Google Scholar]
- 18.Pontana F, Pagniez J, Duhamel A, Flohr T, Faivre JB, Murphy C, et al. Reduced-dose low-voltage chest CT angiography with sinogram-affirmed iterative reconstruction versus standard-dose filtered back projection. Radiology 2013; 267: 609–18. doi: https://doi.org/10.1148/radiol.12120414 [DOI] [PubMed] [Google Scholar]
- 19.Yang WJ, Yan FH, Liu B, Pang LF, Hou L, Zhang H, et al. Can sinogram-affirmed iterative (SAFIRE) reconstruction improve imaging quality on low-dose lung CT screening compared with traditional filtered back projection (FBP) reconstruction? J Comput Assist Tomogr 2013; 37: 301–5. doi: https://doi.org/10.1097/RCT.0b013e31827b8c66 [DOI] [PubMed] [Google Scholar]
- 20.Singh S, Kalra MK, Gilman MD, Hsieh J, Pien HH, Digumarthy SR, et al. Adaptive statistical iterative reconstruction technique for radiation dose reduction in chest CT: a pilot study. Radiology 2011; 259: 565–73. doi: https://doi.org/10.1148/radiol.11101450 [DOI] [PubMed] [Google Scholar]
- 21.Nagatani Y, Takahashi M, Murata K, Ikeda M, Yamashiro T, Miyara T, et al. Lung nodule detection performance in five observers on computed tomography (CT) with adaptive iterative dose reduction using three-dimensional processing (AIDR 3D) in a Japanese multicenter study: comparison between ultra-low-dose CT and low-dose CT by receiver-operating characteristic analysis. Eur J Radiol 2015; 84: 1401–12. doi: https://doi.org/10.1016/j.ejrad.2015.03.012 [DOI] [PubMed] [Google Scholar]
- 22.Pontana F, Pagniez J, Flohr T, Faivre JB, Duhamel A, Remy J, et al. Chest computed tomography using iterative reconstruction vs filtered back projection. Part 1. Evaluation of image noise reduction in 32 patients. Eur Radiol 2011; 21: 627–35. doi: https://doi.org/10.1007/s00330-010-1990-5 [DOI] [PubMed] [Google Scholar]
- 23.Pontana F, Duhamel A, Pagniez J, Flohr T, Faivre JB, Hachulla AL, et al. Chest computed tomography using iterative reconstruction vs filtered back projection. Part 2. Image quality of low-dose CT examination in 80 patients. Eur Radiol 2011; 21: 636–43. doi: https://doi.org/10.1007/s00330-010-1991-4 [DOI] [PubMed] [Google Scholar]
- 24.Svahan TM, Houssami N. Evaluation of time-efficient reconstruction methods in digital breast tomosynthesis. Radiat Prot Dosimetry 2015; 165: 331–6. doi: https://doi.org/10.1093/rpd/ncv079 [DOI] [PubMed] [Google Scholar]
- 25.Dorfman DD, Berbaum KS, Metz CE. Receiver operating characteristic rating analysis: generalization to the population of readers and patients with the jackknife method. Invest Radiol 1992; 27: 723–31. doi: https://doi.org/10.1097/00004424-199209000-00015 [PubMed] [Google Scholar]
- 26.Quaia E, Baratella E, Cernic S, Lorusso A, Casagrande F, Cioffi V, et al. Analysis of the impact of digital tomosynthesis on the radiological investigation of patients with suspected pulmonary lesions on chest radiography. Eur Radiol 2012; 22: 1912–22. doi: https://doi.org/10.1007/s00330-012-2440-3 [DOI] [PubMed] [Google Scholar]
- 27.Vikgren J, Zachrisson S, Svalkvist A, Johnsson AA, Boijsen M, Flinck A, et al. Comparison of chest tomosynthesis and chest radiography for detection of pulmonary nodules: human observer study of clinical cases. Radiology 2008; 249: 1034–41. doi: https://doi.org/10.1148/radiol.2492080304 [DOI] [PubMed] [Google Scholar]
- 28.Quaia E, Baratella E, Poillucci G, Kus S, Cioffi V, Cova MA. Digital tomosynthesis as a problem-solving imaging technique to confirm or exclude potential thoracic lesions based on chest X-ray radiography. Acad Radiol 2013; 20: 546–53. doi: https://doi.org/10.1016/j.acra.2012.12.009 [DOI] [PubMed] [Google Scholar]
- 29.Jung HN, Chung MJ, Koo JH, Kim HC, Lee KS. Digital tomosynthesis of the chest: utility for detection of lung metastasis in patients with colorectal cancer. Clin Radiol 2012; 67: 232–8. doi: https://doi.org/10.1016/j.crad.2011.08.017 [DOI] [PubMed] [Google Scholar]
- 30.Zachrisson S, Vikgren J, Svalkvist A, Johnsson AA, Boijsen M, Flinck A, et al. Effect of clinical experience of chest tomosynthesis on detection of pulmonary nodules. Acta Radiol 2009; 50: 884–91. doi: https://doi.org/10.1080/02841850903085584 [DOI] [PubMed] [Google Scholar]
- 31.Molk N, Seeram E. Digital tomosynthesis of the chest: a literature review. Radiography 2015; 21: 197–202. [Google Scholar]
- 32.Sui X, Meinel FG, Song W, Xu X, Wang Z, Wang Y, et al. Detection and size measurements of pulmonary nodules in ultra-low-dose CT with iterative reconstruction compared to low dose CT. Eur J Radiol 2016; 85: 564–70. doi: https://doi.org/10.1016/j.ejrad.2015.12.013 [DOI] [PubMed] [Google Scholar]
- 33.Hashemi S, Mehrez H, Cobbold RS, Paul NS. Optimal image reconstruction for detection and characterization of small pulmonary nodules during low-dose CT. Eur Radiol 2014; 24: 1239–50. doi: https://doi.org/10.1007/s00330-014-3142-9 [DOI] [PubMed] [Google Scholar]


