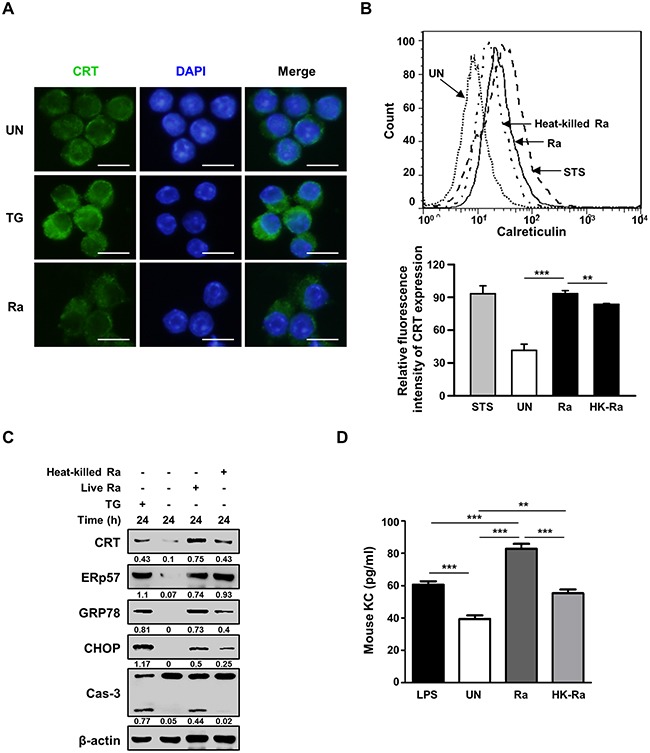
Figure 2. Live but not heat-killed Mtb cause translocation of CRT to the plasma membrane in macrophages.

(A) Raw 264.7 cells were infected with Mtb H37Ra (MOI=10) for 24 h. Cells were stained with anti-CRT antibody (green) for immunofluorescence. Cell nuclei were visualized by DAPI staining (blue). Scale bar: 20 μm. (B-D) Raw 264.7 cells were infected with live or heat-killed Mtb H37Ra (MOI=10) for 24 h. (B) Cell-surface CRT expression was analyzed by flow cytometry. Staurosporine (STS; 500 nM, 18 h) served as the positive control. (C) Western blot analysis of CRT, ERp57, GRP78, CHOP, caspase-3, and β-actin levels. Western blot data presented are representative of three independent experiments. (D) KC production was measured by ELISA at 24 h post-infection. Numbers below the blot indicate the intensities ratios of each target protein to the β-actin control in each lane. The data are means ± SD of three independent experiments. *p<0.05, **p<0.01, ***p<0.001.
