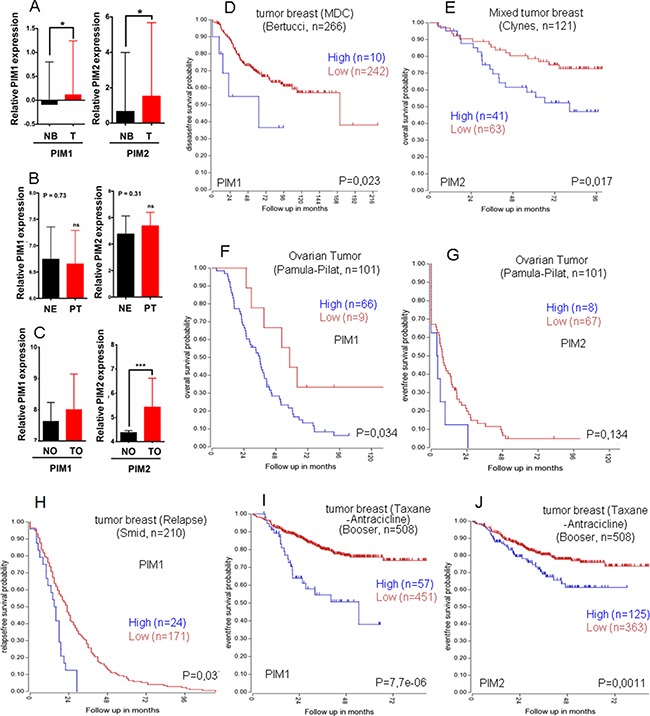
Figure 4. Relative PIM expression in human breast, endometrial and ovary tumors, Role in survival.

Relative PIM expression in human breast (A), endometrial (B) and ovary tumors (C). Patients were classified into groups based on the PIM1/2 gene expression level. A) Normal Breast (NB), Primary tumor (T); PIM1 p < 0,05 =*; PIM2 p <0,05 =*, by an unpaired t-test). B) Normal endometrium (NE), Primary tumor (PT); PIM1 p =0,73; PIM2 p = 0,31, by an unpaired t-test), ns = not statistically significant. C) Normal ovary (NO), Ovary tumor (TO); PIM1 p < 0,05; PIM2 p < 0,001 = ***, by an unpaired t-test), ns = not statistically significant. (D) Kaplan Meyer graph for disease free survival according to PIM1 levels in Breast cancer (public database used Bertucci, R2); (E) Kaplan Meyer graph for overall survival according to PIM2 levels in Breast cancer (public database used Clynes, R2); (F) Kaplan Meyer graph for overall survival according to PIM1 levels in ovarian cancer (public database used Pamula-Pilat, R2); (G) Kaplan Meyer graph for event free survival according to PIM2 levels in Ovarian cancer (public database used Pamula-Pilat, R2). (H–J) PIM overexpression in human breast tumors is indicative of worse prognosis in relapsed (H) or treatment resistant tumors (I-J). Kaplan Meyer graphs for relapse free survival from Public databases only from relapsed breast tumors (Smid, R2) according to PIM1 levels. (I, J). Kaplan Meyer graphs for event free survival from Public databases only from taxane and antracicline treated patients with breast tumors (Booser, R2) according to PIM1 (I) or to PIM2 (J) levels.
