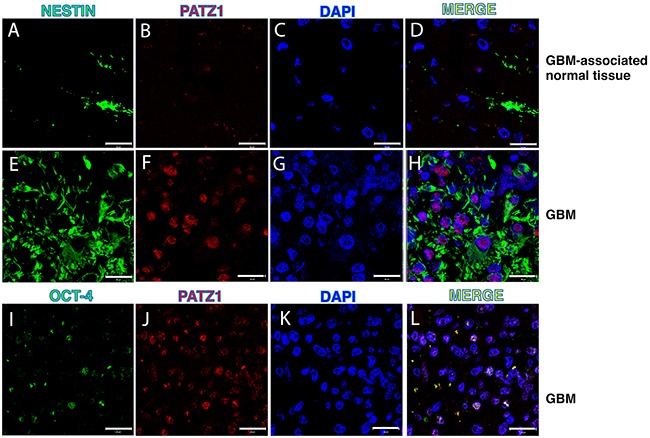
Figure 5. PATZ1 localization in the stem cell compartment of GBM.

Representative confocal microscopy images of GBM (two samples with high PATZ1 score (+++) and GBM-associated normal tissues stained with anti-NESTIN (A, E), anti-OCT-4 (I) and anti-PATZ1 (B, F, J). (D, H, L) Merge images showing co-localization of PATZ1 with either NESTIN or OCT-4. Scale bar: 20 μm. (C, G, K) Nuclei are depicted by the blue fluorescence of DAPI.
